


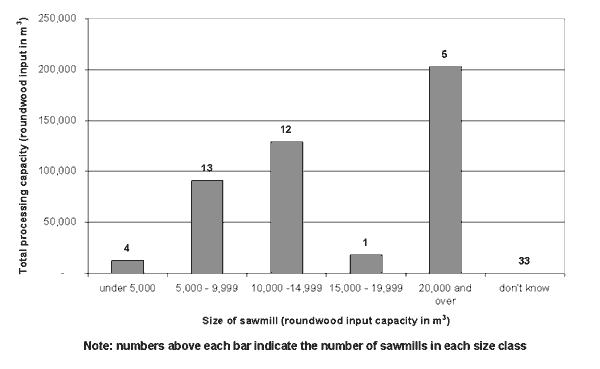
Figure 2 Capacity of sawmills in different size classes in Suriname (1990, partially updated to 1998)
Source: 1990 sawmill survey (LBB), partially updated to 1998 by the author
Capacity utilisation. Estimates of capacity utilisation are available for 27 sawmills (including the five known not to be currently operating). Thirteen of these estimates were obtained from interviews with sawmillers and staff of LBB and can considered as being recent, the remainder were taken from the results of the 1990 sawmill survey. Based on these estimates, total roundwood intake would appear to be at least 200,000 m3/year, giving a capacity utilisation figure of 52% for the mills where this information is known. It is suspected however, that capacity utilisation is actually much lower than this for two reasons. Firstly, the new MUSA sawmill has significantly increased processing capacity, but is currently not able to export much of its product because of poor market conditions in Southeast Asia. Consequently, it has been selling large volumes of sawnwood on the domestic market (which has probably not grown significantly since 1990) which has caused other sawmillers to reduce their output. Secondly, the average capacity utilisation rate of the sawmills visited during this assignment was much lower than 50%. Taking into account these observations, it would seem that current capacity utilisation across the sawmilling sector in Suriname might be as low as 35% - 40%. This would be equal to an annual roundwood intake of 160,000 m3/year to 180,000 m3/year, which is roughly the same as estimated roundwood production in Suriname (see: Section 3.5.3 Information about forest product production and trade in Suriname, below).
Product recovery. Estimates of product recovery, or the proportion of roundwood which is manufactured into finished forest products, are available for 19 sawmills in Suriname. On average, these mills claimed to achieve a 43% recovery rate. However, the discussions with sawmillers and LBB staff suggested that there was considerable uncertainty about this number. Many were really quite unsure about what their recovery rates were and gave answers such as: "about 50%". It was also pointed out that, in many cases, sawmillers still think in terms of mean length and quarter girth rather than cubic metres in Suriname and, consequently, measure their log input in terms of the roughly squared log entering the gangsaw after it has been through the first cut. It was felt, therefore, that a figure of 33% might actually be closer to the truth. This is quite low, particularly considering the quality of sawnwood generally produced in Suriname (i.e. there are few losses from planing and drying because very few high quality products are produced).
Number of traders. Twenty-four traders exported sawnwood during 1997. In addition to these, there may be a few other traders who buy and sell sawnwood on the domestic market. Traders accounted for just under 2,000 m3 of sawnwood exports in 1997 or 30% of total exports. All of these traders are believed to be located in Paramaribo.
Domestic and export sales. Sawmillers exported six percent of their estimated output in 1997 and two sawmills (Bruynzeel and MUSA) accounted for the majority of exports. Some domestic sales were, however, exported by traders, bringing the total export level up to nine percent of estimated production. It is believed that export sales have declined in 1998.
Stihl mills. In addition to all of the above, there are also a number of individuals producing sawnwood using chainsaws in Suriname. These "Stihl mills" produce rough sawnwood for the domestic market and are thought to mainly serve the population of the interior of the country (around 10,000 to 20,000 people). The number of such operators is not known, nor was it possible to collect any information about them. The size and impact of this part of the sawmilling sector in Suriname might be a useful topic for further investigation.
In summary, the sawmilling sector in Suriname is currently characterised by overcapacity and low recovery rates. The level of overcapacity is even worse than indicated above, when it is considered that all these figures have been calculated on a single 8-hour shift basis and in many countries sawmills operate for nearly 24 hours per day.
The size of the domestic market is very small and many sawmills are currently finding it difficult to develop export markets for their products. There are a number of reasons for this (see: Section 3.6 Qualitative information on the forest economy of Suriname). The presence of traders in the export market is an interesting development. The fact that they have now captured 30% of the export market would suggest that they either have some advantage or provide a service which sawmillers do not.
Information about forest product production and trade in Suriname
Information about forest product production and trade in Suriname was collected from the records of LBB. Table 42 shows recorded roundwood production over the last 11 years. Roundwood production has increased over the period to around 180,000 m3/year. Much of this increase has occurred in the last few years and can be attributed to: the ending of the civil war; growth in log exports; the opening of the large new MUSA sawmill; and general improvements in data collection. However, despite recent improvements in data collection, it is still quite possible that a large volume of roundwood production goes unrecorded each year.
Table 42 Recorded annual roundwood production in Suriname 1987 - 1997
|
Product |
1987 |
1988 |
1989 |
1990 |
1991 |
1992 |
1993 |
1994 |
1995 |
1996 |
1997 |
|
Industrial Rwd |
|||||||||||
|
Sawlogs |
111,032 |
182,992 |
119,349 |
114,784 |
105,177 |
118,765 |
93,122 |
96,213 |
104,668 |
202,703 |
179,228 |
|
Hewn squares |
4,703 |
16,120 |
6,380 |
597 |
877 |
1,734 |
4,112 |
4,014 |
3,213 |
9,345 |
1,687 |
|
Subtotal |
115,735 |
199,112 |
125,729 |
115,381 |
106,054 |
120,499 |
97,234 |
100,227 |
107,881 |
212,048 |
180,915 |
|
Minor Products |
|||||||||||
|
Fence posts |
2,125 |
3,581 |
1,277 |
468 |
452 |
1,291 |
821 |
362 |
880 |
803 |
655 |
|
Firewood |
581 |
2,107 |
605 |
424 |
388 |
423 |
119 |
132 |
20 |
35 |
218 |
|
Sleepers |
30 |
14 |
|||||||||
|
Shingles |
14 |
7 |
73 |
19 |
11 |
8 |
4 |
2 |
|||
|
Charcoal |
70 |
104 |
|||||||||
|
Others |
124 |
771 |
1,006 |
||||||||
|
Subtotal |
2,844 |
5,765 |
1,955 |
941 |
944 |
1,725 |
962 |
498 |
902 |
1,609 |
1,879 |
|
Total |
118,579 |
204,877 |
127,684 |
116,322 |
106,998 |
122,224 |
98,196 |
100,725 |
108,783 |
213,657 |
182,799 |
Source: LBB
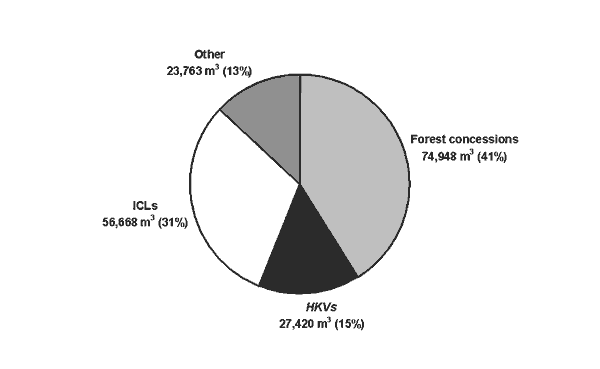
Figure 3 The approximate source of roundwood production in Suriname in 1997
Source: LBB
The estimated source of all this roundwood production is shown in Figure 3. Forest concessions account for the majority of roundwood production followed by ICLs and HKVs. Most forest concessions have expired, however, so the production from these areas is, technically, illegal under the 1992 Forest Management Act.
Total production of forest products in Suriname is currently unknown. The only information available is for sawnwood production, which could be around 70,000 m3/year (see Table 41 above), but this estimate is probably too high.
Just over 42,000 m3 of forest products were exported from Suriname in 1997 (see Table 39 above). Two-thirds of this volume was accounted for by roundwood exports. Other products exported in significant volumes were: sawnwood (15% of the total); plywood (11%); and hewn squares (5%). The total value of exports was Sf 2,662 million (equal to about US$ 4 million at current exchange rates). Roundwood accounted for just under 40% of the value of exports, followed by: plywood (30%); sawnwood (25%); and hewn squares (5%).
Table 43 shows estimated exports of forest products over the last seven years, converted into the amount of roundwood required to produce these exports (m3 EQ). As the table shows, around 40% of recorded roundwood production is exported in the form of roundwood and forest products. In addition to this, it is suspected that there are some illegal exports of roundwood and forest products to Guyana and French Guyana that are not recorded.
Table 43 Roundwood equivalent of exports of wood and wood products from Suriname 1991 - 1997
|
Product |
Assumed product |
Derived roundwood volume by year (m3 EQ) |
||||||
|
recovery rate (%) |
1991 |
1992 |
1993 |
1994 |
1995 |
1996 |
1997 |
|
|
Sawlogs |
100 |
|
1,741 |
1,216 |
6,898 |
12,693 |
24,005 |
28,670 |
|
Hewn squares |
75 |
|
2,560 |
2,213 |
1,427 |
1,661 |
2,291 |
2,675 |
|
Sawnwood |
33 |
891 |
1,524 |
2,682 |
4,422 |
9,393 |
4,650 |
19,470 |
|
Plywood |
30 |
3,493 |
5,973 |
7,720 |
12,802 |
12,793 |
n.a. |
16,077 |
|
Others |
25 |
40 |
532 |
100 |
331 |
572 |
652 |
264 |
|
Total |
|
|
|
|
|
33,594 |
|
|
|
Exports as a percentage of production |
3% |
12% |
15% |
27% |
36% |
>16% |
38% |
|
Source: Author's own estimates based on LBB data
The source of exports in 1997 is shown in Table 44 and Table 45. In terms of the volume of exports, forest concessions accounted for 86% of roundwood exports and around 61% of total exports. In contrast, sawmills (with forest concessions) exported very little roundwood, but accounted for around three-quarters of sawnwood exports. Also, sawmills accounted for only a quarter of total exports by volume. Traders accounted for just over a quarter of sawnwood exports, 12% of roundwood exports and 14% of total exports.
Table 44 Volume of roundwood and wood products exported from Suriname in 1997 by product and industry sector
|
Product |
Forest concessions |
Sawmills with forest concessions |
Traders |
Total |
|||||||
|
(in m3) |
(%) |
(in m3) |
(%) |
(in m3) |
(%) |
(in m3) |
|||||
|
Roundwood |
24,752 |
86 |
390 |
1 |
3,528 |
12 |
28,670 |
||||
|
Hewn squares |
999 |
50 |
441 |
22 |
566 |
28 |
2,006 |
||||
|
Flooring |
0 |
0 |
<1 |
100 |
0 |
0 |
<1 |
||||
|
Mouldings |
0 |
0 |
18 |
100 |
0 |
0 |
18 |
||||
|
Sawnwood |
0 |
0 |
4,829 |
74 |
1,661 |
26 |
6,490 |
||||
|
Furniture |
0 |
0 |
25 |
100 |
0 |
0 |
25 |
||||
|
Plywood |
0 |
0 |
4,823 |
100 |
0 |
0 |
4,823 |
||||
|
Letterhout (snakewood) |
9 |
40 |
6 |
26 |
8 |
34 |
23 |
||||
Source: LBB
In terms of the value of trade, the relative shares of trade held by each of these sectors of the industry are roughly the same within each product category. However, due to the higher value of processed products, the sawmilling sector accounted for a greater share of total exports by value (52%). Forest concessions accounted for 37% of the value of total exports and traders accounted for the remaining 11%.
Table 45 Value of roundwood and wood products exported from Suriname in 1997 by product and industry sector
|
Product |
Forest concessions |
Sawmills with forest concessions |
Traders |
Total |
|||||||
|
(in million Sf) |
(%) |
(in million Sf) |
(%) |
(in million Sf) |
(%) |
(in million Sf) |
|||||
|
Roundwood |
889 |
87 |
13 |
1 |
116 |
11 |
1,018 |
||||
|
Hewn squares |
71 |
50 |
31 |
22 |
40 |
28 |
142 |
||||
|
Flooring |
0 |
0 |
<1 |
100 |
0 |
0 |
<1 |
||||
|
Mouldings |
0 |
0 |
4 |
100 |
0 |
0 |
4 |
||||
|
Sawnwood |
0 |
0 |
553 |
81 |
127 |
19 |
680 |
||||
|
Furniture |
0 |
0 |
16 |
100 |
0 |
0 |
16 |
||||
|
Plywood |
0 |
0 |
776 |
100 |
0 |
0 |
776 |
||||
|
Letterhout (snakewood) |
11 |
46 |
6 |
26 |
7 |
29 |
24 |
||||
|
Total |
37 |
1,400 |
52 |
11 |
2,661 |
||||||
Source: LBB
Table 46 and Table 47 show the destination of exports in 1997. Asia was the main market for roundwood exports (around 20,000 m3 of roundwood went to Thailand and most of the rest of the roundwood destined for Asia went to People's Republic of China). All hewn squares exports went to Europe (Spain) and all plywood exports went to the Caribbean. Sawnwood was exported mostly to European countries, the Caribbean and, to a lesser extent, North and Central America. In terms of value, the Caribbean is the largest export market, accounting for about 40% of the value of exports. Asia accounts for 33% and Europe accounts for 20%.
Table 46 Volume of roundwood and wood products exported from Suriname in 1997 by product and destination
|
Product |
Caribbean |
Europe |
South America |
North & Central America |
Asia |
||||||||||
|
(in m3) |
(%) |
(in m3) |
(%) |
(in m3) |
(%) |
(in m3) |
(%) |
(in m3) |
(%) |
||||||
|
Roundwood |
637 |
2 |
2,285 |
8 |
0 |
0 |
996 |
3 |
24,751 |
86 |
|||||
|
Hewn squares |
0 |
0 |
2,006 |
100 |
0 |
0 |
0 |
0 |
0 |
0 |
|||||
|
Flooring |
<1 |
100 |
0 |
0 |
0 |
0 |
0 |
0 |
0 |
0 |
|||||
|
Mouldings |
18 |
100 |
0 |
0 |
0 |
0 |
0 |
0 |
0 |
0 |
|||||
|
Sawnwood |
2,466 |
37 |
3,236 |
48 |
13 |
0 |
978 |
15 |
30 |
0 |
|||||
|
Furniture |
25 |
100 |
0 |
0 |
0 |
0 |
0 |
0 |
0 |
0 |
|||||
|
Plywood |
4,344 |
90 |
0 |
0 |
479 |
10 |
0 |
0 |
0 |
0 |
|||||
|
Letterhout (snakewood) |
0 |
0 |
20 |
93 |
0 |
0 |
1 |
6 |
<1 |
1 |
|||||
|
Total |
7,491 |
18 |
7,548 |
18 |
493 |
1 |
1,975 |
5 |
24,781 |
59 |
|||||
Source: LBB
Table 47 Value of roundwood and wood products exported from Suriname in 1997 by product and destination
|
Product |
Caribbean |
Europe |
South America |
North & Central America |
Asia |
||||||||||
|
(in mill Sf) |
(%) |
(in mill Sf) |
(%) |
(in mill Sf) |
(%) |
(in mill Sf) |
(%) |
(in mill Sf) |
(%) |
||||||
|
Roundwood |
22 |
2 |
75 |
7 |
0 |
0 |
33 |
3 |
889 |
87 |
|||||
|
Hewn squares |
0 |
0 |
143 |
100 |
0 |
0 |
0 |
0 |
0 |
0 |
|||||
|
Flooring |
<1 |
100 |
0 |
0 |
0 |
0 |
0 |
0 |
0 |
0 |
|||||
|
Mouldings |
4 |
100 |
0 |
0 |
0 |
0 |
0 |
0 |
0 |
0 |
|||||
|
Sawnwood |
328 |
47 |
298 |
42 |
4 |
1 |
71 |
10 |
2 |
0 |
|||||
|
Furniture |
16 |
100 |
0 |
0 |
0 |
0 |
0 |
0 |
0 |
0 |
|||||
|
Plywood |
692 |
89 |
0 |
0 |
84 |
11 |
0 |
0 |
0 |
0 |
|||||
|
Letterhout (snakewood) |
0 |
0 |
23 |
91 |
0 |
0 |
2 |
8 |
<1 |
1 |
|||||
|
Total |
1,062 |
40 |
538 |
20 |
88 |
3 |
106 |
4 |
891 |
33 |
|||||
Source: LBB
In summary, official roundwood production statistics for Suriname indicate that roundwood production might currently be around 180,000 m3. The survey of sawmillers estimates that their annual roundwood intake may be around 160,000 m3 - 180,000 m3. Added to this, exports of roundwood and hewn squares are a further 30,000 m3 EQ and the amount of roundwood needed to produce the volume of plywood exported from Suriname comes to a further 15,000 m3 EQ. In total therefore, it would appear that log production might easily be up to 225,000 m3 EQ or 25% higher than officially estimated. However, much depends upon the current rates of capacity util isation and product recovery in Surinam's sawmills, the extent of unrecorded trade with neighbouring countries and the unrecorded production of small operators such as "Stihl mills".
Exports account for 40% of the volume of officially recorded roundwood production (probably somewhat less if unrecorded production is taken into account). In terms of value, exports probably account for more than 40% of the value of roundwood and forest products produced in Suriname.
The location of roundwood production and transportation distances in Suriname
The location of forest concessions in Suriname is important for the calculation of economic rent (and, consequently, forest levies), because this affects the cost of transporting roundwood from the forest to the sawmill (most of which are located in or around Paramaribo or on the coast).
The majority of working forest concessions are in the forest belt, a strip of forest that runs from 50km to 120km inland from the coast, from East to West across the country. A number of older concessions can be found to the North of the forest belt (i.e. closer to the coast), but many of these have been heavily exploited and activity in these concessions is quite limited. Concessions are also now starting to appear to the south of the forest belt (i.e. further inland).
Precise information about the location of production will only become available when the database of forest concessions is completed and fully operational. However, as a working assumption, it would seem reasonable to assume that 60% of production comes from the forest belt, 20% comes from further into the interior of the country and 20% comes from forests closer to the coast.
Production of roundwood from plantations
In addition to the natural forest, Suriname has a small area of industrial forest plantations, which were established over the period 1953 - 1977 (see Figure 4). There is also an unknown area of plantations, which have been established on former opencast bauxite mining sites (the area and potential productivity of these sites is believed to be low). The majority of the industrial forest plantation area is stocked with Caribbean pine (Pinus Caribaea), mostly planted in the early 1970's. Other species have been planted in pure plantations, mixtures and strips within and around the pine plantations. Information about establishment activities, silviculture and potential yields are presented in Box 5 and estimates of the total current area of these plantations are given in Table 48.
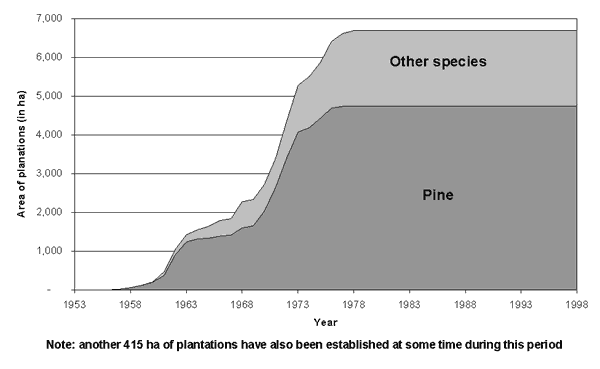
Figure 4 The establishment of plantations in Suriname over the period 1953 - 1998
Source: Bosmij
Box 5 Experience with establishing and managing forest plantations in Suriname
|
From 1950 to 1980, small areas of plantations were established in Suriname on an experimental basis. These have produced mixed results and currently supply a small sawmill and treatment plant operated by the parastatal company Bosmij. Experiences gained with these plantations are summarised below. Species selection and performance - by far the greatest proportion of the plantation area has been planted with Pinus caribaea. The estimated yield of this species in Suriname is 10 m3/ha/year to 15 m3/ha/year. Four provenences have been planted: Hondurensis (c. 90%); Bahamensis (c. 9%); Elioti and Aokarpa (c. 1%). The Bahamensis has been noted to have the best disease resistance, but generally poor form. Other broadleaved species have been planted in blocks and in strips with the pine, including: Baboen (Virola) and Okume. The Okume proved to be susceptible to canker and the Baboen has not grown particularly well. Only the pine is currently harvested. Establishment - Operations to establish the plantations included: brush-cutting (4 hours/ha); collecting the waste into strips (7 hours/ha); burning the waste; ploughing (4 hours/ha); and planting (16 person-hours/ha). D7 bulldozers were used for all of these operations except planting. For planting, an agricultural tractor with a disc attachment was used to make holes for each tree at the correct spacing and workers followed the tractor and planted the trees. Material for burning was collected in rows 7 m wide, approximately 50 m apart. (The trees planted on the burnt strips have grown considerably faster than the rest of the crops). Agricultural tractors were used to weed the crops one year after planting (4 hours/ha). Silviculture - Most of the pine has been planted at 2.5 m x 3.0 m spacing or 1,300 sph (the other crops have been planted at a variety of different spacings). The crop is selectively thinned down to 700 sph at age 7, then 500 sph at age 9 and 350 sph at age 11. The remaining trees are left to grow on a 25-30 year rotation. The trees aren't pruned, because this is considered uneconomical. Harvesting - some of the crops are now mature but, due to a lack of capital, Bosmij is still only working its way through the thinnings. Felling costs are about Sf 7,000/m3 - Sf 8,000/m3 and transport to the mill is Sf 6,000/m3 - Sf 7,000/m3. (These costs are roughly the same as the cost of these operations in the natural forest). In addition to the productive plantations, Suralco (Suriname's bauxite mining company) has also been planting pine on former open-cast mining areas. The total area of this is unknown. These sites are extremely nutrient deficient and, although many of the trees have grown in height, they have not grown in volume. |
Source: Bosmij
Table 48 Area, location and species distribution of industrial forest plantations in Suriname
|
Region/district |
Productive area |
Unproductive |
Total |
|||||
|
Pine |
Other species in plantations |
Other species in strips |
area |
area |
||||
|
Coesewijne |
1,020 |
29 |
414 |
3,629 |
5,092 |
|||
|
Singrilanti |
93 |
0 |
0 |
132 |
225 |
|||
|
Blakawatra |
3,333 |
0 |
0 |
819 |
4,152 |
|||
|
Esterslust/Berendslust |
0 |
0 |
336 |
0 |
336 |
|||
|
Powakka |
134 |
0 |
0 |
0 |
134 |
|||
|
Kamp 8 |
161 |
151 |
1,029 |
1,681 |
3,023 |
|||
|
Perica |
0 |
415 |
0 |
0 |
415 |
|||
|
Total |
4,742 |
595 |
1,779 |
6,261 |
13,377 |
|||
Source: Bosmij
The potential production of roundwood from these plantations is quite uncertain. Box 5 above indicated the current thinning regime followed in Suriname and gave an estimated annual yield per ha of the pine plantations (which are the only plantations harvested at the moment). It also noted that some areas are now ready for harvesting, but that Bosmij has not got the capacity to keep-up with its production schedule. However, to give a rough indication of total potential yield, the production forecast shown in Figure 5 has been prepared.
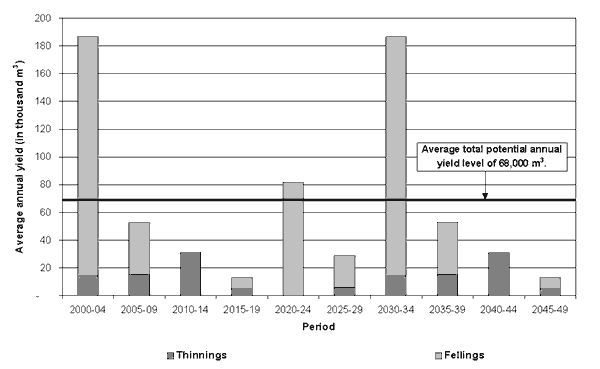
Figure 5 Estimated potential annual yield of pine plantations in Suriname 2000 -2050
Source: Author's own estimate
As the figure shows, with a rotation of 30 years and assuming a maximum mean annual increment of 15 m3/ha/year, a considerable amount of pine roundwood will shortly be available for processing. The near-term peak in potential production is due to the escalation of pine planting which took place in the early 1970's (see Figure 4). However, even if production was to be smoothed-out in the future, potential yield could be as high as 68,000 m3/year. If yields are only 10 m3/ha/year, then production might only be two-thirds of this, or 46,000 m3/year, but this still a significant amount of roundwood that could be processed.
Qualitative information on the forest economy of Suriname
In addition to the quantitative information presented above, the discussions with key stakeholders in the forest sector also provided some qualitative information about the current state of the sector. Nearly every person visited raised two issues: access to capital and the current exchange rate policy. Other issues raised were: the lack of a current investment law for foreign investors; restrictive practices in the sector; and favouritism in the government. These issues are briefly described below.
Exchange rate policy
Everybody visited criticised the current exchange rate policy as being very harmful to the promotion of forest product exports from Suriname. Most of the sawmillers said that they had exported in the past but would not currently export sawnwood because they would probably lose money on the transaction. The requirement to give all US$ received from an export sale to the Central Bank, also appears to have favoured certain sectors of the industry. In particular, it is easier for foreign-controlled companies and domestic companies with foreign partners to report the value of exports as the minimum set by LBB in order to keep as much as possible of their export revenues offshore. Although the under-reporting of export values is technically illegal, it is suspected that some of the largest exporters in the sector are benefiting from such transfer-pricing techniques.
Access to capital
Access to capital was the next most important issue raised by many observers. Most of the forestry and forest processing machinery seen in Suriname is very old and the quality of this machinery has, in part, contributed to the difficulty of developing export markets for Surinam's forest products. Foreign exchange (e.g. US$) could be borrowed from offshore banks at reasonable interest rates, but this would then have to be repaid in foreign currency. As noted above, the current exchange rate policy makes this very unattractive. The alternative to this is to borrow local currency from domestic banks, but domestic interest rates are very high (although not, perhaps, so high in real terms) which also makes this somewhat unattractive. However, several people visited said that the situation was even worse than this and that, no matter what the interest rate was, domestic banks just simply will not lend to forestry companies.
The main consequence of this difficulty to obtain capital is that investment in the sector is limited to the current level of profits. Currently low levels of return in the sector have therefore, limited investment and resulted in the gradual decline in efficiency and competitiveness of the sector. Irrespectively of the level of profit however, such an approach also means that new equipment can only be purchased in small amounts every year and can not be purchased all at one time. This may have contributed to the poor organisation and layout seen at several of the sawmills visited. As above, this problem may have also favoured foreign-controlled companies and domestic companies with foreign partners, who probably have better access to investment funds from overseas.
Investment law
In addition to new capital, many sawmillers also said that they would like to gain access to foreign markets and new technology and that joint ventures with foreign companies was the best way forward for the development of the sector. In relation to this, the current standstill over the development of a new investment law for Suriname (to protect foreign investors, amongst other things) was also sighted by some respondents as a serious impediment to developing joint ventures. Indeed, without a certain amount of legal protection, most foreign investors will be reluctant to enter the sector as joint partners and the only foreign investment that is likely to materialise will be in the form of complete ownership of local companies (e.g. the current investments of MUSA, Tacoba and Berjaya). As above, this will again affect different companies in different ways and will therefore, result in a change in the relative strength of different stakeholders within the sector.
Restrictive practices
Several people interviewed claimed that there were various restrictive practices currently operating in the sector. For example, one of the difficulties of trying to develop export markets for Surinam's forest products is to collect a large enough shipment of a product of the same species and quality. It was noted that most operators do not have enough raw material resources from their own sources to put together a sizeable load of, say, 1st grade Kopie sawnwood and that they would have to purchase additional supplies of such material from other producers. However, it was claimed that, in such a situation, other suppliers would quickly realise what was happening and would make this material so expensive, that it would be uneconomic to attempt such a task. The small size of most operations and lack of competition (or alternatively, co-operation to develop export markets) is therefore, another hindrance to export development.
Other parts of the production process where collusion and a lack of competition were sighted included: the purchase of roundwood from independent loggers and small forest concessionaires; contract extraction, loading and transportation; and the purchase of export quality products by traders. As long as restrictive practices persist, it will be difficult to develop export markets and promote efficiency within the sector.
Favouritism
A few sawmillers claimed that favouritism in the awarding of forest concessions, granting of other licenses and distribution of foreign exchange, was also harming the sector. While it is always difficult to judge whether such claims are genuine grievances or merely general dissatisfaction with the current government, it would appear that certain sectors have benefited more than others have from current government policies. For example, traders seem to be the only sector able to obtain foreign currency at the official exchange rate and certain large companies seem to have benefited more than others in the awarding of new forest concessions and ICLs. Also, many loggers, sawmillers and local communities raised the point several times that they were unhappy about the way foreign-con trolled companies in the sector were being allowed to operate.
