

TOTAL FOREST REVENUE COLLECTION
Table 2 below shows the trends in total forest revenue collection in selected African countries up until 1999. The figures are presented here as average annual increases in revenue collection although, in many countries, revenue collection has increased suddenly over the period in one or two years (e.g. Guinea in 1998).
Table 2 Trends in total forest revenue collection in selected African countries
|
Country and time period |
Average annual increase in total forest revenue collection |
|||
|
In local currency |
In US$ at current prices and exchange rates |
|||
|
at current prices |
at real prices |
|||
|
Burkina Faso |
1993-99 |
+38% |
+26% |
+21% |
|
Burundi |
1993-99 |
+28% |
+12% |
+11% |
|
Central African Republic |
1996-00 |
+43% |
+35% |
+35% |
|
Chad |
1994-00 |
+29% |
+19% |
+26% |
|
DR Congo |
1996-00 |
0% |
n.a. |
0% |
|
Côte d'Ivoire |
1990-99 |
+7% |
-2% |
-2% |
|
Ethiopia |
1991-99 |
+11% |
+3% |
-6% |
|
Gambia |
1995-00 |
+26% |
+21% |
+18% |
|
Ghana |
1990-99 |
+37% |
+8% |
+9% |
|
Guinea |
1994-00 |
+177% |
+164% |
+135% |
|
Kenya |
1993-99 |
-8% |
-20% |
-11% |
|
Madagascar |
1997-00 |
+29% |
+6% |
+17% |
|
Malawi |
1990-99 |
+21% |
-8% |
-11% |
|
Mali |
1990-99 |
-5% |
-12% |
-13% |
|
Mauritius |
1996-99 |
+7% |
-2% |
-5% |
|
Namibia |
1993-99 |
-13% |
-22% |
-21% |
|
Niger |
1992-99 |
+11% |
+3% |
-1% |
|
Nigeria |
1991-99 |
+11% |
-22% |
-16% |
|
Senegal |
1990-99 |
0% |
-6% |
-9% |
|
Uganda |
1995-99 |
+57% |
+39% |
+42% |
|
United Republic of Tanzania |
1990-99 |
+42% |
+4% |
+29% |
|
Zimbabwe |
1995-00 |
+33% |
+3% |
-12% |
Source: country reports. Note: the figures for Ethiopia are an underestimate because the most recent figures on total revenue collection in Ethiopia only include some states, while the earlier figures are for the country as a whole. It is believed that the trend in total revenue collection is higher than the figures presented here suggest.
Despite the fact that, in most countries, the levels of forest charges have not increased by much over the last ten years, this table shows that total forest revenue collection has increased in nearly all countries. It is not known how much of this is due to increased levels of charges, increased levels of production, or improvements in charge collection, but it is likely that all three factors have contributed to these trends to some extent.
As the table shows, before adjusting for inflation, total forest revenue collection has fallen in only two countries (Kenya and Namibia). Even after adjusting for inflation (i.e. in real terms), total forest revenue collection has only fallen in eight countries over the period. The last column in the table shows that the US$ value of total forest revenue collection has fallen in 11 countries (largely due to the devaluation of many African currencies). However, this is not particularly significant except in countries where large volumes of forest products are exported to countries outside of Africa.
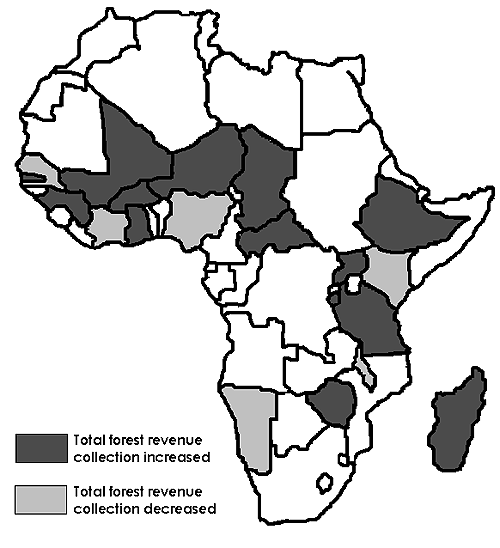
Figure 13 shows the countries where total forest revenue collection has increased or decreased (in real terms) in recent years. It may be possible to explain the differences between countries in terms of their forest resources and market structures, but it seems likely that a number of other factors may account for these differences.
Figure 13 Recent trends in total real forest revenue
collection in countries

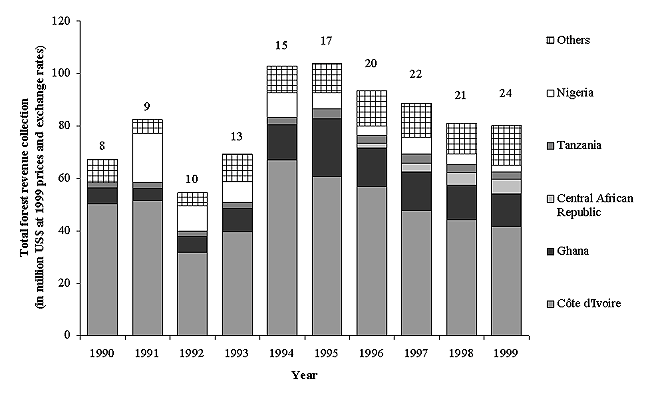
The trend in total real forest revenue collection for all of the countries included in this analysis is given in Figure 14. In order to calculate these totals, the total amount of forest revenue collected in each country has been adjusted for inflation (i.e. converted to 1999 price levels) and converted to US$ at 1999 exchange rates. The numbers given at the top of each bar in this figure represent the number of countries included in the total in each year. Many countries did not provide statistics on total revenue collection for the whole of the period, but the total amount of forest revenue collected in most of these countries is relatively small, so they have not distorted the trend very much.
Figure 14 The trend in total real forest revenue collection in selected African countries

This figure shows several interesting features:
The majority of forest revenue collected in Africa is collected in a few countries. Nearly 75% of the total given here is collected in Côte d’Ivoire, Ghana and Central African Republic. These countries are all in West and Central Africa and have relatively large forest product export industries. Nigeria, Liberia, Senegal and DR Congo also account for a significant share of the total and it seems likely that other similar countries not included in this analysis (e.g. Cameroon and Gabon) would have similarly high levels of total forest revenue collection.
With the exception of Ethiopia, Kenya and Tanzania, all of the other countries analysed here in Eastern and Southern Africa collect less than US$ 1 million each year in forest revenue. Indeed, in many countries, total forest revenue collection is only a few hundred thousand US dollars and, in a number of cases, it can be measured in the tens of thousands of US dollars. Similarly low levels of total forest revenue collection are also recorded in most of the Sahelian countries.
For the countries examined here, the trend in total real forest revenue collection shows an increase from under US$ 70 million in 1990 to a peak of over US$ 100 million in 1995. Since 1995, this has fallen to around US$ 80 million. However, much of this trend reflects changes in forest revenue collection in Côte d’Ivoire. Excluding this country, total real forest revenue collection in the other countries has increased from US$ 17 Million to just under US$ 40 million per year. This increase reflects the average annual increases in total forest revenue collection already described above in Table 2.
One final way to examine these figures is to calculate the average amount of forest revenue collected per cubic metre of roundwood produced. There are difficulties with this calculation, particularly with respect to the amount of woodfuel produced each year, which is often unrecorded or estimated in official statistics. However, an estimate of revenue collection per country should take into account the different levels of production in different countries. This should make it easier to make more reliable comparisons of revenue collection between countries with similar market structures.
Total forest revenue collection per cubic metre of wood produced is shown in Table 3. The figures in this table have been produced by taking the figures for total forest revenue collection supplied by countries and dividing them by total roundwood production (and industrial roundwood production) as recorded in the FAO Yearbook of Forest Products. The last two columns show the total revenue collected in US$ per cubic metre at 1999 prices and exchange rates. The first of these shows total revenue collection per cubic metre of total roundwood produced and the last column shows total revenue collection per cubic metre of industrial roundwood produced.
A high proportion of total roundwood production is woodfuel production and, in most cases, these figures are estimated by FAO. In addition, revenue collection from woodfuel production in most countries only accounts for a small proportion of total revenue collection. Therefore, the figures in the last column might give a better indication of the relative levels of charges in different countries. However, on the other hand, woodfuel production is a significant use of forest resources in all countries, so the figures in the previous column give a better indication of the average levels of revenue collection measured in terms of the use of the forest resource.
Table 3 Total forest revenue collection in selected African countries in 1999
|
Country |
Estimated production in 1999 (m3) |
Average charge collection (US$/m3) |
||||
|
Total roundwood |
Industrial roundwood |
Total roundwood |
Industrial roundwood |
|||
|
Burkina Faso |
11,095,000 |
514,000 |
5% |
0.07 |
1.52 |
|
|
Burundi |
1,799,000 |
289,000 |
16% |
0.03 |
0.17 |
|
|
Central African Republic |
3,548,000 |
861,000 |
24% |
1.57 |
6.46 |
|
|
Chad |
1,969,000 |
761,000 |
39% |
0.03 |
0.08 |
|
|
DR Congo |
50,754,000 |
3,727,000 |
7% |
0.02 |
0.22 |
|
|
Côte d'Ivoire |
13,396,000 |
3,093,000 |
23% |
3.10 |
13.44 |
|
|
Ethiopia |
88,239,468 |
2,454,300 |
3% |
0.03 |
0.93 |
|
|
Gambia |
617,700 |
112,700 |
18% |
0.36 |
2.00 |
|
|
Ghana |
21,907,000 |
1,229,000 |
6% |
0.57 |
10.22 |
|
|
Guinea |
8,651,000 |
651,000 |
8% |
0.10 |
1.39 |
|
|
Kenya |
29,908,000 |
1,977,000 |
7% |
0.06 |
0.93 |
|
|
Lesotho |
1,594,000 |
0 |
0% |
0.03 |
n.a. |
|
|
Liberia |
3,037,000 |
337,000 |
11% |
1.02 |
9.20 |
|
|
Madagascar |
10,359,000 |
115,000 |
1% |
0.26 |
23.78 |
|
|
Malawi |
9,964,000 |
520,000 |
5% |
0.01 |
0.21 |
|
|
Mali |
6,596,900 |
412,900 |
6% |
0.05 |
0.78 |
|
|
Mauritius |
25,000 |
13,000 |
52% |
30.81 |
59.24 |
|
|
Niger |
6,666,000 |
411,000 |
6% |
0.05 |
0.85 |
|
|
Nigeria |
100,637,000 |
9,418,000 |
9% |
0.03 |
0.27 |
|
|
Senegal |
5,037,000 |
794,000 |
16% |
0.31 |
1.99 |
|
|
Uganda |
16,998,000 |
3,175,000 |
19% |
0.04 |
0.24 |
|
|
United Republic of Tanzania |
39,846,000 |
2,254,000 |
6% |
0.07 |
1.23 |
|
|
Zimbabwe |
9,252,600 |
1,081,400 |
12% |
0.10 |
0.84 |
|
|
Total |
441,896,668 |
34,200,300 |
8% |
0.19 |
2.42 |
|
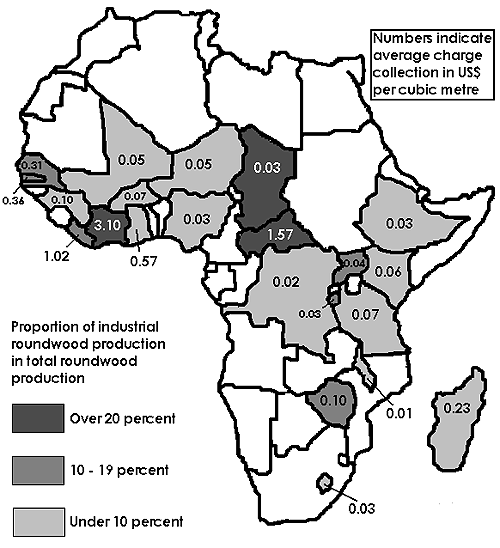
Figure 15 Average revenue collection per cubic metre
in 1999

For the countries included in this analysis, the above table shows that the average level of revenue collected per cubic metre of roundwood produced is only US$ 0.19/m3. However, this figure is somewhat distorted by Côte d’Ivoire, which accounts for almost half of all revenue collection in these countries. Excluding this country, revenue collection is only about US$ 0.10/m3. In terms of industrial roundwood production, the average level of revenue collection is US$ 2.42/m3 (or just under half this amount if Côte d’Ivoire is excluded).
The average level of revenue collected per cubic metre of total roundwood produced in each country is also shown in Figure 15. The countries shown in darker shades of grey are countries where industrial roundwood accounts for a greater share of total roundwood production. As would be expected, these countries generally have higher levels of revenue collection per cubic metre of production.
This figure also shows that West African countries have generally higher levels of revenue collection than elsewhere and that collection is generally lower in countries without a coastline.