

GOVERNMENT EXPENDITURE ON FORESTRY: TRENDS AND CURRENT STATUS
Table 4 below shows the trends in total government expenditure on forestry in selected African countries up until 1999. These figures include expenditure supported by foreign assistance. Again, the figures are presented here as average annual increases.
Compared with the information about total revenue collection, fewer countries were able to provide a complete set of historical statistics on expenditure from all sources. In addition, many countries could only provide this information for a more limited number of years. Therefore, only a limited number of countries are presented here and the trends shown are for shorter time periods in most cases.
It is interesting to note that, in many cases, countries could provide historical information about foreign assistance to the sector, but were unable to provide much information about expenditure from domestic resources.
Table 4 Trends in government expenditure on forestry in selected African countries
|
Country and time period |
Average annual increase in expenditure on forestry |
|||
|
In local currency |
In US$ at current prices and exchange rates |
|||
|
at current prices |
at real prices |
|||
|
Burkina Faso |
1996-99 |
-6% |
-11% |
-12% |
|
Burundi |
1990-00 |
+4% |
-5% |
-6% |
|
Central African Republic |
1996-00 |
+8% |
-11% |
-10% |
|
Chad |
1991-00 |
+10% |
+1% |
0% |
|
Côte d'Ivoire |
1990-99 |
+5% |
-4% |
-4% |
|
Ethiopia |
1997-99 |
+3% |
-5% |
-4% |
|
Gambia |
1995-00 |
+1% |
-3% |
-5% |
|
Ghana |
1990-99 |
+37% |
+8% |
+8% |
|
Kenya |
1995-00 |
-7% |
-18% |
-15% |
|
Malawi |
1990-99 |
+26% |
-4% |
-7% |
|
Mali |
1992-99 |
+16% |
+6% |
+3% |
|
Mauritius |
1996-00 |
+6% |
-3% |
-4% |
|
Niger |
1991-99 |
+8% |
+1% |
-2% |
|
Nigeria |
1993-99 |
+16% |
-18% |
-9% |
|
Senegal |
1990-99 |
+6% |
0% |
-3% |
|
Zimbabwe |
1996-00 |
+59% |
+25% |
-2% |
Source: country reports. Note: the figures for Ethiopia are an underestimate because the most recent figures on expenditure in Ethiopia only include some states. The trend in total revenue collection may be higher than the figures presented here. The figures for Central African Republic, Ghana and Malawi exclude expenditure by foreign donors. The figures for Nigeria include estimates of spending on forestry by state forest administrations, based on the country report plus information about state budgets in Nigeria (from the IMF).
This table shows that total government expenditure on forestry has increased in nearly all countries in recent years. Indeed, before adjusting for inflation, total expenditure has fallen in only two countries: Burkina Faso and Kenya. However, in most cases, expenditure has not increased by very much and has failed to keep up with inflation. After adjusting for inflation (i.e. in real terms), total expenditure has increased in only five countries in recent years.
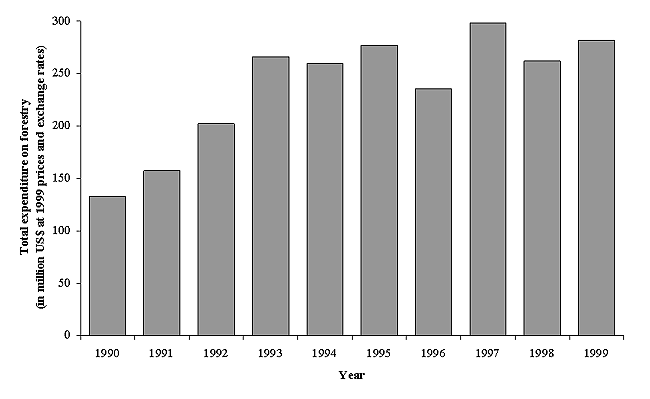
The trend in total government expenditure on forestry for all of the countries included in this analysis is given in Figure 16. Again, the amounts included in this figure have been adjusted for inflation (i.e. converted to 1999 price levels) and converted to US$ at 1999 exchange rates. However, this figure includes all of the information about expenditure presented by countries, including amounts from the years when only partial information was available. This accounts for the apparent increase from 1990 to 1995. Most countries have presented complete or almost complete information for the last five years and this figure shows that, over this period, expenditure has not increased in real terms.

Figure 16 The trend in total government expenditure on forestry in selected
African countries
In the countries included in this analysis, total expenditure on forestry since 1995 has been around US$ 275 million per year. However, as in the case of revenue collection, a few countries account for a significant share of this total. Total annual expenditure on forestry is highest in Côte d’Ivoire, Tanzania and Ghana (US$ 41 million, US$ 39 million and US$ 31 million respectively in 1999). In addition to these countries, the other countries spending more than US$ 10 million per year on the forestry sector are: Ethiopia; Guinea; Kenya; Madagascar; Mali; Nigeria; and Senegal. However, it should be noted that these figures include foreign assistance to the sector. As will be shown later, in many cases this accounts for a huge proportion of expenditure.
Table 5 Government expenditure per hectare on the forestry sector in Africa
|
Country |
Forest area (000 ha) |
Total government expenditure (US$ 000) |
Government expenditure (US$/ha) |
|
Burkina Faso |
7,089 |
4,530 |
0.64 |
|
Burundi |
94 |
1,391 |
14.76 |
|
Central African Republic |
22,907 |
1,030 |
0.04 |
|
Chad |
12,692 |
4,431 |
0.35 |
|
DR Congo |
135,207 |
1,277 |
0.01 |
|
Côte d'Ivoire |
7,117 |
40,538 |
5.70 |
|
Ethiopia |
4,593 |
25,209 |
5.49 |
|
Gambia |
481 |
686 |
1.43 |
|
Ghana |
6,335 |
31,294 |
4.94 |
|
Guinea |
6,929 |
15,913 |
2.30 |
|
Kenya |
17,096 |
18,461 |
1.08 |
|
Lesotho |
14 |
639 |
45.67 |
|
Liberia |
3,481 |
7,317 |
2.10 |
|
Madagascar |
11,727 |
11,641 |
0.99 |
|
Malawi |
2,562 |
3,992 |
1.56 |
|
Mali |
13,186 |
14,726 |
1.12 |
|
Mauritius |
16 |
5,603 |
350.19 |
|
Namibia |
8,040 |
5,335 |
0.66 |
|
Niger |
1,328 |
7,385 |
5.56 |
|
Nigeria |
13,517 |
20,821 |
1.54 |
|
Senegal |
6,205 |
13,413 |
2.16 |
|
Uganda |
4,190 |
3,668 |
0.88 |
|
United Republic of Tanzania |
38,811 |
39,340 |
1.01 |
|
Zimbabwe |
19,040 |
3,386 |
0.18 |
|
Total |
342,658 |
282,025 |
0.82 |
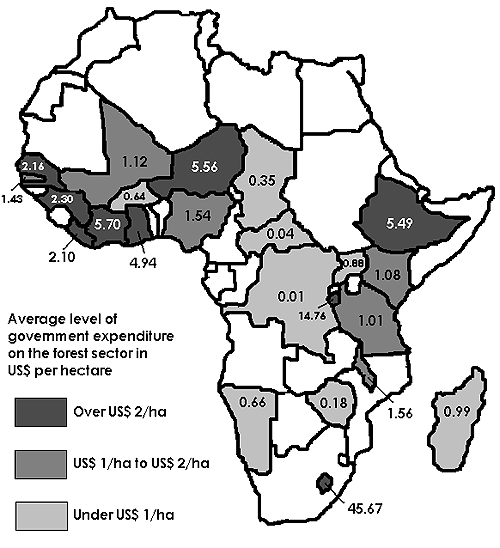
Figure 17 Average government expenditure per hectare
on forestry in 1999

Total expenditure per hectare has been calculated by taking the statistics on expenditure in 1999 and dividing them by the total forest area reported in the Global Forest Resource Assessment 2000. These figures are shown in Table 5 and Figure 17. These figures show the generally low levels of expenditure on forestry in Africa. To a large extent, the variation between countries can be explained by how much foreign assistance has been given (or lent) to different countries. Therefore, these figures do not accurately reflect the priority given to forestry in different countries, but are more a reflection of how well they succeed in attracting donor funding.