![]()
![]()
![]()
by
Doug S. Butterworth
Department of Applied Mathematics
University of Cape Town
Rondebosch 7700
South Africa
Resumen
Se examina la evaluación y ordenación de las pesquerías pelágicas frente a Sudáfrica (SA) y Namibia, con particular referencia a la sardina Sardinops ocellata y anchoveta Engraulis capensis que son los mayores componentes de las capturas.
Ambas pesquerías fueron dominadas inicialmente por la Sardina, cuyos stocks colapsaron después que las capturas alcanzaron un máximo de 400 mil toneladas en SA en 1962, y 1 400 miles de toneladas en Namibia en 1968. Aun cuando el stock de Namibia mostró una recuperación parcial a mediados de los años 1970s, ambos stocks actualmente parecen estar seriamente reducidos, cada uno con una biomasa menor de 100 mil toneladas.
La anchoveta se ha convertido en el mayor componente en ambas pesquerías. En Namibia el stock y los desembarques son altamente variables, y hay considerable inquietud acerca del estado de los stocks de sardina y anchovetas después de los pobres reclutamientos en 1982. En SA el stock de anchoveta parece ser más estable, pero con una participación decreciente de sardina, caballa y jurel en los desembarques anuales, hay indicaciones que el aumento de la presión sobre anchoveta puede conducir a la sobreexplotación.
El principal mecanismo de ordenación de la pesca ha sido el establecimiento de cuotas anuales para cada especie separadamente, o una cuota global para todas las especies combinadas. Las restricciones se formularon intuitivamente hasta inicios de los años 1970s, cuando se hicieron las primeras estimaciones cuantitativas. Para SA, la recomendación inicial de una cuota global de 360 mil toneladas fue basada en el modelo de producción de Shaefer. Análisis subsiguientes indican que una cifra 325 mil toneladas era más adecuada en vista de la desaparición virtual de algunas especies en los desembarques, sin embargo, las autoridades mantuvieron las cuotas en 380 mil toneladas durante los últimos cinco años.
En Namibia, durante la recuperación parcial del stock a inicios de los años 1970s, las cuotas de sardina se ajustaron empíricamente tomando como base principal los resultados de reconocimientos aéreos. La imposibilidad de detectar la pobreza del reclutamiento a tiempo como para poder reducir consecuentemente las cuotas para los períodos subsiguientes, durante los cuales no se hicieron reconocimientos, llevaron a un nuevo colapso del stock. Actualmente la ordenación de la pesca de sardina se basa en proyecciones a partir del Análisis de Población Virtual (VPA), y en la aplicación de restricciones del tamaño de malla de las redes, y de las áreas y temporadas de pesca, además de la instalación de sistemas de agua de mar refrigerada para que, en la medida de lo posible, la sardina que se captura sea utilizada sólo para enlatado y se evita la captura incidental de sardina con anchoveta juvenil.
El rendimiento promedio anual de 200 mil toneladas de anchoveta para Namibia se considera adecuado, esencialmente en base a la performance histórica, pero la cuota es modificada anualmente en base a reconomientos de huevos que se hacen antes de la temporada de pesca, y a indicaciones de la fuerza del reclutamiento en ese año.
Se discuten los métodos de evaluación que se han utilizado o que están siendo empleados para estos stocks, así como los problemas encontrados. Estos métodos son VPA, captura por unidad de esfuerzo, reconocimiento de huevos, reconocimientos aéreos y acústicos, marcación, además del estudio de sedimentos y registros de depósitos de guano, los que dan alguna información sobre la tendencia de los stocks antes que se iniciara la pesquería. Hay algunas indicaciones de un fuerte comportamiento dependiente de la densidad en algunos de los stocks.
No hay respuesta a la pregunta de si las pesquerías de SA y Namibia explotan los mismos stocks o stocks independientes, lo cual tiene importancia para la ordenación, en particular la anchoveta de Namibia.
Ambas pesquerías de anchoveta dependen fuertemente de los reclutamientos de ese año (más del 95% del número de anchovetas capturadas en Namibia en años recientes han sido del grupo edad 0). Lo que más se necesita para fines de ordenación son métodos que puedan determinar a tiempo las fallas del reclutamiento. En principio, los reconocimientos hidroacústicos parecen ofrecer las mejores perspectivas, pero todavía no se ha determinado si la varianza de los estimados será lo suficientemente pequeña como para permitir un impacto efectivo en la ordenación, tanto desde el punto de vista teórico como práctico.
Las principales lecciones de las pesquerías sudáfricanas son:
i) la necesidad de determinar la edad de las especies desembarcadas en forma regular y exacta para una correcta interpretación de las tendencias de los stocks
ii) la necesidad de métodos de reconocimientos de evaluación de los stocks que no sean afectados por los sesgos de las muestras de la pesquería, en particular para poder detectar a timepo las disminuciones de los stocks
iii) las regulaciones deben ser simples y factibles de ser puestas en vigor: aun cuando la fijación de cuotas para cada especie puede ser deseable desde el punto de vista biológico, las violaciones y perjuicios potenciales tales como desperdicio de captura y fallas en la identificación de las especies pueden hacer que una cuota global combinada posiblemente con cierre de algunas áreas sea una medida más realistica y práctica
iv) en el proceso de toma de decisiones para el ordenamiento de la pesca se debe contrapesar la actitud excesivamente optimista de la industria que presiona para mantener o incrementar las cuotas para asegurar ganancias a corto plazo (o, en algunos casos, para sobrevivir) ; la poca representación científica a este nivel en Sudáfrica ha hecho que los científicos jueguen un papel no del todo efectivo de acción de retroguardia en su capacidad de proteccionistas, en lugar de desempeñar el rol que les corresponde como asesores imparciales para lograr la utilización a largo plazo de los recursos pesqueros.
INTRODUCTION
There are numbers of previous reviews of the pelagic fisheries of South Africa (SA) (Cram, 1977; Newman et al., 1979; and Crawford, 1979) and Namibia/South West Africa (SWA/N) (Cram, 1977; Troadec et al., 1980; Cram, 1981). ICSEAF Collections of Scientific Papers for recent years also contain regularly updated assessments of the major stocks.
This paper will not attempt as comprehensive a review of the earlier periods of these fisheries as in the above, but will rather concentrate on more recent initiatives in assessment and management. Further only the pilchard (Sardinops ocellata) and anchovy (Engraulis capensis), the major contributors to these fisheries, will be considered.
Management of South African fisheries is in terms of the Sea Fisheries Act (1973) which empowers the Minister (previously of Economic Affairs, then Agriculture and Fisheries, and now Environment Affairs and Fisheries) to regulate any aspect of the fishing industry. The Minister receives scientific advice from the Sea Fisheries Research Institute of the Department of Environment Affairs and Fisheries, which has statutory responsibility for conducting research into marine fisheries. Separate Fisheries Advisory Councils exist for the two fisheries to make management recommendations to the Minister; these bodies consist mainly of Industry representatives, but include the Director of the Sea Fisheries Research Institute. Since 1978 the Minister's powers for the SWA/N fishery have been transferred to local authorities.
The paper first traces the history of the SA and SWA/N pilchard and anchovy fisheries and the associated management policies. The various stock assessment techniques that have been used are commented upon, together with indications of the present status of the stocks and future research priorities. Economic aspects of the two fisheries are discussed briefly, and a concluding section discusses what the author considers the major lessons to be learnt from the history of these fisheries regarding stock assessment and management.
HISTORY AND MANAGEMENT PRACTICE
South African Fishery
Although pilchards were first canned in SA in 1935, major development of the pelagic fishery commenced only after the war. Fishing is confined mainly to the area between latitude 31°S and longitude 21°E (see Fig. 1), and generally occurs close to the coast (about 20 km). This area is concurrently served by 6 fishing harbours and 10 processing plants.
Annual landings by species are shown in Table 1 and Fig. 2. The early stages of the fishery were dominated by pilchard and horse mackerel (Trachurus trachurus). Pilchard catches rose markedly in the late 1950's, but a decline set in from 1963. To compensate for this decline, small mesh nets (see Table 2) were introduced to allow exploitation of anchovy, with these nets becoming universally used from 1965. From mid 1960's to mid 1970's, though anchovy became the major contributor, chub mackerel (Scomber japonicus) and (on occasions) pilchard made substantial contributions. Over the last four years, anchovy has dominated comprising some 80% of the total landings.
Table 2 lists a number of the restrictions applied by management to the fishery. Limitations on processing capacity to prevent over-investment have been in force since 1950. Various closed seasons have been operative since 1951, primarily over the spring months. Motivation for these has been to avoid fishing during the spawning season (September to March for pilchard; November to March for anchovy (Davies et al., 1981; Crawford, 1981a; b); also the oil yield from the fish which is important economically, is low over this period. The closed seasons also serve to restrict effort.
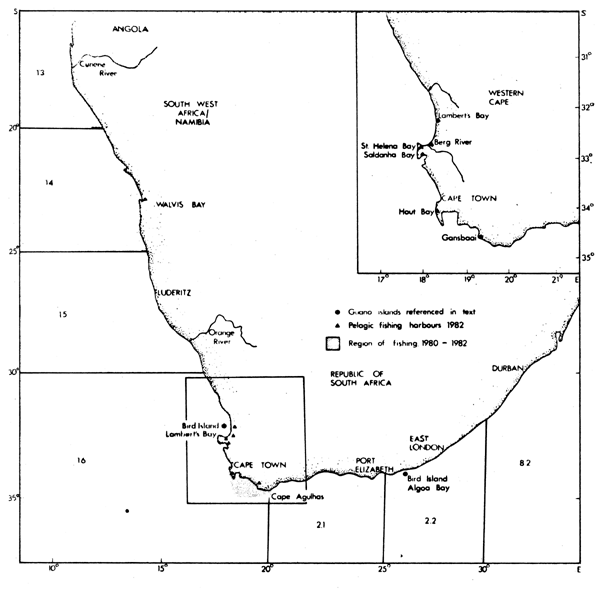
Fig. 1. The southern Benguela Region showing the areas of pelagic fishing, the harbours from which the fishing fleets operate, and two guano islands referenced in the text. Oceanic divisions indicated are according to ICSEAF conventions.
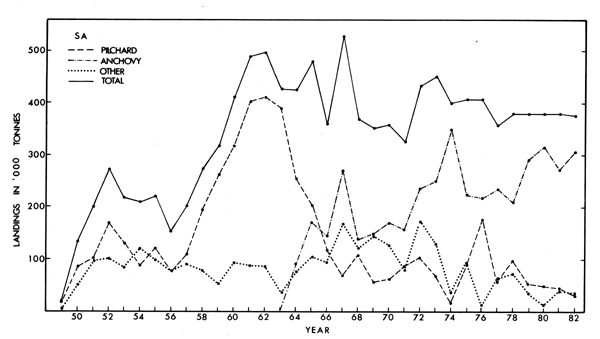
Fig. 2. Total annual landings, and landings per species in the SA pelagic fishery 1949-1982
| Year | Pilchard | Anchovy | Horse mackerel | Chub mackerel | Round herring | Lantern-fish | Total |
|---|---|---|---|---|---|---|---|
| 1949 | 17 | - | 3 | - | - | - | 21 |
| 1950 | 85 | - | 50 | - | - | - | 135 |
| 1951 | 102 | - | 99 | - | - | - | 200 |
| 1952 | 170 | - | 103 | - | - | - | 273 |
| 1953 | 133 | - | 85 | - | - | - | 218 |
| 1954 | 88 | - | 118 | 4 | - | - | 211 |
| 1955 | 122 | - | 79 | 20 | - | - | 221 |
| 1956 | 77 | - | 46 | 33 | - | - | 155 |
| 1957 | 110 | - | 85 | 7 | - | - | 202 |
| 1958 | 194 | 0 | 56 | 22 | 1 | - | 273 |
| 1959 | 260 | 1 | 18 | 33 | 2 | - | 315 |
| 1960 | 318 | - | 63 | 31 | 0 | - | 412 |
| 1961 | 402 | - | 39 | 50 | 0 | - | 491 |
| 1962 | 410 | - | 67 | 20 | 0 | - | 497 |
| 1963 | 390 | 0 | 23 | 13 | 0 | - | 427 |
| 1964 | 256 | 92 | 24 | 50 | 3 | - | 426 |
| 1965 | 205 | 171 | 55 | 41 | 8 | - | 480 |
| 1966 | 118 | 144 | 26 | 53 | 15 | - | 357 |
| 1967 | 70 | 271 | 9 | 128 | 32 | - | 509 |
| 1968 | 108 | 138 | 1 | 91 | 30 | 0 | 369 |
| 1969 | 56 | 149 | 27 | 92 | 23 | 5 | 352 |
| 1970 | 62 | 169 | 8 | 78 | 24 | 18 | 358 |
| 1971 | 88 | 157 | 2 | 54 | 22 | 2 | 325 |
| 1972 | 104 | 236 | 1 | 57 | 21 | 15 | 434 |
| 1973 | 69 | 251 | 2 | 59 | 29 | 42 | 451 |
| 1974 | 16 | 350 | 3 | 31 | 1 | 0 | 401 |
| 1975 | 89 | 224 | 2 | 69 | 24 | 0 | 407 |
| 1976 | 176 | 218 | 0 | 1 | 12 | 0 | 408 |
| 1977 | 58 | 236 | 2 | 21 | 35 | 6 | 357 |
| 1978 | 97 | 210 | 4 | 2 | 67 | 1 | 380 |
| 1979 | 53 | 291 | 4 | 3 | 21 | 9 | 381 |
| 1980 | 50 | 316 | 0 | 0 | 14 | 0 | 381 |
| 1981 | 46 | 292 | 6 | 0 | 24 | 10 | 379 |
| 1982 | 34 | 307 | 1 | 3 | 31 | 1 | 376 |
| Quotas ('000 tonnes) | ||||
|---|---|---|---|---|
| Year | Closed Season | Minium | Pilchard | Global |
| Net Mesh | and Horse | (All | ||
| Size(mm) | Mackerel | Species) | ||
| 1943-49 | - | - | - | |
| 1950 | - | 38 | - | |
| 1951 | Pilchard 1/9-31/10 | 38 | - | |
| 1952 | Pilchard/Horse mackerel 1/9-31/10 | 38 | - | |
| 1953 | Pilchard/Horse mackerel 1/10-31/12 | 38 | 226.9 | |
| 1954 | Pilchard/Horse mackerel 1/9-31/10 | 38 | 226.9 | |
| 1955 | - | 38 | 226.9 | |
| 1956 | - | 32 | 226.9 | |
| 1957 | - | 32 | 226.9 | |
| 1958 | Pilchard/Horse mackerel 1/9-31/12 | 32 | 226.9 | |
| 1959 | Pilchard/Horse mackerel 15/8-31/12 | 32 | 226.9 | |
| 1960-62 | Pilchard 1/8-31/12 | 32 | - | |
| Horse/Chub mackerel 1/8-31/10 | ||||
| 1963 | Pilchard 1/8-31/10 | 32 | - | |
| Horse/Chub mackerel 1/8-31/10 | ||||
| Anchov 1/1-31/8/ | 12.7 | |||
| (6 vessels) | ||||
| 1964 | Pilchard/Round herring 1/8-31/12 | 32; 12.7 | - | |
| (48 vessels) | ||||
| Horse/Chub mackerel 1/8-31/10 | ||||
| 1965 | Pilchard/Round herring 1/8-31/12 | 12.7 | - | |
| (all vessels) | ||||
| Horse/Chub mackerel 1/8-31/10 | ||||
| 1966 | 1/10-31/12 | 12.7 | - | |
| 1967 | 1/10-31/12 | 12.7 | - | |
| 1968 | 16/9-31/12 | 12.7 | - | |
| 1969 | 1/9-31/12 | 12.7 | - | |
| 1970 | 1/9-31/12 | 12.7 | - | |
| 1971 | (Chub mackerel 1/10-31/12 | 12.7 | 362.9 | |
| Other species 1/9-31/12 | ||||
| 1972 | 5/8-31/12 | 12.7 | 453.6 | |
| 1973 | Chub mackerel 1/10-31/12 | 32 | (chub | |
| (6/6-30/9) | mackerel-) | |||
| Other species 1/9-31/12 | 12.7 | 430 | ||
| 1974 | Chub mackerel 1/10-31/12 | 32 | (Chub | |
| (26/6-30/9) | mackerel 50) | |||
| (26/6-30/9) | mackerel 50) | |||
| 1975 | 1/9-31/12 | 12.7 | 406 | |
| 1976 | 1/9-31/12 | 12.7 | 407 | |
| 1977 | 1/9-31/12 | 12.7 | 360 | |
| 1978 | 1/9-31/12 | 12.7 | 380 | |
| 1979 | 1/9-31/12 | 12.7 | 380 | |
| 1980 | 1/9-31/12 | 12.7 | 380 | |
| 1981 | 1/9-31/12 | 12.7 | 380 | |
| 1982 | 1/9-31/12 | 12.7 | 380 | |
Notes: i) Mesh of 38 mm used prior to 1956 rapidly shrank to about 32 mm.
Synthetic nets used thereafter did not shrink.
ii) Chub mackerel quotas indicated for 1973-75 applied only from a
date in June to end of September.
Data: 1943-1976 Crawford (1981c).
A quota for pilchard and horse mackerel was imposed in 1953, but rather flexibly applied until 1959, when it was considered too restrictive and dropped. Limitations on vessel capacity were introduced, but had little effect in curbing overall growth in the fleet hold capacity (Fig. 3a). In 1971 a global (all species) quota was reintroduced.
Prior to 1974 no quantitative assessment of sustainable yield of the fishery had been carried out; the basis for quotas was entirely intuitive, but "probably curtailed gross abuse of the stocks" (Newman and Crawford, 1980). Newman et al. (1974), following a power factor analysis for fishing vessels, regressed CPUE against effort (Schaefer model) to obtain a combined species MSY estimate of 360 thousand tonnes. Quotas were reduced to this level in 1977 but increased to 380 thousand tonnes the following year where they have remained since.
More recently, following an analysis by Crawford (1979), scientific recommendation has been to reduce the global quota to 325 thousand tonnes. Crawford's calculations using current effort levels and recruitment levels the average of those from 1964-1976, indicated a combined species catch of 375 thousand tonnes would eventuate. However, he recommended quota reduction to 325 thousand tonnes on the basis of effective disappearance of horse and chub mackerel from the catch. Crawford also noted that the smaller mesh net used since 1965 resulted in a poorer yield per recruit from pilchard, round herring and mackerel, and recommended attempts to avoid catching juveniles of these species.
The philosophy of a global quota is not based on a belief of a combined species carrying capacity. Rather it was felt that with a large number of species contributing to the landings, this provided some insurance against adverse fluctuations in the stock of a particular species (assuming fluctuations of the different stocks occur independently).
Until recently, major scientific concern was to reduce fishing pressure (in part through quota reduction) on the commercially more valuable pilchard resource to promote its recovery. However, over the past four years the global quota has been achieved only through increasing the anchovy contribution to 300 thousand tonnes, and concern is now growing that this species may be under threat of over-exploitation.
Egg surveys have indicated that the major anchovy (and pilchard) spawning areas are in the south in the Cape Agulhas area, and it is believed that eggs and larvae are transported northwards, with recruitment occurring from the area north of Lamberts Bay, and the fish migrating from there back to the southern areas (Crawford et al., 1980; Shelton and Hutchings, 1982).
Primarily juvenile anchovy are caught in the northern areas, principally in the autumn-winter months, with a greater proportion of adults from more southerly areas. O-year old anchovy make up a considerable proportion of the anchovy catch (see Fig. 4), and it is evident that the fishery is potentially very vulnerable to anchovy recruitment failure.
The SA fishery initially rose to deliver landings of some 400 thousand tons on the basis of strong pilchard recruitment in the late 1950's (see Fig. 6a). Newman and Crawford (1980) pointed out that on the basis of historic indices (see subsequent section) such high recruitment occurs infrequently, and this frequency may be further depressed by the spawning biomass decrements induced by the fishery.
The fishery has subsequently followed the classical pattern of moving from more to less valuable species to maintain the total catch. With anchovy now dominant, the multispecies "safety net" seems no longer available, and a less stable fishery in the future may be indicated.
It is interesting to note that despite continuous scientific advice towards greater caution, perhaps the most significant management restriction-the reimposition of a quota in 1971, and its decrease in 1977-correspond to the two collapse periods of the neighbouring SWA/N pilchard resource, which presumably engendered a more safety-conscious attitude in the SA management authority.
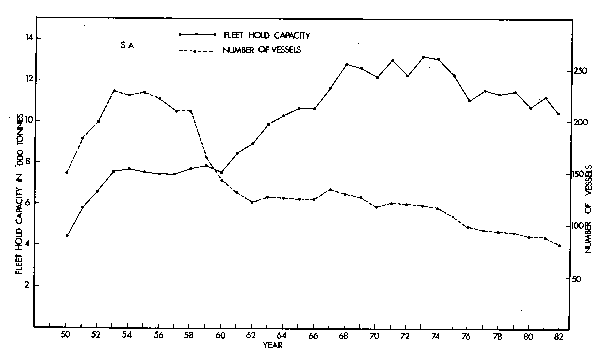
Fig. 3a. Trends in fleet hold capacity and number of vessels in the pelagic fisheries of SA.
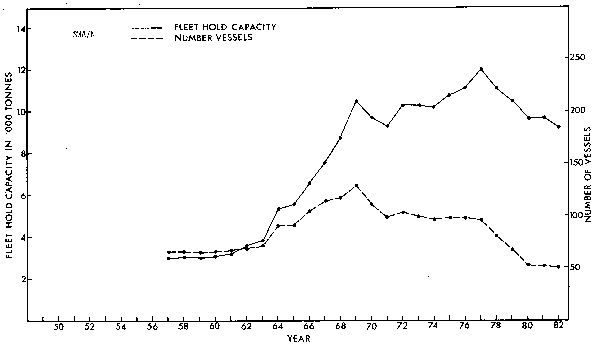
Fig. 3b. Trends in fleet hold capacity and number of vessels in the pelagic fisheries of SWA/N. (Data for SWA/N courtesy F. Schulein (pers. comm.)).
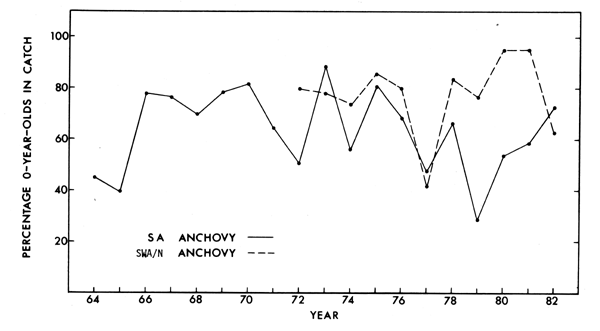
Fig. 4. Trends in the propotion by number of 0-year-olds in the anchovy landings in SA and SWA/N
Southwest African/Namibian Fishery
Like the SA pelagic fishery, the SWA/N fishery developed from shortly after the war. Fishing was carried out from the port of Walvis Bay (see Fig. 1) and for the first 20 years the industry was almost entirely based on a single species, the pilchard (Table 3, Fig. 5). Also indicated in these tables are foreign pilchard landings, primarily by Angola and the USSR; these are generally small, and only rarely have exceeded 20% of the SWA/N landings.
Closed seasons have applied for most of the history of the fishery (Table 4) for the same reasons as in SA: spawning season avoidance, low oil yield, and effort reduction. Spawning seasons are similar to SA, with a slightly later peak (le Clus and Thomas, 1982; le Clus and Melo, 1982).
Quotas were introduced in 1954. As in SA the basis for these was not scientific assessment of the stock, but essentially intuitive - in this case derived from the history of the Californian pilchard fishery. However, from 1959 quotas began to increase sharply coinciding with the rise in pilchard catches in SA, but were partially stabilized from 1964-1966 as the SA catch declined.
In 1966 a South African floating factory began operation off SWA/N, and a second the following year. This led in turn to further pressure for increased quotas for the land based industry and "set in motion an unhealthy trend in the fishery" (Anon. 1971).
Following an environmental anomaly in 1963 (Stander and de Decker, 1969), which led to a southerly displacement of pilchard shoals, a processing plant was opened in Lüderitz in 1964, and fishing continued from that port until 1974.
In 1963 experimental fishing for anchovy commenced with small mesh nets (11mm). Good results obtained by vessels using these nets, plus three vessels capsizing through gilling of intermediate sized pilchards in the larger mesh (32 mm) nets, led to pressures which saw the smaller mesh nets universally used from August 1968.
After record pilchard landings in 1968, the industry was unable to fill quotas in 1969, and the factory vessels were requested to withdraw in 1970, although one returned in 1971.
The rapidly declining pilchard catch saw major management initiatives introduced in 1971. The global quota was split with a certain proportion for pilchard and the balance for other species.
The "other species" quota was never any effective restriction, not once being closely approached by catches from 1971 to 1977. Indeed its intention was rather to encourage diversification of the excess fishing effort available away from pilchard; also in the light of the possibility that the pilchard stock might be suffering from competition from the anchovy, it was at that time regarded desirable to subject the anchovy to heavy fishing pressure.
In 1971 a major research programme, the Cape Cross Programme, commenced. Heavy accent was placed on surveys, both egg-larvae and aerial-acoustic. Though these did not permit sustainable yield evaluation, they did provide a relative (if not absolute) index of pilchard biomass trend; scientific advice with regard to increasing the pilchard proportion of the global quota was empirically based primarily on the results of aerial surveys.
Cram (1981) documents the reasons underlying suspension of the surveys in 1975 and 1976. Essentially there were administrative delays in transferring the research staff base from Walvis Bay, where it had proved impossible to retain the staff required for the surveys, to Cape Town. The belief that the crisis of the collapse of the late 1960's was past and the stock could "now be considered as recovered" (Cram, 1977), probably also contributed to diminished concern.
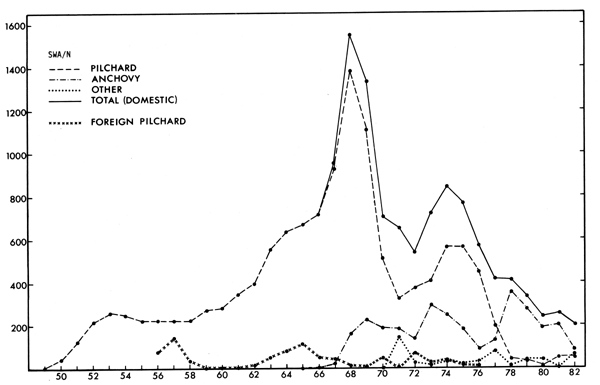
Fig. 5. Total domectic annual landings, and landings per species in the SWA/N pelagic fishery 1949-1982. The foreign (predominantly Angola and USSR) pilchard catch is also shown
| Local Industry | Foreign | |||||
|---|---|---|---|---|---|---|
| Year | catch | |||||
| Pilchard | Anchovy | Horse Mackerel | Other | Total | (Pilchard) | |
| 1947 | 1 | - | - | - | 1 | - |
| 1948 | 3 | - | - | - | 3 | - |
| 1949 | 8 | - | - | - | 8 | - |
| 1950 | 47 | - | - | - | 47 | - |
| 1951 | 127 | - | - | - | 127 | - |
| 1952 | 226 | - | - | - | 226 | - |
| 1953 | 262 | - | - | - | 262 | - |
| 1954 | 251 | - | - | - | 251 | - |
| 1955 | 227 | - | - | - | 227 | - |
| 1956 | 228 | - | - | - | 228 | 80 |
| 1957 | 228 | - | - | - | 228 | 147 |
| 1958 | 229 | - | - | - | 229 | 40 |
| 1959 | 274 | - | - | - | 274 | 5 |
| 1960 | 283 | - | - | - | 283 | 10 |
| 1961 | 344 | - | - | - | 344 | 7 |
| 1962 | 397 | - | - | - | 397 | 14 |
| 1963 | 555 | - | - | - | 555 | 53 |
| 1964 | 636 | 1 | - | - | 637 | 82 |
| 1965 | 666 | 1 | - | - | 667 | 114 |
| 1966 | 719 | 3 | - | - | 722 | 57 |
| 1967 | 926 | 24 | - | - | 950 | 44 |
| 1968 | 1.387 | 161 | - | - | 1,548 | 14 |
| 1969 | 1,110 | 226 | - | - | 1,336 | 10 |
| 1970 | 514 | 189 | - | - | 703 | 51 |
| 1971 | 325 | 185 | 140 | 5 | 655 | 3 |
| 1972 | 374 | 137 | 22 | 2 | 535 | 73 |
| 1973 | 408 | 296 | 12 | 4 | 720 | 24 |
| 1974 | 562 | 249 | 30 | 2 | 843 | 35 |
| 1975 | 561 | 186 | 14 | 8 | 769 | 15 |
| 1976 | 452 | 88 | 23 | 8 | 571 | 11 |
| 1977 | 200 | 133 | 82 | 1 | 416 | ? |
| 1978 | 46 | 355 | 10 | 0 | 411 | 5 |
| 1979 | 34 | 277 | 28 | 2 | 341 | 6 |
| 1980 | 11 | 190 | 39 | 0 | 240 | 1 |
| 1981 | 52 | 199 | 4 | 0 | 255 | ? |
| 1982 | 51 | 84 | 67 | 0 | 22 | ? |
NOTES FOR TABLE 4:
i) Figures shown for 1966-1967 for factory ships represent estimated catches; as no quotas were applied.
ii) Minor extensions to the season for experimental purpose in 1972-74 have not been shown.
iii) For 1978, the closure data shown corresponded to filling of the quota.
iv) For 1979-80, the pilchard quota applied to the quantity of pilchard canned only.
v) In years where measures were changed during the season, those shown are as finally applicable . Since 1979 measures have been very changeable and complex, and the tabular entries are intended to serve only as a representative summary.
Data 1947-1976 courtesy F. Schulein (pers. comm.).
| Quotas ('000 tonnes) | ||||||||
|---|---|---|---|---|---|---|---|---|
| Minimum | Pilchard | Global | ||||||
| Year | Season | net mesh | Area | Shore | Factory | Other | Anchovy | (All |
| size(mm) | Closure | Ship | Species) | |||||
| 1947-50 | ? | - | - | - | - | - | - | - |
| 1951 | 1/1-31/3 | 38 | - | |||||
| 1/5-31/12 | ||||||||
| 1952 | 1/1-29/2 | 38 | - | |||||
| 1/5-31/12 | ||||||||
| 1953 | 1/1-30/11 | 38 | - | |||||
| 1954 | 1/3-30/11 | 38 | 251 | |||||
| 1955 | 1/3-30/11 | 38 | 227 | |||||
| 1956 | 1/2-31/10 | 35 | 227 | |||||
| 1957 | 1/3-30/11 | 35 | 227 | |||||
| 1958 | 1/3-31/10 | 35 | 227 | |||||
| 1959 | 1/2-31/10 | 35 | 272 | |||||
| 1960 | 1/2-31/10 | 35 | 281 | |||||
| 1961 | 1/4-31/12 | 35 | 340 | |||||
| 1962 | 1/3-30/11 | 35 | 395 | |||||
| 1963 | 1/3-31/12 | 35; 11 | 544 | |||||
| (2 vessels) | ||||||||
| 1964 | 1/3-30/11 | 35; 11 | 653 | |||||
| (16 vessels) | ||||||||
| 1965 | 1/1-31/10 | 35: 11 | 667 | |||||
| (16 vessels) | ||||||||
| 1966 | 1/2-31/12 | 35; 11 | 667 | (45) | ||||
| (16 vessels) | ||||||||
| 1967 | 1/1-31/12 | 35; 11 | 800 | (236) | ||||
| (16 vessels) | ||||||||
| 1968 | 1/1-31/12 | 35; 11 | 880 | 452 | ||||
| (all vessels from Aug.) | ||||||||
| 1969 | 1/2-31/12 | 11 | 880 | 412 | ||||
| 1970 | 1/2-31/10 | 11 | 1,333 | - | ||||
| 1971 | 1/2-31/8 | 11 | North lat. | 271 | 181 | |||
| 20°30'S | ||||||||
| 1972 | 1/3-31/8 | 11 | North lat. | 370 | 542 | |||
| 20°30'S | ||||||||
| 1973 | 1/3-31/8 | 11 | North lat. | 460 | 446 | |||
| 20°30'S | ||||||||
| 1974 | 1/2-31/8 | 11 | North lat. | 575 | 372 | |||
| 20°30'S | ||||||||
| 1975 | 1/3-31/8 | 11 | North lat. | 571 | 372 | |||
| 20°30'S | ||||||||
| 1976 | 1/3-31/8 | 11 | North lat. | 475 | 465 | |||
| 20°30'S | ||||||||
| 1977 | 14/3-31/8 | 11 | 200 | 741 | ||||
| 1978 | 27/3-30/7 | 11 | 125 | 410 | ||||
| 1979 | 20/3- | 3/9 | 11 | 12.5 (can) | 341 | |||
| 1980 | 7/4-13/8 | 11 | Various | 4.0 (can) | 250 | |||
| 1981 | 23/3-27/4 | 11 | Various | No | 243 | |||
| canning | ||||||||
| 18/5-29/7 | ||||||||
| 1982 | 20/3- 1/5 | 28 | 30 | 220 | ||||
| (RSW only) | (RSW) | |||||||
| 1/6- 9/9 | 11 | |||||||
NOTES FOR TABLE 4: Please refer to footnote beneath Table 3.
Over this period the pilchard quota was retained at its 1974 level on the basis of CPUE trends, until a fishermen's strike following their concern at the lack of availability of fish saw the quota reduced by some 20% during the 1976 season. The 1977 quota was cut substantially when a pre-season aerial survey failed to reveal any major pilchard concentrations.
In 1978 with the recollapse of the pilchard stock evident, it was realized that the policy regarding other species required revision, as the anchovy had become the mainstay of the fishery and should be protected by more realistic quotas.
Historic performance over periods where fishing effort on anchovy had been essentially unrestricted indicated an average yield of some 200 thousand tonnes. A Schaefer model MSY calculation using annual catches and biomasses estimated using VPA produced a similar figure, though with large associated variance (le Clus and Melo, 1981).
The proportion of 0-year-old anchovy in the landings is extremely high (Fig. 4). While catches containing a larger proportion of adult anchovy are made to the far north of Walvis Bay throughout the season, the fishery relies predominantly on the "anchovy run" with large landings of 0-year-olds captured between latitude 22-23°S over the May-August period.
The initial 1978 anchovy quota of 200 thousand tonnes was increased during the season following indications from catch rates of good anchovy recruitment. Extensive egg surveys were reintroduced over the 1978-1979 spawning season, and subsequent scientific advice has been along the lines of an initial annual quota of some 150 thousand tonnes, to be revised during the season in the light of results of the egg survey and indications of recruitment strength from catch rates.
Actual management decisions have fluctuated somewhat over this period: a global quota in 1979, a form of the scientific proposals for the next two years, then a fixed anchovy quota of 220 thousand tonnes for 1982, when only 84 thousand tonnes were landed despite a two week entension of the fishing season following delayed and poor recruitment.
For the pilchard, scientific advice since 1978 has been based on forward projections of VPA stock estimates assuming recruitment proportional to spawning biomass, where the constant of proportionality is taken as the average of that figure for the preceding few years.
Because of economic returns and labour considerations pressure for a pilchard quota to allow some canning of pilchard (the most profitable feature of the industry) to continue has remained, though no canning occurred in the 1981 season following the poor 1980 catch.
Until 1977, pilchard catches were mainly in the region latitude 20-23°S, but subsequently have been much further north 18-20°S. Pilchard catching in this area has usually been restricted to vessels with RWS (refrigerated sea water) facilities, so that the catch remains fit for canning during the 20-35 hour return trip to Walvis Bay.
A further problem has been the by-catch of pilchards with anchovy shoals early in the season. Catch composition has been monitored on a daily basis, and areas where pilchard by-catch is high closed to fishing. This method has also been used to prevent capture of very small anchovy (>8 cm) as yield per recruit calculations indicate it preferable that netting of such fish be delayed.
In 1982 the early part of the season was restricted to RSW vessels operating with 28 mm mesh (too large to catch anchovy). The 11 mm mesh was permitted only from June when indications are that the juvenile pilchard have outgrown and separated from anchovy shoals, so that pilchard by-catch is reduced.
The historical trends indicated for this fishery are quite probably confounded to some extent by alleged illegal practices, which Cram (1981) documents in some detail. Such practices may have taken three forms:
a) Underrecording of landings: it is rumoured, for example, that the officially recorded pilchard catch maximum of 1400 thousand tonnes achieved in 1968, was in fact in excess of 2 million tonnes.
b) Species misidentification: the split quota system introduced in 1971 imposed initially substantial restrictions on pilchard landings, and misidentification of pilchard as other species has been alleged. Though species identification of the catch was not carried out accurately prior to 1971, it remains suggestive that in that year of the most strenuous pilchard restrictions, 140 thousand tonnes of horse mackerel is recorded landed, a figure never since approached by the pelagic fleet.
c) Dumping: species identification is problematic prior to catching, and in situations where pilchard quotas have been the limiting considerations, and also with factories wanting to can as much of the pilchard quota as possible, so requiring only pilchard in appropriately good condition, rumours of dumping have persisted up to the present day.
To eliminate the incentive to dump pilchard, the pilchard proportion of the global quota in 1979 was amended to a maximum allowance of pilchard for canning. However, this left the problem of unacceptably high pilchard by-catches, and was superceded by the further area, mesh size, and season restrictions described above.
STOCK ASSESSMENT TECHNIQUES
Virtual population analysis
VPA has been the principle method recently used to provide a baseline for comparison of abundance indices over the history of the fisheries, together with information on recruitment fluctuations, stock projections, and MSY estimates.
Biomass calculations from VPA for the four stocks under consideration are shown in Fig. 6. These VPA calculations of fishing mortality assume a fishing season from January to August in SA and from March to August in SWA/N, with 0-year-olds available only from May. These values of fishing mortality, together with von Bertalanffy type age-weight relations have been used to estimate biomass on a monthly basis. Recruitment is assumed to occur linearly over the March-June period for a more realistically smooth plot than would be produced by knife-edged recruitment.
Fig. 7 shows plots of recruitment against spawning biomass. Anchovy can reach full maturity in one year, and pilchard in two (though Thomas, pers. comm., reports indications of SWA/N pilchard now mature after a single year). Spawning biomass is thus taken as that present on the 1st January (approximate mid-point of spawning season) of that year, except that the youngest age class is excluded for the SA pilchard.
Beverton-Holt and Ricker type fits to these plots have been calculated using non-linear
regression (minimize ∑(R- )2) and are shown in Fig. 7. Shelton and Armstrong
(1983) report evidence of change in the length (and hence presumably age) at maturity
for both SA pilchard and anchovy over the history of the fisheries. Such behaviour,
which is consistent with a density dependent response of the adult population to biomass
changes, means that the spawning biomasses indicated in Fig. 7 are potential maxima,
rather than values achieved, with the empirically fitted curves reflecting in part this
response.
)2) and are shown in Fig. 7. Shelton and Armstrong
(1983) report evidence of change in the length (and hence presumably age) at maturity
for both SA pilchard and anchovy over the history of the fisheries. Such behaviour,
which is consistent with a density dependent response of the adult population to biomass
changes, means that the spawning biomasses indicated in Fig. 7 are potential maxima,
rather than values achieved, with the empirically fitted curves reflecting in part this
response.
The VPA calculations are based on various imputs and algorithms which are discussed below:
a) Annual catches
ListingThe possibility of underrecording, species misidentification, and dumping in SWA/N was discussed in the previous section, and may influence the biomass trends calculated. Foreign pilchard catches are included in the SWA/N calculations (including those by Angola - presumably from the same stock).
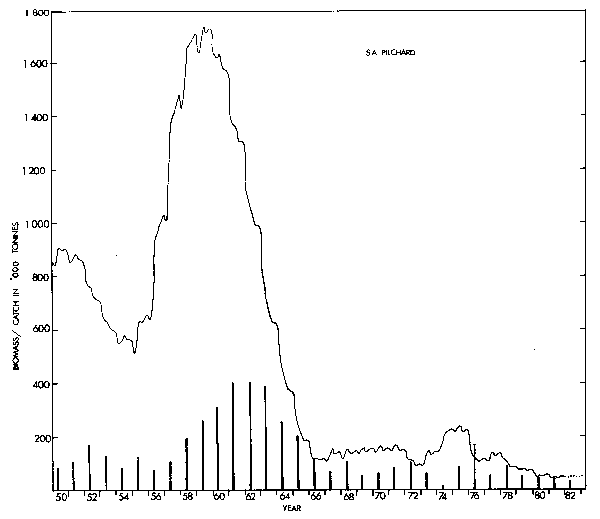
Fig. 6a. Monthly trend in biomass calculated by VPA, and annual landings (represented by vertical bars) for SA pilchard. Dashed portions (---) of the trends shown are less reliable.
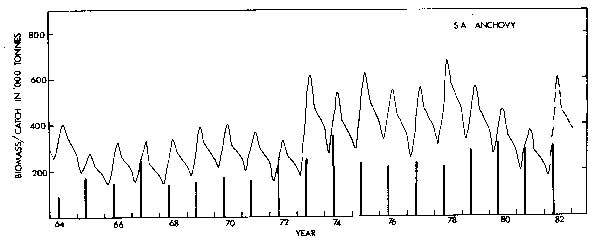
Fig. 6b. Monthly trend in biomass calculated by VPA, and annual landings (reprensented by vertical bars) for SA anchovy. Dashed portions (---) of the trends shown are less reliable.
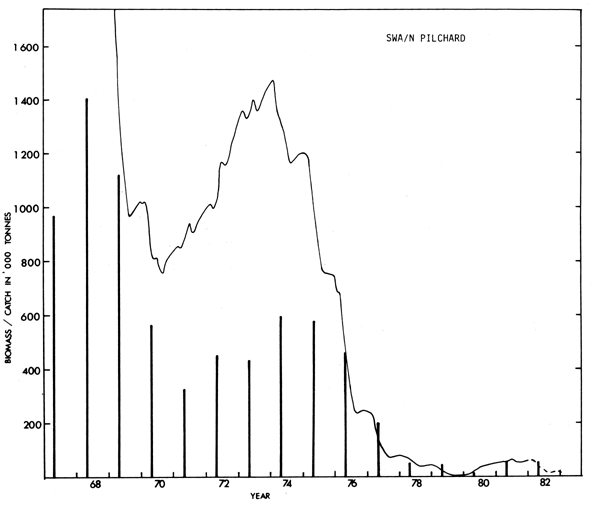
Fig. 6c. Monthly trend in biomass calculated by VPA, and annual landings (represented by vertical bars) for SWA/N pilchard. Dashed portions (---) of the trends shown are less reliable.
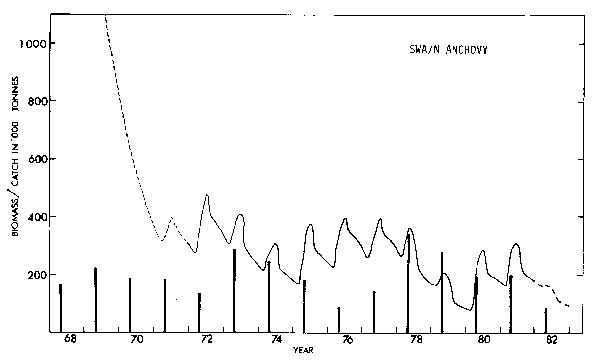
Fig. 6d. Monthly trend in biomass calculated by VPA, and annual landings (represented by vertical bars) for SWA/N anchovy. Dashed portions (---) of the trends shown are less available.
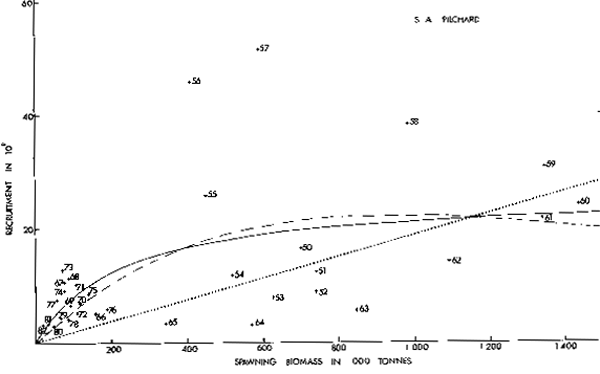
Fig. 7a. Plots of spawning biomass vs recruitment (O-group year-class strength) calculated by VPA for SA pilchard. Best fit Beverton-Holt and Ricker curves are indicated by (-----) and (---) repectively. The dotted line is the replacement line correcponding to unexploited equilibrium states.
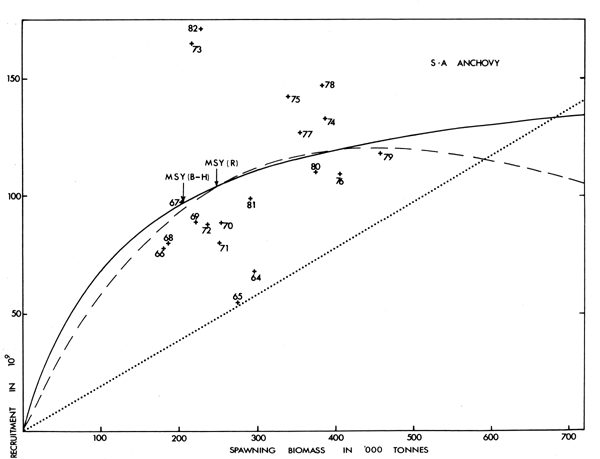
Fig. 7b. Plots of spawning biomass vs recruitment (O-group year-class strength) calculated by VPA for SA anchovy. Best fit Beverton-Holt and Ricker curves are indicated by(-----) and (---) respectively. The dotted line is the replacement line correcponding to unexploited equilibrium states.
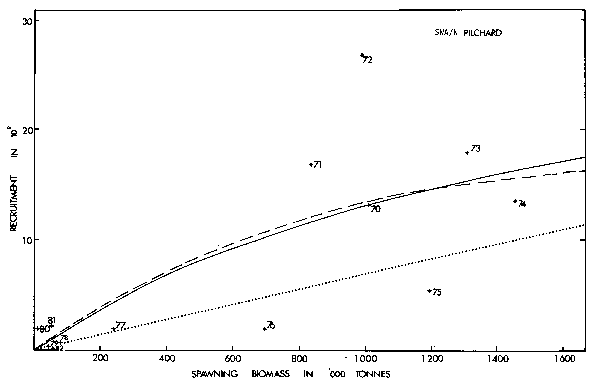
Fig. 7c. Plots of spawining biomass vs recruitment (O-group year-class strength) calculated by VPA for SWA/n pilchard. Best fit Beverton-Holt and Ricker curves are indcated by (-----) and (---) respectively. The dotted line is the replacement line corresponding to unexploited equilibrium states.
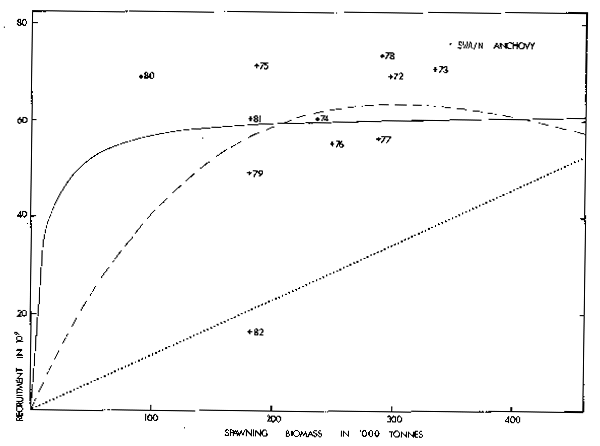
Fig. 7d. Plots of spawning biomass vs recruitment (O-group year-class strength) calculated by VPA for SA anchovy. Best fit Beverton-Holt and Ricker curves are indicated by(-----) and (---) respectively. The dotted line is the replacement line correcponding to unexploited equilibrium states.
b) Age composition
Table 5 lists the methods used to derive age compositions from length composition of the annual catches. The associated mean age trends of the catches are shown in Fig. 8.
A concern here is the frequency with which it has been necessary to apply age length keys for data from one period to length composition data from another Biomass calculations by VPA over a period where the age composition shows little trend can do no more than duplicate (slightly preceding) the catch history.
Fig. 9 and Table 6 show evidence of growth rate increase in the SWA/N pilchard corresponding to biomass reduction from the 1960's to 1970's. Modal length progression during the 1960's (Schulein and Thomas, pers. comm.) also suggest such increase, though these may also reflect the 1963 environmental anomaly (Stander and de Decker, 1969). Changes in the length at maturity for SA pilchard and anchovy referred to above, may also reflect compensatory growth rate changes. le Clus and Melo (1983) refer to possible changes in growth rate with area for the SWA/N anchovy.
| Age increment in Years | 1-2 | 2-3 | 3-4 | 4-5 |
|---|---|---|---|---|
| Period | ||||
| 1967-68 | 1.2 | 0.4 | 0.2 | 0.4 |
| 1968-69 | ||||
| 1969-70 | ||||
| 1970-71 | ||||
| 1971-72 | 2.6 | 1.3 | 0.8 | 0.6 |
| 1972-73 | 2.4 | 1.1 | 0.7 | 0.6 |
| 1973-74 | 1.6 | 0.9 | 0.8 | 0.7 |
| 1974-75 | 1.1 | 0.8 | 0.7 | 0.5 |
| 1975-76 | 2.1 | 0.5 | 0.3 | -0.1 |
| 1976-77 | 2.1 | 0.7 | 0.1 | 0.0 |
| 1977-78 | 1.1 | 0.3 | -0.1 | -0.3 |
| 1978-79 | 2.1 | 1.3 | 1.1 | 1.0 |
| 1979-80 | 4.4 | 1.7 | 1.0 | 1.1 |
| 1980-81 | 3.9 | 1.9 | 1.7 | 1.2 |
The mean age time series shown in Fig. 8 show suspiciously little trend in some cases contrary to what might be expected with presumably large changes in fishing intensity. They could however be confounded by density dependent changes to age length keys, thus introducing bias to both biomass and recruitment estimates.
This underlines the importance of regular ageing analyses, and the possible unreliability of length distributions as an index of the health of pelagic fish stocks.
c) Natural mortality (M)
Calculations of natural mortality from the age distribution of initial catches is viable only for one of the stocks under consideration here. Length distribution data is not available for the earliest years of either pilchard fishery; and even for the first years for which it is, age length keys from other periods would have to be applied. Length data for the opening years of anchovy fishing in SWA/N is based on small and probably unrepresentative samples (hence also the unreliability of biomass estimates for that period: Fig. 6d).
For the first two years (1964-1965) of the SA anchovy fishery, by disregarding 0-year-olds as not fully selected, and 4-year-olds as unrepresentatively small in number one obtains estimates ranging from 0.82 to 1.36 with a mean of 1.14.
| SA PILCHARD | SA ANCHOVY | SWA/N PILCHARD | SWA/N ANCHOVY | ||||
|---|---|---|---|---|---|---|---|
| Period | Method | Period | Method | Period | Method | Period | Method |
| 1950-71 | Same key | 1964-82 | Same key | 1967-68 | Different | 1968-78 | Same key |
| each year | each year | key each | each year | ||||
| from | from | year from | being | ||||
| otoliths | scales | Otoliths | average | ||||
| collected | collected | of that | of keys | ||||
| 1965-67 | 1965-67 | year* | for | ||||
| 1979-82 | |||||||
| 1971-82 | Different | 1969-70 | Key | 1979-82 | Different | ||
| key each | average | keys for | |||||
| year from | of 1968 | each | |||||
| otoliths | and 1971 | month | |||||
| of that | keys | based on | |||||
| year | otoliths | ||||||
| 1971-82 | Different | ||||||
| key each | |||||||
| year from | |||||||
| otoliths | |||||||
| of that | |||||||
| year | |||||||
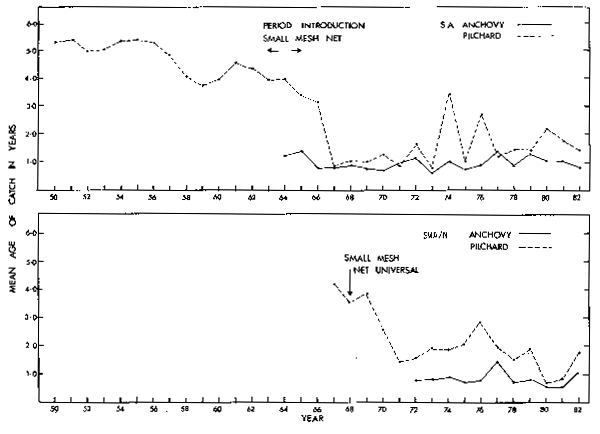
Fig. 8. Mean age of achovy and pilchard in the catches by year.
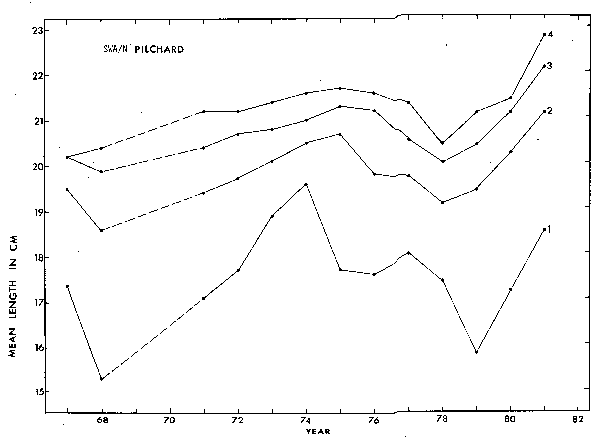
Fig. 9. Mean lengths of 1,2,3 and 4 year-old pilchard in the SWA/N catch from 1967-1981. (Data not available for 1969-1970.)
Natural mortality is presumably a reflection in the main of predator consumption. The average of such consumption implied by VPA has been calculated over the period 1973-1982 for the SA anchovy and is shown in Fig. 10 for various values of M.
Also shown in Fig. 10 is an estimate (Eales,1982), of annual anchovy consumption by seals, whales, and birds in the area. This is a lower limit in that the contributions of fish predators (such as snoek) and dolphins are omitted. Current research aims to improve these estimates.
An estimate of M=1.1 is reasonably consistent with both approaches and has been used for both anchovy stocks.
For pilchard a value of M=0.5 is traditional. Newman's (1970a) analysis of tag returns for SWA/N pilchard indicated total mortality Z in the 0.7-0.8 range for the period 1957-1966. This suggests that a value of M much higher than 0.5 is unlikely.
Trends in aerial estimates of the SWA/N pilchard stock are consistent with the value of M=0.5 (see subsequent section).
Using a fixed value for M is a simplification for an effect that must be dependent to some extent on the age of the fish, and response (conceivably delayed) of predator populations to changing prey biomass. While the biases that neglect of such effects may introduce into VPA estimates merit qualitative investigation, quantitative allowance seems at best a distant prospect.
d) Terminal Fishing Mortality (Ft)
VPA requires an estimate of the fishing mortality (Ft) of the oldest aged fish appearing in the catch from each year class. The prescription used here is to achieve iteratively a solution where the Ft value for each year is an average of the F values for the other older ages that year, i.e. assuming that selectivities for the older ages would be the same.
i = age,
y = year
Due to a greater age spread, the choice of Ft makes little difference to estimates for pilchard, whereas for anchovy the sensitivity is quite substantial, and further work is needed to investigate whether such an algorithm introduces bias, and to try other methods such as that of Pope and Shepherd (1982).
For example, there is the possibility that the SA fishery does not exploit the full geographic range of the anchovy, and that the low proportion of adults in the catch is a reflection of emigration of the older fish from the fishing area rather than heavy exploitation. Anchovy are known to be present (and to spawn) well to the east of longitude 21°E, though the fraction of the total biomass this represents is unknown. A 1983 survey of pelagic-shoal-feeding Brydes whales off the SA west and south coasts has shown the major concentrations of these whales in this eastern region.
Such emigration could be represented by progressively lower selectivities for older anchovies. Fig. 11 compares the standard VPA series for the SA anchovy with that corresponding to Ft decreased by 20% in the iterative algorithm. The difference is substantial emphasising the sensitivity to this aspect, and the need for simulation studies to test the extents to which invalid assumptions and algorithms may introduce trends that are artefacts rather than real effects.
e) Current Year Fishing Mortalities
Estimates of current (ỹ) and immediately previous years' biomass - the main requirement for management - require values of F for each age of the most recent year. This has also been achieved iteratively from a value of the fishing effort for the year (Eỹ) and assuming F proportional to E, the constant of proportionality for each age being given by the average over the immediately previous few years:
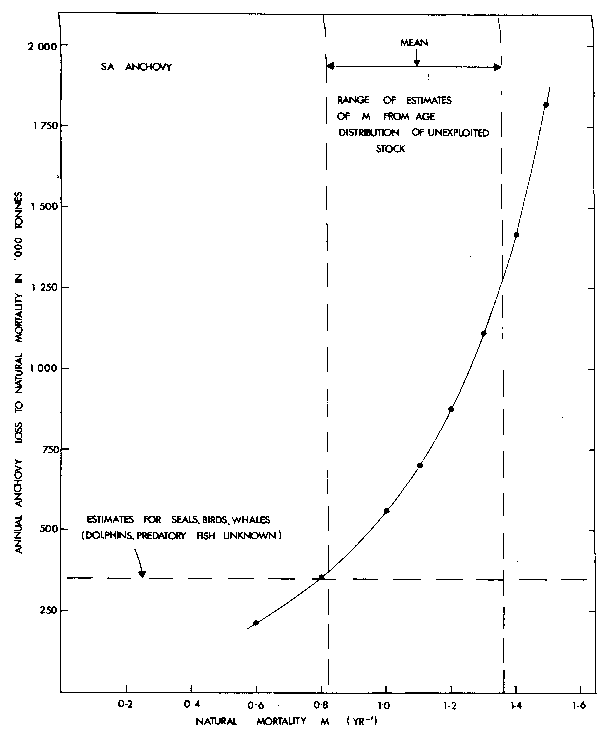
Fig. 10. Average annual loss of anchovy to natural mortality in SA over the period 1973-1982, estimated by VPA, as a function of anchovy natural mortality M.
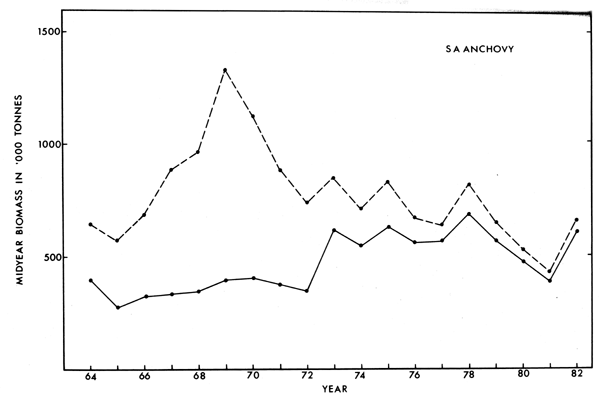
Fig. 11. Mid-season biomass trends for the SA anchovy from VPA corresponding to the normal producre for Ft determination (-----), and a prescription lowering the selectivity of the oldest age-class by 20% (---) (see text).

The appropriateness of the F proportional to E assumption is discussed in the following section.
CPUE
There are two problems with effort in a mixed-species purse-seine fishery: how to define it, and how to allocate it if species directed fishing is taking place.
Effort in the SA fishery has been calculated in "standard boat days" using a power factor analysis by multiple linear regression over the period 1964-1972 (Newman et a1., 1979); a number of fishing aids (power-block, sonar, fish pump, smaller mesh nets) were introduced over this period, and their effect estimated in the analysis.
In SWA/N a product of vessel hold capacity (the most significant factor in the SA analysis) and time at sea has been used for the period since the inception of such data collection in 1972; the fishing aids listed above were all generally available over that period. Fuel issue has also been used as a measure of effort in SWA/N; data is available from 1965.
Theoretically the linear relation of CPUE to abundance relies on either uniform random distribution of fishing effort over the range of the fish stocks, or a uniform random distribution of fish (maintained by migration to compensate for localized catches). In the absence of species-directed fishing, the total effort apolies to each species. In practice some species direction takes place through cooperation between vessels having identified a particular species in a certain area, so that a given species cannot be considered subject to the total effort applied. For SWA/N directed effort has been semi-arbitrarily defined as only those trips where the vessel's catch comprises more than 50% of the species under consideration and is counted towards the directed catch of that species. The total effort on the species is then this directed effort multiplied by the ratio of the catch to directed catch of the species. The results following use this species effort allocation for SWA/N but total effort for SA where data on effort allocation on this basis is not available.
Fig. 12 compares VPA mid-year biomasses and CPUE indices; the latter have been
renormalized to the average VPA biomass over 1964-1982 (SA) and 1972-1982 (SWA/N). Plots
of annual mean fishing mortalities ( ) against effort (E) are shown in Fig. 13; and of
catchability q=/E against biomass in Fig. 14. VPA estimates of fishing mortalities for
each age weighted by the numbers caught of that age, have been used to calculate .
) against effort (E) are shown in Fig. 13; and of
catchability q=/E against biomass in Fig. 14. VPA estimates of fishing mortalities for
each age weighted by the numbers caught of that age, have been used to calculate .
While broad trends in Fig. 12 are similar, there is much detailed difference. (For pilchard there is some indication that CPUE lags VPA, perhaps as the fishery exploits the older age-classes more heavily.) This is reflected in the large scatter in the F vs E plots in Fig. 13. Linear regressions have been shown in these as a guide to trends, and associated correlation coefficients are given in Table 7. In the case of the two SA fisheries it is clear that these trends are strongly influenced by outlying points in the plots. Only for the SWA/N anchovy does the trend approach the proportionality theoretically desirable.
The piots of catchability against biomass in Fig. 14 are to investigate the possibility that this increases with biomass decline, so that CPUE would underestimate a stock decrease; linear regressions are again shown to indicate trends. Little effect is apparent for the SA pilchard, but any trend may be confounded by failing to take SA species direction of effort into account. There are negative trends for both anchovy stocks, but these are again strongly influenced by outlying points.
For the SWA/N pilchard there is as marked increase of q as biomass declined; the associated CPUE underestimate of stock decrease is evident in Fig. 12c. For SWA/N lower CPUE values correspond to northward contraction of the stock as it declines so that vessels had to travel further from port to make catches. It is reasonable to assume that the method used for effort estimation in this case yields CPUE values monotonically increasing with stock size, but there is no particular reason why the relation should be linear.
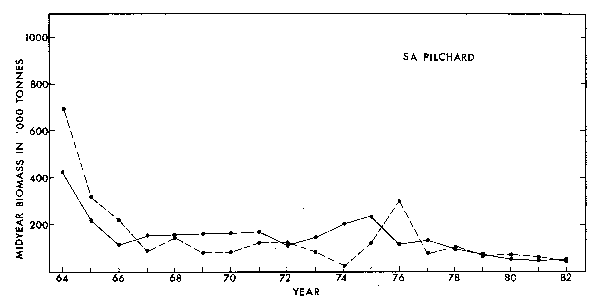
Fig. 12a. Comparsion of VPA estimates of mind-year biomass (solid line) with CPUE indices for SA pilchard. The CPUE indies have been renormalised to the average of the VPA biomasses over the peridos 1964-1982 for SA and 1972-1982 for SWA/N. For SA the effort measure used is "standard boat days" (undirected), and the index is indicated by (---).
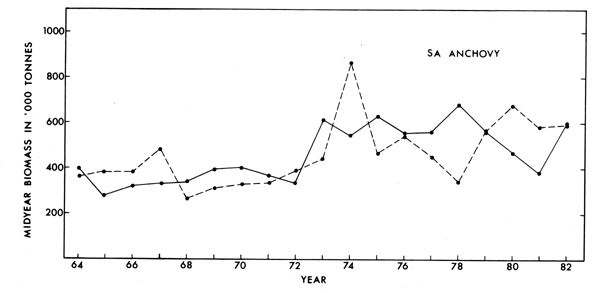
Fig. 12b. Comparison of VPA estimates of mind-year biomass (solid line) with CPUE indices for SA pilchard. The CPUE indies have been renormalised to the average of the VPA biomasses over the peridos 1964-1982 for SA and 1972-1982 for SWA/N. For SA the effort measure used is "standard boat days" (undirected), and the index is indicated by (---).
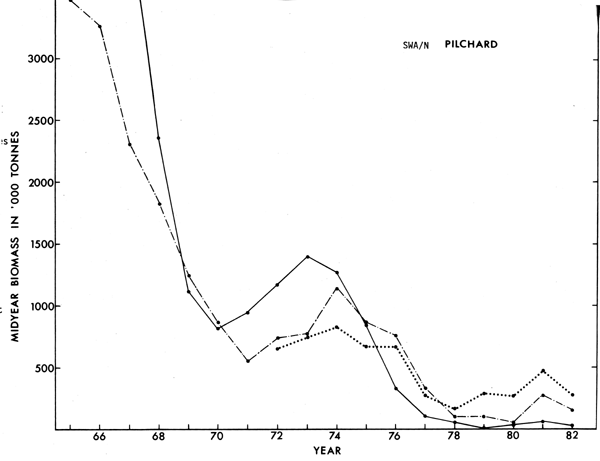
Fig. 12c. Comparsion of VPA estimates of mind-year biomass (solid line) with CPUE indices for SA pilchard. The CPUE indies have been renormalised to the average of the VPA biomasses over the peridos 1964-1982 for SA and 1972-1982 for SWA/N. For SWA/N CPUE trends for two effort measures are shown: directed effort in tonne-hours (.....), and fuel issue (undirected) (-.-.-.-.).
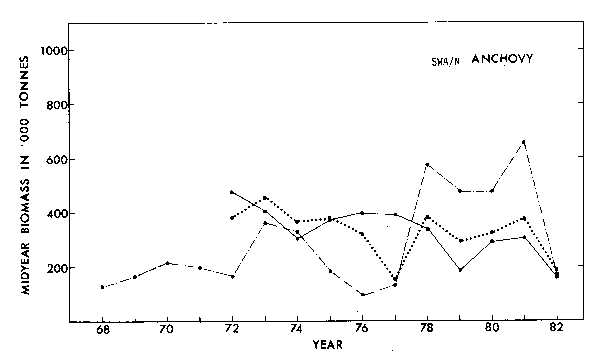
Fig. 12d. Comparsion of VPA estimates of mind-year biomass (solid line) with CPUE indices for SA pilchard. The CPUE indies have been renormalised to the average of the VPA biomasses over the peridos 1964-1982 for SA and 1972-1982 for SWA/N. For SWA/N CPUE trends for two effortmeasures are shown:directed effortin tonne-hours(.....), andfuel issue(undirected)(-.-.-.-.).
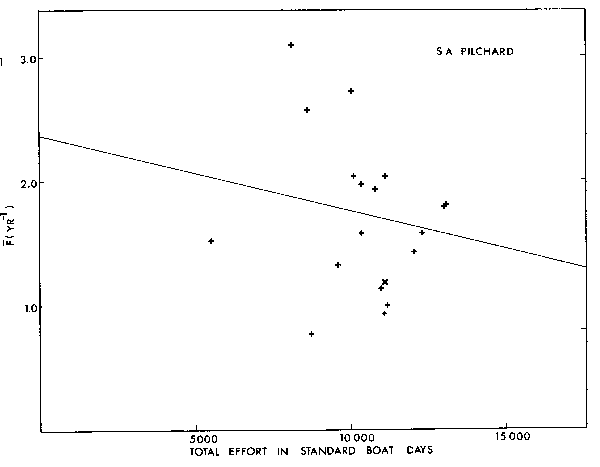
Fig. 13a.
Plots of annual
mean fishing
mortalites
against E for
1964-1982 for
SA pilchard.
The 1982 point
is inditacated
by a (x). A
Linear
regression fit
to the data
is shown.
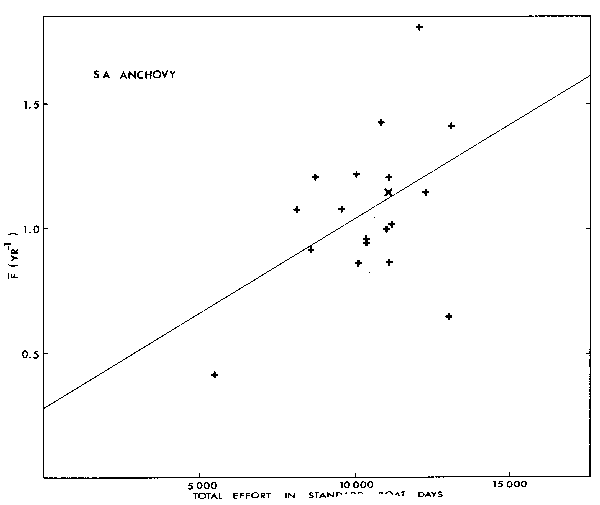
Fig. 13b.
Plots of annual
mean fishing
mortalites
against E for
1964-1982 for
SA anchovy.
The 1982 point
is inditacated
by a (x). A
Linear
regression fit
to the data
is shown.
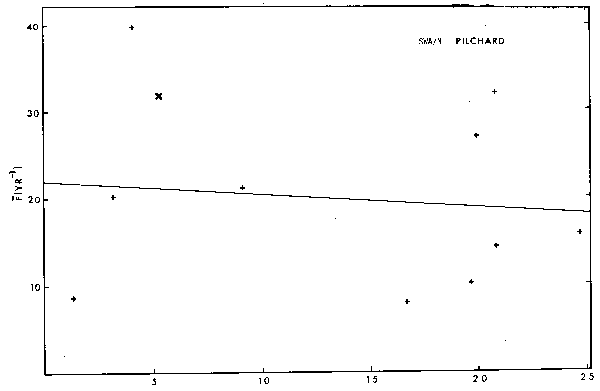
Fig. 13c. Plots of annualmean fishingmortalites against E for 19-1982 for SWA/N
pilchard. The 1982 point is inditacatedby a (x). ALinear regression fit to the data isshown.
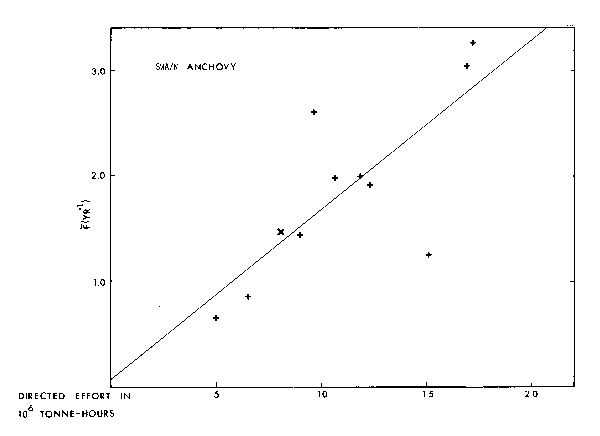
Fig. 13d. Plots of annualmean fishingmortalites against E for 19-1982 for SWA/N
anchovy. The 1982 point is inditacatedby a (x). A Linear regression fit to the data isshown.
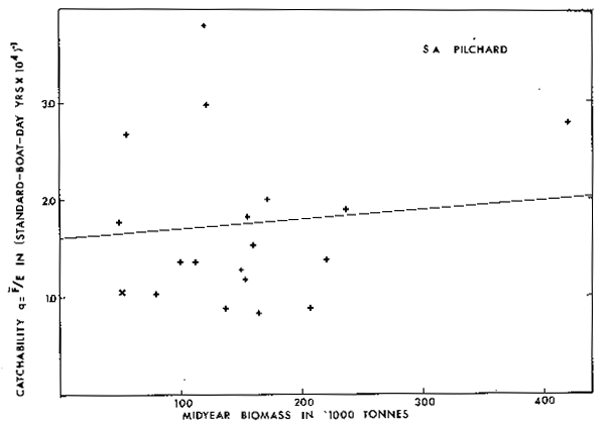
Fig. 14a. Plots of catchability q=/E against mid-year biomass from VPA for SA pilchard.
Effort measures and other conventions are as for Fig. 13.
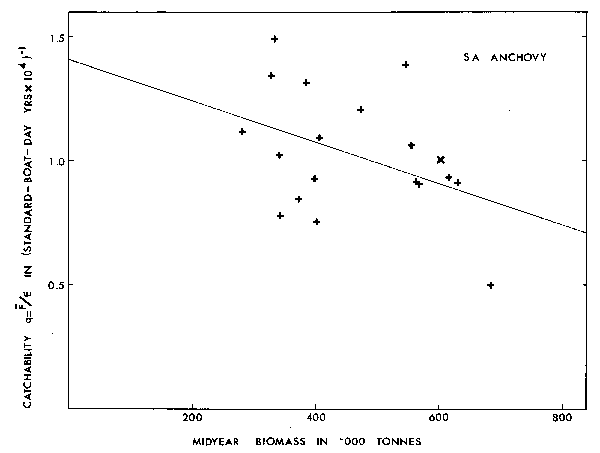
Fig. 14b. Plots of catchability q=/E against mid-year biomass from VPA for SA anchovy.
Effort measures and other conventions are as for Fig. 13.
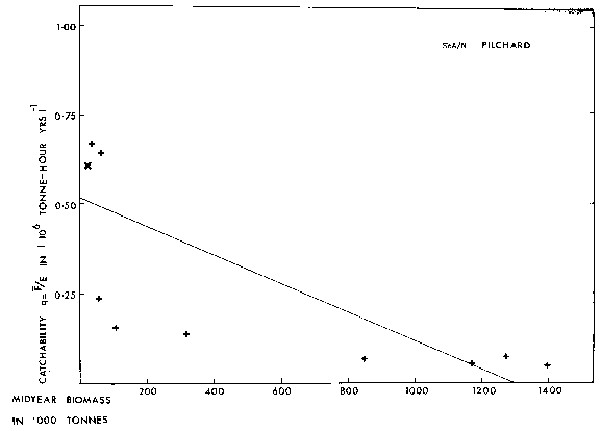
Fig. 14c. Plots of catchability q=/E against mid-year biomass from VPA for SWA/N pilchard.
Effort measures and other conventions are as for Fig. 13.
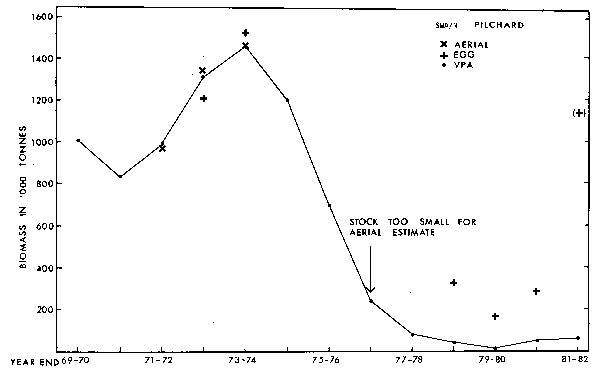
Fig. 14d. Plots of catchability q=/E against mid-year biomass from VPA for SWA/N anchovy.
Effort measures and other conventions are as for Fig. 13
The poor relationship between and E has important implications. The method
indicated for current year fishing mortality estimation for VPA calculations may be
unreliable (though this requires quantitative investigation), placing doubt on the
important current biomass estimates the method provides.
While alternative effort measure providing improved correlations with might be
desirable, those used at present would nevertheless be roughly proportional to operating
costs. There is no clear evidence from the data that larger stocks would provide
proportionately higher catch rates, so that the economic rationale of a (temporary) quota
reduction to supposedly achieve improved catch rates in due course is open to question.
The theoretical desirability for stability purposes of managing a pelagic fishery on the basis of constant fishing mortality rather than, say, constant quota is clear. If F is indeed proportional to E, the desired fishing mortality can be achieved by appropriate effort restriction. However, in the Southern African situation where there seems considerable fluctuation about such "relation", it is not clear that effort restriction alone could provide the necessary effect of adequately decreasing catches to compensate for a fall in stock size.
Table 7: Statistics of fits to data from VPA for the stocks under consideration.
| ANCHOVY | PILCHARD | |||
|---|---|---|---|---|
| SA SWA/N | SA SWA/N | |||
| Linear regressions | ||||
| vs E : r | +0.46 | +0.76 | -0.19 | -0.13 |
| q vs B : r | -0.41 | -0.53 | +0.10 | -0.68 |
| Stock-Recruit fits | ||||
| Beverton-Holt | ||||
| Equation: = | 160S | 62S | 26S | 35S |
| 130 + S | 9 + S | 220 + S | 1600 + S | |
| Mean relative | ||||
| deviation | 0.22 | 0.19 | 0.50 | 0.59* |
| Serial | ||||
| Correlation | +0.25 | -0.19 | +0.77 | +0.57 |
| Ricker | ||||
| Equation: = | 0.73 | 0.57 | 0.064 | 0.022 |
| Se-S/450 | Se-S/300 | Se-S/950 | Se-S/2100 | |
| Mean relative | ||||
| deviation | 0.22 | 0.24 | 0.66 | 0.58* |
| Serial | ||||
| Corelation | +0.23 | -0.21 | +0.77 | +0.57 |
= Average fishing mortality
E = Fishing effort;
q = /E = Catchability;
B = Mid-year biomass;
S = Spawning biomass (000' tonnes);
R = Recruits (0-year-class strength in billions (109);
r = Correlation coefficient.
* Omitting very large 1980 value to preclude it swamping the others.
Aerial and hydroacoustic surveys
Aerial observations supplemented by shipboard hydroacoustic data provided the primary abundance index used to monitor the SWA/N pilchard stock from 1972 to 1974.
The methods are described in Cram and Hampton (1976) and Cram (1977). Basically an aircraft, operating at night and observing shoals through bioluminescence, was used to map out the perimeter of loose aggregations of shoals ("shoal-groups"), and to calculate the proportion of this area covered by shoals. The role of the ship was to determine shoal thickness and packing density (number of fish per unit volume) by hydroacoustic means, together with species composition and fish mass from catch samples.
Biomass estimates were made using increasingly sophisticated applications of this technique from 1972-1974 (Cram and Agenbag, 1974). In Fig. 15 these are compared to VPA estimates of end of year biomasses (corresponding roughly to the midpoint of the survey Periods). The estimates have been renormalised to provide the same average as the VPA estimates over the same period (a 55% reduction); packing density estimates were poor so absolute estimates are somewhat doubtful.
The extremely good agreement, indicated in Fig. 15 must be tempered by the following facts. Errors of estimates are not shown, but the coefficient of variation was crudely reckoned at 50% (Hampton et al., 1979); also the choice of M=0.5 for VPA was in part influenced by producing similar biomass trends to the aerial surveys. Nevertheless in retrospect the performance of this survey method seems very promising, and it is most unfortunate that surveys were suspended in 1975 and 1976 precluding the important test of their ability to have detected the pilchard biomass decline. When surveys recommenced in 1977, the stock was too low to be able to apply the method for quantitative estimates.
The particular advantage in aircraft utilization is the large area coverage practical. Cram and Hampton (1976) indicate that over similar time periods, an aircraft surveys a surface area some two orders of magnitude greater than that insonified during a hydroacoustic ship survey. The method also relied on indications that most of the pilchard stock was observable by bioluminescence, and that most of what was seen was pilchard.
Regrettably prospects of using similar methods for anchovy do not appear promising (Agenbag, 1982). Inconsistent shoaling behaviour and the possibility that many shoals are not seen considerably increases variance. To provide an index of abundance (such as shoal area) from aircraft measurements alone, repeated surveys have to be undertaken for reliable results (i.e., to decrease variance), but would substantially increase costs.
Agenbag remarks that aerial observations, hydroacoustic surveys, and experimental catches in SWA/N during summer months all indicate too few anchovy shoals for reliable estimation procedures (possibly confirmation of VPA estimates (Figs. 6b, 6d) that indicate relatively low biomass over this period). This indicates winter surveys, but weather condition then are generally less favourable for such work.
The most likely role for aircraft work on anchovy will be in a scouting capacity to identify areas of greater abundance and so assist plan stratification of hydroacoustics surveys.
Initial plans for hydroacoustics work in SA are for broad distributional surveys to identify anchovy concentrations for later stratification purposes, and stock boundaries. As the fishing fleet samples the fish nearest port rather than conducting a random survey, inferences on stock boundaries drawn from fishery statistics may be biased by the location of fishing harbours (Fig. 1). Consequently the proportion of the stock's biomass located north of latitude 31°S or east of longitude 21°E is unknown. Trawl samples carried out for species identification purposes during such surveys should also provide age structure information unbiased by the fishery.
Hampton (1982) discusses features of future hydroacoustic surveys. It is intended to use horizontal sonar (to obtain a wider range coverage) for shoaling fish, and vertical echo-sounders when fish are dispersed. While target strength estimation for absolute abundance assessment may prove difficult, the method should nevertheless be able to indicate relative stock trends. It is hoped that a coefficient of variation of less than 25% for an assessment from a 1-month survey can be achieved.
Fig. 15a. Comprarison of end year biomass estimates from VPA with those from aeriel and egg surveys for SWA/N pilchard. The survey estimates have been renormalised to the average VPA biomasses for the correcponding years, excepting the 1981/82 pilchard egg estimate which is regarded as unreliable (see text).
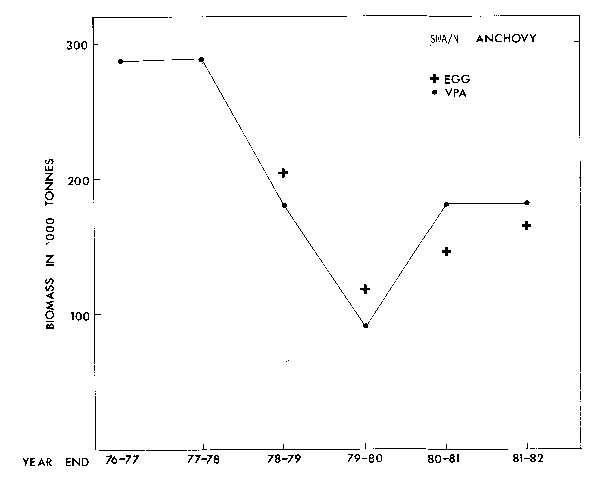
Fig. 15b. Comprarison of end year biomass estimates from VPA with those from aeriel and egg surveys for SWA/N anchovy. The survey estimates have been renormalised to the average VPA biomasses for the correcponding years, excepting the 1981/82 pilchard egg estimate which is regarded as unreliable (see text)
Further utilization of multi-frequency techniques may permit distinction of adult and juvenile anchovy so that early estimates of recruitment strength (of particular importance for the anchovy where 0-year-olds consititute most of the catch) may become available.
![]()
![]()
![]()