![]()
![]()
![]()
Egg and larval surveys
Intensive egg and larval surveys intended for quantitative assessment purposes commenced over the 1972/73 spawning season off SWA/N. Further surveys took place during the following season, but were then suspended until 1978/79; since then they have been carried out every year. Typically samples are taken at 1,000 stations spread over 5 cruises during the September-March period.
Estimates of total egg production over each spawning season have been made using an integration method (le Clus and Thomas, 1981, 1982; le Clus and Melo, 1981, 1982; le Clus, 1982). The intention has been to provide a measure of the spawning biomass that created the eggs, rather than an extrapolation from eggs to predict recruitment (because of the many, and variable effects playing a role between egg and recruit stages). As the number of occasions on which the fish spawn over the summer months is not known, the egg production figures have been used as a relative rather than an absolute index of spawning biomass.
Comparisons with VPA estimates of spawning biomass are shown in Fig. 15. Spawning biomass is taken as the biomass on 31st December, correspondingly roughly to the midpoint of the spawning season (i.e. fish assumed mature after 1 year - see VPA section). For comparative purposes egg estimates have been renormalised to the VPA average over the years surveys took place (excluding 1981/82 for the pilchard).
The plots show that the egg surveys produce the same trends as shown by VPA, but it is noticeable that the VPA calculated decline in stock is underestimated by the egg method It seems plausible that this occurs through density dependent population responses. shelton and Armstrong (1983) discuss changes in the SA pilchard and anchovy length (and thus presumably age) at maturity corresponding to stock size changes. Further Fig. 16 (Thomas, pers. comm.) indicates that mean gonad mass of the SWA/N pilchard shows an increasing trend with time. (Note this last refers to the catch as a whole and has yet to be adjusted for changing age structure for a more representative plot; the low 1981 figure for example corresponds to a year of low fishing intensity on older pilchard because canning was suspended for that year. In view of the mean age trend (Fig. 8), such correction would be likely to accentuate the trend.)
The effect of a drop in the age at maturity and gonad mass increase as the biomass declined would be to improve the agreement between VPA and egg estimates of the spawning biomass of the SWA/N pilchard shown in Fig. 15a. Nevertheless, this implies that egg surveys, taken at face value, can underestimate stock declines because of compensatory mechanisms.
A major problem with these egg surveys has been the very skew distribution of eggs per sample. A very few large samples have a considerable influence on the final estimates; though variance calculations have yet to be carried out, coefficients of variation seem likely to be rather high in consequence. (For this reason, the 1981/82 estimate for pilchard is regarded with some suspicion; the surveys conducted that season were less intensive than usual). At present experiments aimed at replacing Bongo nets with the smaller Calvet nets are in progress; it is hoped that a greater number of small sized samples may counter this difficulty.
The method is a valuable monitor of the SWA/N pilchard stock where current small catches may be unrepresentative; however it is of less value for anchovy where recruitment accounts for a much larger fraction of the catch.
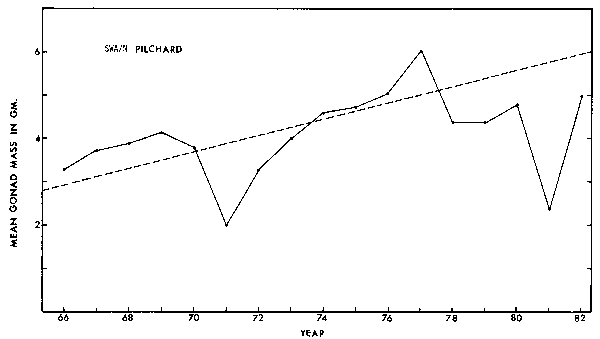
Fig. 16. Trend in mean gonad mass of the SWA/N pilchard catch (uncorrected for catch age structure). A linear regression fit is shown (r = +0.14)
Tagging
Between 1956 and 1966 some 75,000 pilchards were tagged in SA waters, and 150,000 off Walvis Bay. Newman (1970a) analysed the SWA/N returns for stock estimation purposes, obtaining values of 5.6 million tonnes for the period 1957-1960, and 6.8 million tonnes for 1963-1966.
The change in tag return rates with time provides a reasonable estimate of the total mortality into Z (plus any emigration rate): 10.7-0.8 in Newman's analysis. Population estimates however depend on evaluating the contribution of fishing mortality rate F to Z. This depends crucially on the initial tagging mortality proportion, and can also be confounded by failure to return tags recovered. Newman's estimates were based on an initial tagging mortality value of 40% reported for the Californian sardine.
Unless initial tagging mortality can be directly established, the tag return method seems capable only of providing an upper limit for stock size (some 10 million tonnes for the SWA/N pilchard over the 1957-1966 period). Z estimates from the change in tag return rate with time (assuming no significant sustained tag-loss/mortality rate) can however provide an independent check on ageing and an upper limit for M.
Historic indices
Two methods have been used in Southern Africa to investigate stock trends prior to the development of commercial fisheries: scales in sediment cores and guano deposits.
a) Scales in Sediment Cores
Thomas (1982) reports on a feasibility study in which an area off Walvis Bay known to have anoxic sediments was sampled. Unfortunately no consistent trends appeared between cores. Thomas concludes that deposition does not proceed regularly enough to provide a stable record, probably due to periodic bottom disturbance.
Nevertheless pilchard scales (90%) were by far the most common in the samples, and there are indications from one long core that anchovy presence may be as recent as 400 years, possibly coinciding with climatic warming at that time. (Anon. 1982).
b) Guano Deposits
Guano deposits on islands and platforms have been shown to correlate with trends in major pelagic stocks off Southern Africa, and are discussed in Crawford et al., (1983). Of particular interest are the indications of substantial stock fluctuations prior to the onset of the fisheries.
The difficulty in using predator indices as estimates of stock size is (similarly to fishing effort) whether the functional relationship, (plausibly monotonic) is linear, and how to separate out multi-species effects. In this case the mechanism is complex as Bergh (1983) has shown that the deposit increase rate is at times much larger than possible for the bird species concerned, and so cannot be a function of bird numbers alone. Nevertheless predator indices are useful in providing at least a qualitative indication of stock trends.
Bergh (1983) shows that using quano deposits at Bird Island, Lamberts Bay on the SA west coast as a measure of pilchard recruitment, and subjecting this to natural and fishing mortality estimates (from VPA), provides a time series of biomass of pilchards of 3 years and older which correlates with guano deposits at Bird Island, Algoa Bay (Fig. 1, 17). This supports the migration theories for the SA stocks referred to earlier (Crawford et al., 1980; Shelton and Hutchings, 1982).
1Assuming no significant change in selectivity over the age range involved.
This suggests that current Bird Island Lamberts Bay deposits might be useful as an anchovy recruitment index, though unfortunately the data would be available after rather than before fishing of the recruits began in a normal fishing season.
Stock definition
Davies (1956) first suggested a connection between pilchards caught off SA and SWA/N speculating that the latter migrated from the Western Cape coast northwards to Walvis Bay. However Newman's (1970b) tag return analysis showed no recoveries in SWA/N of pilchards tagged in SA, and only very few of those tagged off Walvis Bay recovered in SA. Newman concluded independence of the two stocks, and assessment and management has traditionally treated the SA and SWA/N fisheries separately.
However the heavy reliance of the SWA/N fishery (since the 1977 pilchard collapse) on the "anchovy run", which consists almost entirely of 0-year-old fish which appear off Walvis Bay over the May-August period, has emphasised the importance of the origin of these fish.
Recent egg and larval surveys off SWA/N indicate that most of the anchovy spawning takes place to the north of Walvis Bay (Butterworth, 1980; le Clus and Melo, 1982; le Clus, 1982), and that eggs and larvae are carried further north and offshore by the prevailing currents (Badenhorst and Boyd, 1980). If this is the case it is difficult to see how adult anchovy which are fished well to the north of Walvis Bay can parent the mid-year "anchovy run", though transport of larvae southward by an undercurrent beneath the thermocline has been suggested (Anon., 1982).
The very high proportion of 0-year-olds in the "anchovy run" indicates it unlikely that this is an entirely resident self-sustained phenomenon, and the alternative possibility that is a component of the SA anchovy stock has been raised. Badenhorst and Boyd (1980) argued that larval transport from the Western Cape was possible, and Boyd and Hewitson (1983) suggests that larval distributions indicate the anchovy nursery area north of Lamberts Bay (lat. 32°S) extends as far north as Luderitz in SWA/N (lat. 26°30 S).
Little relationship between stock and recruitment is apparent from VPA (Fig. 7d), and unrealistically large F values for 0-year-olds for the SWA/N anchovy may also indicate that the catch is drawn from two stocks. Fishermen tend to support the two stock hypothesis and report that the "anchovy run" shoals move south to join the SA system (Anon., 1983b) Thomas et al., 1982, however monitored shoal-group movement from daily catch positions and found no general southward migration over the period April to July 1978.
Little is known of the anchovy distribution between Lamberts Bay and Luderitz because fishing activity in the area has been minimal. On one occasion (1978/79) acoustic surveys detected what were considered substantial and persistent concentrations in the Orange River vicinity (lat.±28°-29°S), which were subsequently identified as juvenile anchovy (Butterworth, 1980a).
Future hydroacoustics surveys should shed more light on this problem. Electrophoretic work is also in progress; preliminary results based on only a few samples are inconclusive regarding genetic distinguishability of SA and SWA/N anchovy stocks (Grant, pers. comm.). Following apparently poor anchovy recruitment in SWA/N in 1983 (le Clus and Melo, 1983), the 1982/83 egg survey results will be of particular interest. If the SWA/N fishery indeed exploits one anchovy stock only, a low result from the survey would be expected.
The number of anchovy stocks on the Southern African west coast, and the location of their effective dividing lines, remains unresolved. This has management relevance particularly for the SWA/N anchovy, for if the "anchovy run" arises from a small resident parent stock rather than comprising the northern boundary of substantial migration from the south, a more cautious management approach is indicated.
STOCK TRENDS AND FUTURE MANAGEMENT IN THEORY AND PRACTICE
Stock Trends
a) Pilchard
The principal feature of the VPA trend in Fig. 6a is the biomass peak in 1960 resulting from strong year classes from 1956 to 1959. Conventionally the pilchard fishery is seen as having expanded as the stock increased due to these year classes, then crashed as recruitment declined to average-to-poor values in the early 1960's.
The rise in biomass over the late 1950's is consistent with egg production indices (Stander and le Roux, 1968) from 1954-1964, though the area then surveyed was small. Guano deposits on Bird Island, Lamberts Bay (Fig. 17) also indicate the recruitment increment suggested.
On the other hand total guano production was relatively constant over the 1950's (Crawford et al., 1983), but fell markedly marginally in advance of the collapse in the pilchard catch. The VPA uses age data for the 1950's based on samples taken in 1965-1967 (after the collapse) (Fig. 2). It seems possible, in view of density dependent effects referred to previously, that at the higher biomass levels for the 1950's, growth rates would have been slower, so that age has been underestimated. This in turn would result in the VPA producing higher biomass levels for the 1950's.
Thus the biomass rise of the late 1950's may not have been as marked as indicated in Fig. 6a, and the collapse a more classical case of catches rising beyond sustainable yields coupled with poor recruitment leading to a rapid stock decline.
Subsequent to the collapse the stock has shown only one small upsurge following good recruitment in 1973 which was offset by a heavy catch in 1976. Over the past 5 years the stock seems to have declined to a level of only 50 thousand tonnes. The most recent estimates however are very sensitive to the prescription used for current year F estimation. Possible direction of fishing effort away from pilchard in 1982 could result in the procedure used underestimating the biomass present.
b) SA Anchovy
The only information on anchovy abundance prior to the commercial fishery comes from blanket net catches (Stander and le Roux, 1968). These suggest that anchovy substantially increased in abundance compared to pilchard over the decade 1955-1964, though sampling intensity was low particularly in the early years.
The VPA trend (Fig. 6b) suggests a near doubling of anchovy biomass from 1973 following good recruitment that year. This increase could be larger still in that the increase in length at maturity (Shelton and Armstrong, 1983) suggests slower growth rates recently, and hence older ages and larger biomasses for the 1970's. Armstrong (pers. comm.) advises otolith ageing of anchovy for recent years, though not yet considered entirely reliable, does indicate an older age structure for present anchovy catches than does the age length key based on 1965-1967 scales (used for the assessments of this paper), which is consistent with this hypothesis. However the increase in landings to 300 thousand tons over the past 4 years coincides with a decline.
The current estimate depends on how the higher proportion of 0-year-olds in the 1982 catch is interpreted. It could reflect either good recruitment, or little remaining adult stock. The procedure used interprets it as the former, as CPUE has shown no marked decline, but previous discussion of the plots of Figs. 13 and 14 suggests this may not be a very reliable method.
The estimates suggest the anchovy is very heavily exploited at present. However an alternative viewpoint is that the age structure is not a reflection of a large Z through fishing mortality, but rather of a large emigration component (conceivably offshore and/or eastward) beyond the range of the fishery. The perhaps surprising stability of catches is then explained as the catch constituting only a small fraction of a much larger stock. Hopefully future surveys will allow discrimination of the alternatives.
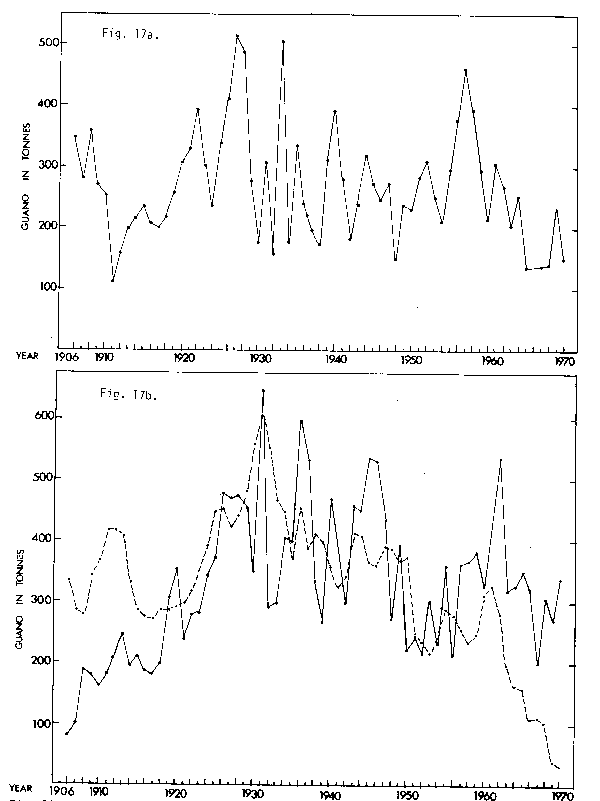
Fig. 17: The annual guano scrapings from a) Bird Island Lamberts Bay, and b) Bird Island Algoa Bay (-----). The predicted biomass of pichard aged 3 years or above calculated using a) as an index of recruitment, is shown in b) (---); units have been renormalised to the mean annual Bird Island Algoa Bay scrapings 1906-1970. The corre;ation coefficient for the two series in b) is +0.35
c) SWA/N Pilchard
As with the SA case, knowledge of the stock trends prior to 1967 is confounded by the absence of ageing material. Though length distribution data is available, density dependent growth rates (see Fig. 9) seem probable and would distort trends if later period age-length keys were used.
Fig. 18a shows the adult pilchard modal length trend which appears a poor indicator of stock health without clear features corresponding to the two stock collapses. Also shown (Fig. 18b) is the trend in mean length (in excess of 21 cm) of fish longer than 21 cm. This always corresponds to the decreasing limb of the length distribution, and conceivably provides a rough index of mean age, and hence exploitation and stock level. This suggests a decline in the stock from the early 1950's, and further reaction to the increasing quotas of the 1960's.
Cram (1981) argues on the basis of CPUE with fleet hold capacity as a measure of effort that the stock was declining from at least 1964. Catch per fuel issue trends (Fig. 12c) also support this conclusion. Newman (1970a) shows that the area over which the fleet operated increased considerably from late 1950's to mid-1960's.
It seems most probable that the stock declined under increasing harvesting intensity in the 1960's from a biomass in the 5-10 million tonne vicinity, to less than 1 million tonnes by 1970. The partial recovery of the early 1970's was largely due to the strong 1972 year-class. Once this had passed through the fishery, followed by poor year classes in 1975 and particularly 1976, the fishery again collapsed under over-intensive harvesting.
Subsequent to this the average age of the catch has dropped even further (Fig. 18a), with fish over 3 years of age now seldom encountered (Fig. 19). (The contrary trend in Fig. 18b may arise through faster growth rate both from density dependent factors, and higher temperatures in the northern areas where adult pilchard are now caught.)
Though an upsurge in recruitment permitted a minor recovery in 1980/1981, indications of poor recruitment for 1982 (Thomas, 1983) together with comparatively large catches in 1981 and 1982 suggest the stock is back at a very low level (Fig. 6c).
The precise value is again very sensitive to the dubiously reliable procedure for current year F estimation. Paradoxically if pilchard dumping is continuing this could mean that the stock level is actually greater than that calculated through placing an underestimate of the true catch in the VPA. (For such an effect the proportion of the catch dumped would have to have increased to affect trends.)
Both pilchard stocks seem nevertheless to be in a predator pit situation with the fishery industry the predator. Any burst of good recruitment is rapidly countered by increased landings, and the piggy-back effect of a series of good year-classes that could lead to significant stock recovery never given the chance to develop. Unless effort on the pilchard can be substantially reduced, both stocks seem destined to produce roller-coaster-like biomass trends following the footsteps of the Californian sardine, conceivably to extinction.
d) SWA/N Anchovy
The biomass trend of Fig. 6d for the SWA/N anchovy is critically dependent on the assumption of a single SWA/N anchovy stock. Almost certainly the pre-1972 trend is spurious, being based on unrepresentative samples for length distribution.
Be that as it may, there is a general downward trend over the past five years, and caution seems indicated particularly following the 1982 recruitment failure (le Clus and Melo, 1983).
e) Stock-recruit relationships
These are given in Fig. 7. The "environmental" fluctuations may be represented by a parameter alpha, where
Ry = alpha y (Sy)
(Sy)
Ry = recruitment in year y
Sy = spawning stock
= stock-recruit relationship
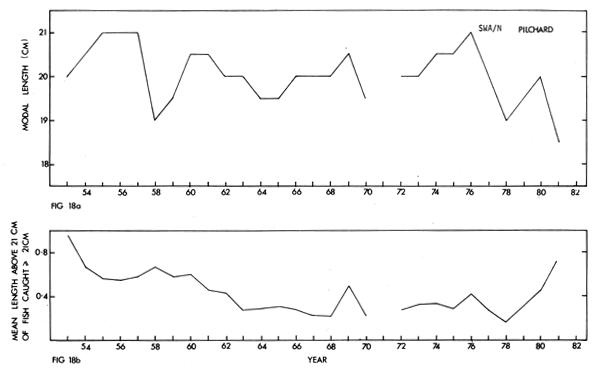
Fig. 18. Trend in (a) adult model length, and
(b) mean length above 21 cm of fish exceeding 21 cm in length in the
SWA/N pichard catch.
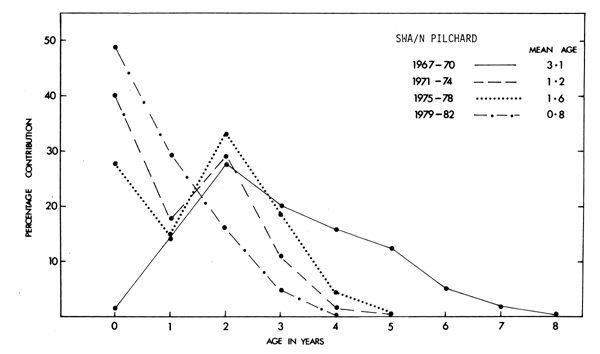
Fig. 19. Average age composition (by number) of the SWA/N pichard catch over 4-year periods from 1967-1982
Table 7 gives values for the mean 1-αy relative deviation and serial correlation for the αy time series for each stock, which is shown in Fig. 20. Interesting features are that both are much higher for pilchard than anchovy, indicating (but not fundamentally explaining) greater anchovy stock stability. Considering the potential for fluctuation through the egg-larval stages, it is perhaps surprising that the mean relative deviation for anchovy is as low as 20%.
A further point of interest is whether the adult density dependent mechanisms noted previously can entirely account for the convexity of the stock recruit plots obviating the need for compensatory mechanisms at the egg and larval level. Recent calculations of phytoplankton production off the Western Cape (Shannon and Henry, 1983) based on satellite measurements are consistent with the observations of adult density dependence in that they imply food availability may be limiting.
A Possible Basis For Future Management Recommendations
a) Sustainable yield estimates
Empirical production models using catch and effort data would seem of dubious value, primarily because of the difficulties with effort discussed earlier. Allowance for time dependence and skewness of the yield curve introduces further problems.
Rather, analytic models such as the Beverton-Holt yield per recruit approach appear more useful. However the likelihood of diminished recruitment should the parent stock be decreased must be taken into account. This may be effected by incorporating a stock-recruit curve (which is a best fit to the estimates of spawning stock and recruitment from VPA) into the Beverton-Holt analysis (Getz, 19).
In fitting, say, Ricker or Beverton-Holt equations to the data, one is not suggesting that only the particular mechanisms from which these functional forms are derived are the ones actually dominant. Rather the forms are empirically plausible (which means that the empiricism of catch-effort production models is not avoided but reappears at another level). Nevertheless identification of the mechanisms causing the convexity (density-dependence) of the curve is important for selecting the most appropriate minimization criterion for the best fit.
On the stock-recruit plot for the SA anchovy (Fig. 7b) a replacement line has also been drawn, corresponding to the recruitment required at a particular spawning biomass level to maintain the stock at that level in the absence of exploitation. The sustainable yield is then given by the difference between stock-recruit and replacement lines, apart from adjustments arising from lowering the average fish mass as the exploitation level rises.
Fig. 21 shows the result of such calculations for the SA anchovy, with sustainable yield plotted as a function of mid-year biomass. Age-specific selectivities from VPA fishing mortality estimates have been used in the calculations, with results shown for both Beverton-Holt and Ricker stock-recruit fits.
The variation of the associated MSY estimate with natural mortality is shown in Fig. 22. (The VPA is first carried out with the alternative M, leading to an amended stock-recruit relationship.) Interestingly the MSY calculated appears relatively insensitive to M between 0.8-1.3, the range considered possible.
Deterministic projections under various harvesting strategies are possible using this approach. The results for some fixed quota policies are indicated in Fig. 23.
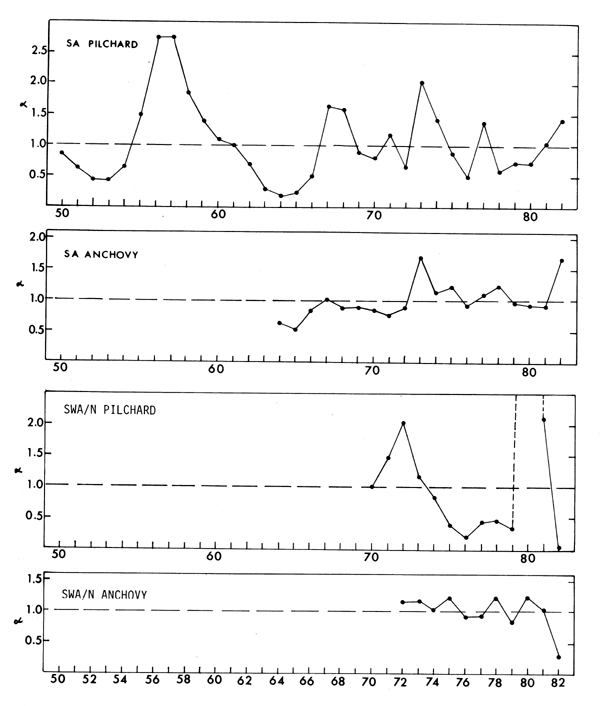
Fig. 20. Plots of alpha = R/ (see text) where is as pridicated by the Beverton-Holt
stock-recruit fit to data for the stock concerned.
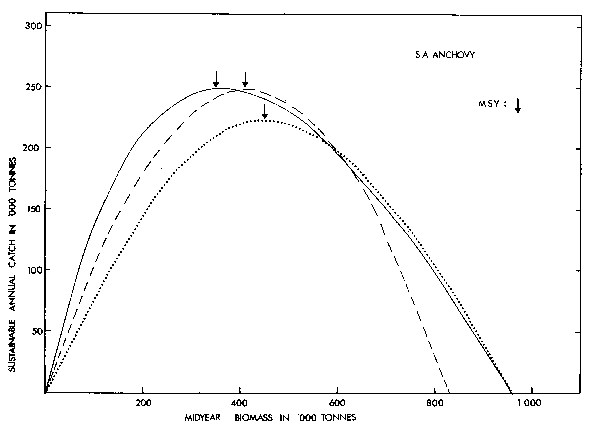
Fig. 21. Sustainable annual yield as a function of mid-year biomass for the SA anchovy. Curves shown are for the standard (January-August) season for Beverton-Holt (-----) and Ricker (---) fits to the stock-recruit plots, and for the new (mid-October-March) season using the Beverton-Holt fit (....). All calculations take M=1.1.
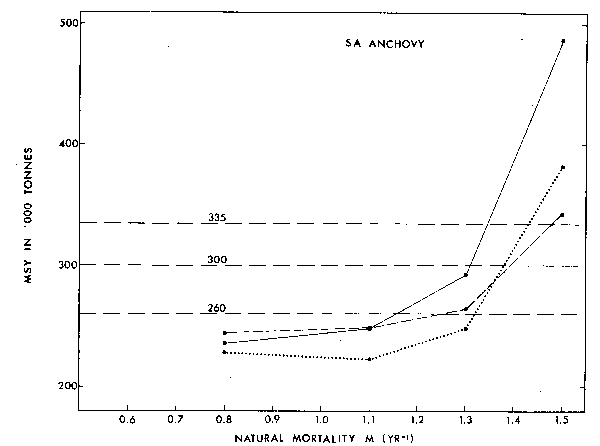
Fig. 22. Estimates of MSY as a function of natural mortality M for the SA anchony. Conventions as for Fig. 21. Note evaluaations have been carried out only at M=0.8/ 1.1, 1.3, and 1.5; the adjoining straight lines are to guide the eye only.
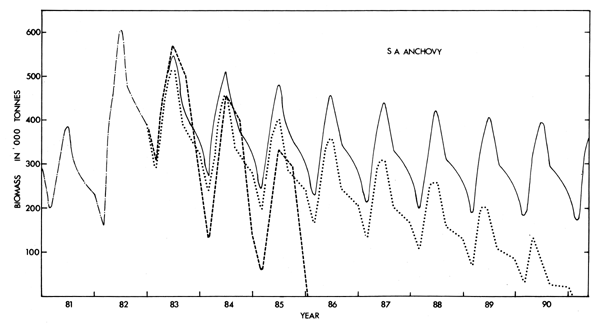
Fig. 23. Deterministic projections of the SA anchovy biomass from the calculated by VPA for 1982 (-----) for various harvesting strategies. A Beverton-Holt fit to the stock-recruit curve has been used. All policies are constant annual quotas of 260 thousands tonnes (---) and 300 thousand tonnes (...) for the standard (January-August) season, and of 335 thousand tonnes (xxxx) for the new (mid-October-March) season, preseded by a 160 thousand tonnes catch for the first half of 1983
b) Incorporating the effects of fluctuations
An MSY estimate alone is not sufficient basis for the management of a pelagic fishery. The production curves of Fig. 21 are only a representation of the situation "on average". Considerable residual variance is evident in the stock recruit plots of Fig. 7 (see Table 7), and at any particular time more than the indicated sustainable yield can be taken if good recruitment (i.e. better than predicted by the stock-recruit plot) occurs and vice versa.
There may be little warning of downward stock fluctuations as if evident from the following examples:
(i) SWA/N pilchard recollapse: Table 8 (from Butterworth, 1980) shows the trends of various current biomass indices for this stock that were available or could have been calculated during the mid-1970's. Only by the beginning of 1978, with the collapse irreversible, were indices universally negative. The catch-statistics based indices show some negative features at the start of 1976, but by then an enormous quota reduction would have been required to counter the effects of both previous years' catches that had risen too high, and poor recruitment in 1975, which was to be followed by poorer recruitment still in 1976. Noticeable is the delayed response of CPUE to the decline, and the problem of increased modal length reflecting poor recruitment rather than a decline in fishing intensity.
| Beginning of year | 1974 | 1975 | 1976 | 1977 | 1978 |
|---|---|---|---|---|---|
| VPA Catch-statistics based | +2 | 0 | -2 | -1 | -2 |
| CPUE | +1 | +2 | -1 | 0 | -2 |
| Modal length | 0 | +1 | 0 | +1 | -2 |
| Aeria) Direct | +1 | - | - | -2 | - |
| Egg ) | +2 | - | - | -2 | - |
| Yearclass strength) 1975 | - | (0) | -1 | 0 | -2 |
| Compared to average ) | - | - | (0) | -2 | -2 |
| Actual biomass | 0 | -1 | -2 | -2 | -2 |
| Historric quota ) pre-season | +20% | +0% | +0% | -47% | -38% |
| Decision ) mid-season | -20% | -58% | -77% | ||
| Quota reduction required for | -42% | 61% | 78% | not | not |
| 1,000,000-tonne 1979 bisomass | possible | possible |
The convention used, +2/+1/0/-1/-2, corresponds to strongly increasing/increasing steady/decreasing/strongly decreasing.
(ii) SWA/N anchovy recruitment failure: Consider the trends evident prior to the 1982 season. Increasing CPUE is shown in Fig. 12d, and increasing egg production in Fig. 15b (VPA also showed an increase at that time, but through the current year F selection procedure, was primarily a reflection of the CPUE increase). In 1982 recruitment failed (Fig. 7d), and only 38% of a 220 thousand tonne quota was landed.
Some idea of the effects of fluctuations about the stock-recruitment plot is given in Fig. 24. The anchovy biomass is projected from that presently assessed for 1983 by VPA, for 20 and 100 year periods. For each future year the "environmental" parametera, which multiplies the recruitment predicted from the stock-recruit curve, is chosen at random from the set of a values assessed from VPA for the 1964-1982 period. The plots show the probability of "extinction" over projection periods under a constant quota policy; "extinction" is defined as the stock becoming too depleted to be capable of delivering the chosen fixed quota in a year.
It is noticeable that for the longer 100 year period, "extinction" occurs with certainty for quotas less than the deterministic MSY. The serial correlation in recruitment, which has yet to be taken into account in such simulation, would exacerbate this effect. This emphasizes the necessity for a strategy that reduces catches during periods of low biomass whether environmentally and/or fishery induced.
It is planned to use such simulation models to investigate more flexible harvesting strategies. For example, what is the maximum average yield that could be obtained at some acceptably small probability of stock "extinction", given exact knowledge of current biomass and the forthcoming season's recruitment, plus the Industry's preference that the quota not be amended by more than 15% (up or down) in any one year for logistic reasons (Anon., 1982). By taking better advantage of the extra yield available in years of good recruitment such average yield would be an improvement on the fixed quota for corresponding circumstances.
Such exact knowledge would never be obtainable. Example (i) above points to the problems with current biomass estimation, particularly the possible delayed response or decline underestimation of some methods. Further, for anchovy, the year's recruitment constitutes a major proportion of the catch so that a pre-fishing estimate is desirable.
Hydroacoustics surveys appear to offer the best prospects for both these measures. In principle it is preferable to census directly, rather than indirectly (e.g. egg surveys) where trends may be confounded by a changing relationship between the fish and the indicator being measured (perhaps due to density dependent effects).
However the accuracy with which such surveys can provide stock and recruitment values (whether relative or absolute) also requires evaluation. The larger the variance on these estimates, the less the difference between the comparable constant and variable quota prescriptions described above would become. One needs to know at what stage the extra costs of more intensive surveys to decrease variance, would exceed the benefits of improved resource utilisation achieved through more accurate information.
Although conceptually attractive, hydroacoustic surveys in Southern Africa need to show they can pass this test better than other indices of stock size and recruitment (also with their associated variances) that could be used. More significantly in practical terms, are results from such surveys going to be sufficient to convince decision makers?
The ultimate objective of research is an ability to predict the fluctuations (a values : Fig. 20) on the basis of environmental monitoring. If sufficient quantitative accuracy is obtainable this could in principle replace the far more expensive hydroacoustic surveys (which would provide the initial calibration). However, in this respect little success has been achieved thus far, though Boyd (1979) has reported a negative correlation of the SWA/N anchovy recruitment with temperature variability.
Economic factors also need to be taken into account in choosing an optimal harvesting strategy, but little work in this regard has been carried out to date. For example, a lesser tonnage of fish caught during a time of year when oil-yield is higher might be financially advantageous.
The comments above have been based entirely on a single species approach. Species interaction effects may well be significant, but will be difficult to model quantitatively. If adult food availability is indeed the primary limiting factor on the anchovy population, it will be difficult to believe that the presence of anchovy is not inhibiting possible pilchard recovery to some extent. Management recommendations may then have to take this into account. Albeit quantitatively in the first instance.
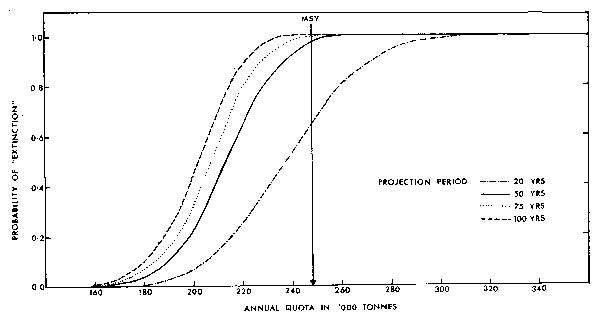
Fig. 24. Probability of "extinction" (see text) of the SA anchovy stock under standerd season constant quota policies applied for 20 and 50 year periods from 1982. The projection commences with the VPA biomass and age structure of the population in 1982 and incorporates fluctuations about the deterministic Beverton-Holt fit to the stock-recruit relation (see text)
Current management initiatives
The 1983 SWA/N pilchard quota has been set at 35 thousand tonnes to be taken with 28 mm nets from 13th March to 31st May, and constitutes a 5 thousand tonne increase compared to 1982. Pilchards caught after 31st May count towards an anchovy quota of 200 thousand tonnes (compared to 220 thousand tonnes in 1982) (Anon., 1983a).
Following recruitment failures in 1982, Thomas (1983) comments on pilchard: "any fishing on adult should therefore be banned in 1983, otherwise the stock will almost certainly be wiped out for good", while le Clus and Melo (1983) state in respect of anchovy that: "the initial quota should be very low and restraint...exercised".
The quota decisions, contrasting sharply with the statement of a recent Parliamentary Commission of Inquiry (Anon., 1980) that "the Commission wishes to reaffirm its belief that the exploitation level should be determined on scientific data only", can only be considered disappointing and unwise. A further disappointing feature is that the policy of a low initial quota for anchovy, which may be revised (probably raised) when results of the summer egg survey become available, has apparently been discarded; in principle although subsequent downward quota adjustment could be made should the survey results be poor, in reality this would be extremely difficult to achieve.
In SA, the scientific recommendation for a global quota reduction from 380 to 325 thousand tonnes for 1983 has again been rejected. Instead the Deputy Minister responsible has introduced an entirely new plan. The season that opened on 1st January will close on 30th June with a quota of 190 thousand tonnes applying to pilchard and anchovy only. Thereafter the season is to be changed to the summer months (15th October to 31st March) with a quota of 380 thousand tonnes for pilchard and anchovy only. The "split" quota is intended to encourage diversification of effort to other species.
The decision is apparently based on theories developed by Lochner (1980). Essentially Lochner's recommendations rest on three conclusions (derived by analogy from an electric circuit model): the peak spawning period for pelagic fish in October, pelagic fish spawn effectively only once, and pilchards and anchovy join commercially catchable shoals at ages of 1.35 years and 6 months respectively. On this basis fish caught during summer months have already effectively made their one and only contribution to future stocks and so may be removed without endangering the population. Various authors (1980) assert that the three conclusions indicated are all at variance with observational evidence.
A production curve corresponding to this summer fishing season is shown in Fig. 21 The resultant MSY is some 10% lower than for the standard January-August season: this occurs essentially because losses of juvenile anchovy to natural mortality over the winter months more than offset the gains in individual fish mass and spawning biomass by delaying exploitation. The deterministic projections shown in Fig. 23 correspond to a standard season 325 thousand tonne global quota (anchovy 260 thousand tonnes: past scientific recommendation), a standard season 380 thousand tonne global quota (anchovy 300 thousand tonnes: previous situation), and the new policy corresponding in due course to a 335 thousand tonne summer anchovy catch (i.e. assuming the relative species composition of the catch of the last few years remains unchanged). The projections indicate that though the lower anchovy catch for the first half of 1983 provides a temporary respite for the stock, this benefit is rapidly destroyed by the subsequent higher catch and lower sustainable yield available over the summer months.
The Deputy Minister concerned has recently announced that a scientific committee will be appointed to further consider the new proposals.
ECONOMIC ASPECTS
The SA pelagic fishery has seen a major change in species composition; the SWA/N fishery has experienced both this and large fluctuations in total landings. How have the fishing companies been able to adapt to these changed circumstances?
Fig. 3 shows the trend in the number of vessels and the total fleet hold capacity operative in the two fisheries; the move to larger vessels is clear from the plots. In SA fleet hold capacity continued to rise in spite of the pilchard decline of the early 1960's; limitation was problematic to justify in the absence of estimates of the potential yield of the stocks. In any case a Boat Limitation Committee's advice was not accepted by the authorities on a number of occasions (Anon., 1971).
The only real decrease in SA hold capacity coincides with the 1975 decision to allocate specific quotas among the individual processors, removing the incentive for the individual to have maximal efforts available to grab the largest possible slice of the global quota in a free-for-all situation.
Nevertheless the decrease in hold capacity following this was only some 15%, with considerable surplus effort still available. The reasons for this are probably psychological: first, the additional cost of maintaining the surplus effort already available is relatively low, and secondly the processor wants to avoid the embarassment of failing to achieve his quota in years of poor availability, while maintaining pressure for increased quotas (knowing that effort is available to achieve such increased quotas should they be granted).
Fig. 25 shows trends in meal, oil and canned fish production from the fishery. The major features are the peak in oil production corresponding to the peak pilchard catches of the early 1960's, and the fall-off in canning production with the pilchard (and horse mackerel) collapses. Mean production was relatively unaffected over this period.
Many of the companies operative in SA were also active in the SWA/N fishery, and it seems probable that the losses involved, particularly in the decline in the profitable canning production in SA, were offset by moving vessels and plant machinery during the mid-1960's to Walvis Bay where pilchard catches were increasing. Plots of number of vessels in Fig. 3 are not entirely consistent with this hypothesis, but may be confounded by vessles operating in both fisheries in the same year.
Pilchard canning production in SWA/N is indicated in Fig. 26. Though landings declined substantially from 1968 to 1971, only in 1971 was there any noticeable drop in the trend of increased canning production. Fig. 3b also indicates the initial pilchard collapse served only as a temporary brake on the increase of hold capacity. (Unlike SA, individual quotas were allocated to processors in SWA/N from the start of the fishery.)
With canned pilchard the industry's most profitable product, one may surmise that the impact on the industry of the initial pilchard collapse was by no means as severe as the actual decline in landings.
Aided by increasing efficiency, pilchard canning reached record levels in 1975, but by 1978 had dropped by 90% to cause the industry severe problems. With this second pilchard collapse came, eventually, a reaction to the surplus effort in the fleet (Fig.3b)
The impact on the companies has probably been reduced by a number of factors. Towards the end of the 1970's many invested in fishing operations in Chile (including transfer of machinery) (Anon., 1981a, Anon., 1981b); a canning plant was opened recently at Gansbaai (SA) with machinery from SWA/N. Usage of meal plants and canneries was rationalised. As only RSW vessels (owned by the factories) were permitted to catch pilchard, private boat owners who contract to the companies suffered more in proportion. In a period of high interest rates, large cash holdings proved a profitable alternative investment.
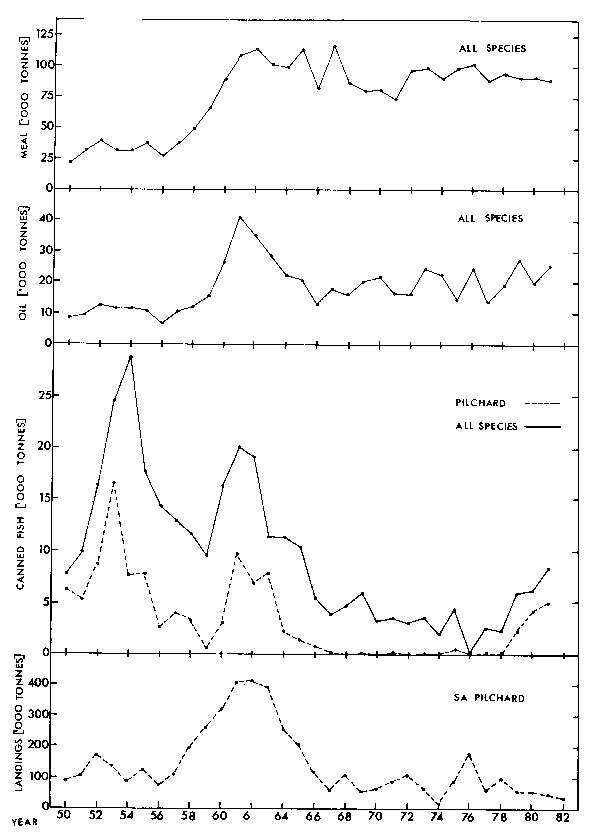
Fig. 25. Annual production of fish meal, oil and canned products from the SA pelagic fishery 1950-1981. Pilchard landings over this period are shown for comparison of trends.
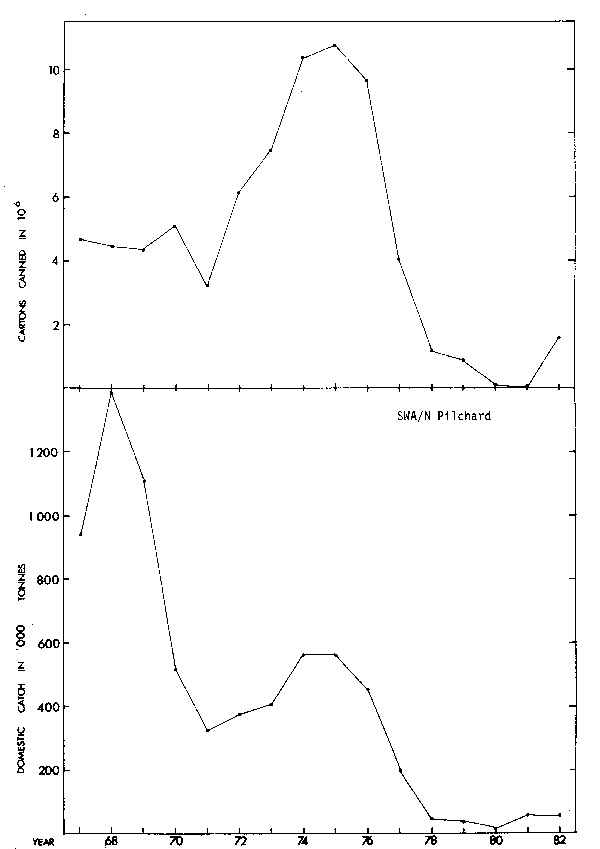
Fig. 26. Annual production of canned pilchard from the SWA/N pelagic fishery compared to domestic landings of pichard. The canning tred should be considered as indicative rather than precise, as the "carton" unit varies dependent on the type of can, but is roughly equivalent to 10 kg of fish. (Data:Anon., 1983c)
Nevertheless, squeezed between rising costs (principally fuel), and the long term fall in the real price of fish meal on the domestic market through price control, the SWA/N industry incurred a cash loss on meal production in 1982, and also a net negative energy yield (fish oil vs fuel) (Bross, pers. comm.).
These circumstances must lead to unhealthy pressure for continued pilchard quotas to maintain canning from an increasingly fragile stock.
MAJOR LESSONS OF THE SOUTHERN AFRICAN PELAGIC FISHERIES
Ageing
Ageing is a cornerstone in fisheries assessments: to correctly determine stock trends, to calculate sustainable yields, and to identify years of good and bad recruitment. Regular and accurate ageing of samples from landings is essential. Density dependent responses and spatial differences in growth rates may well mask actual stock trends if length distributions alone are considered.
Survey
Survery assessment methods are essential in spite of their higher costs. The accurate assessment of the current biomass level is most important for pelagic stocks, in particular for the timely detection of declines to allow the opportunity for adequate remedial management response. With anchovy landings heavily dependent on the current year's recruitment, early recruitment indices are also required, and hydroacoustic surveys appear the best method to obtain these.
Indications based on catch statistics have shown delayed response to stock declines, and need to be supplemented by other methods independent of the possible biases of samples from the fishery. Further, if malpractices are taking place, the Fishing Industry is aware that assessments from catch statistics are based on erroneous data; in such circumstances the trends produced by assessments may still have validity, although Industry representatives, aware of the questionable nature of the data, feel justified in opposing scientific recommendations. Consequently the results of independent survey enjoy greater respect.
Regulation
Regulations must be enforcible, and should therefore be kept simple. Restrictions based on effort limitation alone would be inadequate: effort is difficult to define, and seems poorly related to fishing mortality F. Effort limitation may however have a role to play in eliminating the potential for malpractices.
Individually allocated quotas appear the best solution, and seem to be able to limit overcapitalisation to a certain extent. Although individual species quotas are biologically desirable, they could encourage malpractices such as dumping and species misidentification. Global quotas therefore seem more realistic measures.
The protection of the more heavily depleted species can be assisted by temporary closure of certain areas. This measure is more easily enforcible in SWA/N where all vessels operate from a single harbour; all vessels are thus equally disadvantaged and more readily policed. In SA, with 6 widely spread harbours, the situation is more problematic.
The actual benefit the stocks derive from the "day-to-day" monitoring and regulation of the fishery that such a scheme implies may not be substantial. Nevertheless there is the psychological advantage of positive reaction of the Fishing Industry to research being seen to be done. Although many fishermen prefer to believe that the fish have temporarily "gone somewhere else" rather than that fishing has depleted the stock, they do appreciate the undesirability of catching fish that are too small (the yield per recruit concept), and respond more positively to restrictions on this score.
The Decision Making Process
The history of the Southern African pelagic fisheries shows quite clearly that conservation measures have been adopted only once evidence of stock depletion had become overwhelming. Regarding SWA/N, Troadec et al. (1980) comment that this delayed action tended to amplify the natural fluctuations in stock size, and increased the risk of collapse.
Cram (1981) argues that had the SWA/N aerial surveys continued in 1975 and 1976, earlier detection of the pilchard stock decline would have occurred, and consequently quotas could have been reduced at an earlier date. The first of his conclusions is more readily accepted than the second. The Fishing Industry acceeded to proposed quota increases while surveys indicated stock increments; one suspects they might have been somewhat more reluctant in the reverse situation.
The Industry intuitively bases its appraisals of the situation on the index to which it is sensitive, i.e. catch rate; problems occur because CPUE is not a reliable indicator. In particular, larger selectivities for older fish, or increase in catchability q as biomass declines, means that CPUE may lag or underestimate stock declines; there is some evidence that both these effects have occurred in Southern African fisheries.
Accordingly, given the heavy representation of the Fishing Industry on the Fisheries Advisory Councils, the delay in management reaction is not surprising. Anon. (1980) notes "In the past, higher quotas than those recommended by the Director of Sea Fisheries were often granted".
In these circumstances scientists have been forced to play a protectionist role, and, under-represented on such advisory bodies, they have been able only to delay rather than prevent the over-exploitation of a number of resources.
The great need is for a counter-weight to overoptimistic industrial pressure in the decision making process. Given such a lobby, resource evaluation scientists could revert to their proper role as indifferent advisers for rational long-term resource utilization. In this way such scientists would be seen as holding a central rather than an extreme viewpoint in the process of compromise the politician in ultimate authority has to achieve.
What group can provide such a counter-weight role? The conservationist lobby is one possibility. A recent Parliamentary Commission of Inquiry appears to have thought along these lines in recommending replacement of the Fisheries Advisory Council by a body including three representatives from conservation organisations (Anon., 1980). This led to the Advisory Council's composition being amended to include more scientific representatives and the Director of Nature Conservation in the Cape, though representatives associated with Fishing Industry remain in the majority. It is too early to judge whether this change is having any impact.
Another possible contender for the counter-weight role is the media. Press comment on the difference between the SA global quota allocation of 380 thousand tonnes and scientific recommendations of 325 thousand tonnes (Ferreira, 1982), led to the then responsible Minister having to explain his decision in response to questions from the Opposition during the Parliamentary session (Anon., 1982a). There may well be valid reasons that justify exceeding quotas scientifically recommended in the short term, but it is important in these situations that such decisions are clearly rationalised.
The concept of the scientific viewpoint appearing as an equilibrium of industry and conservationist extremes is appealing. Equilibria however are not necessarily stable. The current situation in the International Whaling Commission could be argued as an example of such instability, though "ethical" considerations are of greater significance there.
Scientists also need to critically review their own record, to evaluate why their management impact has not been greater. The business of fisheries scientists (in a management context) is quantitative prediction, but the development of such methods in Southern Africa has been slow (the first estimates of sustainable yields appeared only in the 1970's).
Qualitative advice recommending "caution" without associated quantification is inadequate. When a resource eventually experiences problems in such circumstances, there is little real justification in claiming an inevitable certainty as a prediction fulfilled because advice was not heeded.
The nature of fisheries assessment is such that the best predictions possible may prove inaccurate (perhaps substantially so); but that is neither a reason to avoid making them, nor necessarily one for censure after the event. To adopt an approach so cautious that things cannot possibly go wrong is to waste the resource, and is an attitude the Fishing Industry has some justification in opposing.
The scientist's classical training emphasises that conclusions must be backed by a full discussion and justification (as far as possible) of the assumptions from which they were derived. This is not necessarily the best way to present arguments to decision makers who have no scientific training, as such presentations can give the impression of inconclusiveness.
Having judged the appropriateness of the alternative sets of assumptions they need to produce a "best" estimate or prediction (albeit one not fully justified in the strict scientific sense), scientists should then present precise recommendations to higher authority. 2 Unfortunately however, scientists sometimes avoid such judgements, effectively abrogating their responsibilities to such authorities who are less well placed to make the evaluation.
Fisheries science in Southern Africa needs to focus further on quantitative prediction (albeit prediction in a probabilistic sense) if it is to influence and benefit the Fishing Industry more effectively.
A first step (MacCall) in Anon., 1982) in the pelagic area should be the development of an explicit predetermined contingency plan for years of poor anchovy recruitment.
ACKNOWLEDGEMENTS
This paper could not have been written without the assistance of many people. The author wishes to acknowledge a combination of consultations, comments on sections of the manuscript, and permission to use data from Kobus Agenbag, Mike Armstrong, Alan Boyd, Rob Crawford, Stewart Grant, Ian Hampton, Francis le Clus, Fritz Schulein, Vere Shannon, Peter Shelton, Rod Thomas (all of the SA Sea Fisheries Research Institute), Mike Bergh (Benguela Ecology Programme, UCT), and Michael Stuttaford (SA Shipping News and Fishing Industry Review). Unless otherwise indicated, data used in this paper is drawn from previous reviews listed under the references, or has been provided by the SA Sea Fisheries Research Institute.
Roy Bross (Fisheries Development Cooperation) provided most of the ideas and information for the section on economic aspects.
Trish Andrew and Janie Eales (funded through the Benguela Ecology Programme, SANCOR, CSIR) assisted with programming, computations, and preparation of the manuscript.
Finally, the author wishes to acknowledge the impact of David Cram on his views. Cram ("if you want to know how many fish there are, go out and count them") had the foresight to first press the development of the quantitative survey techniques now recognized as essential for the management of Southern African pelagic fisheries.
2 These should take the form of the range of harvesting options and associated quantitative consequences for the stock, that the chosen model produces. The choice between such options goes beyond the purely scientific domain.
REFERENCES
Agenbag, J.J. 1982. A note on anchovy shoal behaviour and stock size estimation through aerial observations. Workshop on the fluctuations assessment and management of anchovy populations, August, 1982, Cape Town, Document number 36 (unpublished).
Anon. 1971. Report of the Commision of Enquiry into the fishing undustry. The Government Printer, Pretoria, South Africa, RP 47/1972, 1971.
Anon. 1980. Report of The Commission of Equiry into certain aspects of the conservation and utilisation of the living marine resources of the Republic of South Africa. The Government Printer, Pretoria, South Africa, RP 93/1980.
1981a. Eldorado's Sardinellas, Financial Mail. 79(9):852-854.
1981b. Gone to Chile. Financial Mail. 80(13):1545-1546.
1982. Preliminary report of the workshop on the fluctuations, assessment and mananagement of anchovy populations. August 1982, Cape Town (unpublished).
1982a. House of Assembly Debates (Hansard), Republic of South Africa. 18:1049-1050.
1938a. WB pilchard quota 35 000 tons. Shipp.News Fish.Ind.Rev.S.A. 28(1):25.
1983b. Anchovy shoaling, migration as seen by fishermen. Shipp.News Fish.Ind.Rev. S.A. 38(2):18-23.
1983c. SA Fishing Industry Handbook 1982/83. 16th edition: 40.
Badenhorst, A. and A.J. Boyd. 1980. Distributional ecology of the larvae and juveniles of the anchovy Enqraulis capensis Gilchrist in relation to the hydrological environment off South West Africa. 1978-79. Fish.Bull.S.Afr. 13:83-106.
Bergh, M.O. 1983. M.Sc.Thesis, University of Cape Town (in preparation).
Boyd, A.J. and J.D. Hewitson. 1983. Distribution of anchovy larvae off the West coast of Southern Africa between 32°30' and 26°30'S, 1979-1982. (in press).
Butterworth, D.S. 1980. The value of catch-statistics based management techniques for heavily fished pelagic stocks, with special reference to the recent decline of the Southwest African pilchard stock. Colln.scient.Pap.int.Commn.SE.Atl.Fish. 7:69-84.
Butterworth, D.S. 1980a. Assessments of the anchovy population in ICSEAF Divisions 1.3, 1.4 and 1.5: 1968-1979. Colln.scient.int.Commn.SE.Atl.Fish. 7:39-52.
Cram, D.L. 1977. Research and management in Southeast Atlantic pelagic fisheries. Rep.Calif. coop.oceanic Fish.Invest. 19:33-62.
Cram, D.L. 1981. Hidden elements in the development and implementation of marine resource conservation policy: the case of the South West African/Namibian Fisheries. pp. 1327-156. In Resource management and environmental uncertainty: lessons from coastal upwelling fisheries (M.H. Glantz and J. Dana Thompson, eds.). Wiley, New York.
Cram, D.L. and J.J. Agenbag. 1974. Cape Cross Program. Phase IV Report. Int.Rep.Sea Fish.Branch S.Afr.
Cram., D.L. and I. Hampton. 1976. A proposed aerial/acoustic strategy for pelagic fish stock assessment. J.Cons.int.Explor.Mer. 37(1):91-97.
Crawford, R.J.M. 1979. Implications of recruitment, distribution and availability of stocks for management of South Africa's Western Cape purse-seine fishery. Ph.D. thesis, University of Cape Town: 467 pp.
Crawford, R.J.M. 1981a. Distribution availablity and movements of pilchard Sardinops ocellata off South Africa 1964-1976. Fish.Bull.S.Afr. 14:1-46.
Crawford, R.J.M 1981b. Distribution, availability and movements of anchovy Enqraulis capensis off South Africa. 1964-1976. Fish.Bull.S.Afr. 14:51-94.
Crawford, R.J.M 1981c. Catch per standard-boat-day and deployment of effort in the South African purse-seine fishery. 1964-1976. Investl.Rep.Div.Sea Fish.S.Afr. 122:1-24.
Crawford, R.J.M., P.A. Shelton and L. Hutchings. 1980. Implications of availability, distribution and movements of pilchard (Sardinops ocellata) and anchovy (Engraulis capensis) for assessment and management of the South African purse-seine fishery. Rapp.p.-v.Réun.Cons.int.Explor.Mer. 177:355-373.
Crawford, R.J.M., P.A. Shelton and L. Hutchings. (This volume). Aspects of variability of some neritic stocks in the Southern Benguela system.
Davies, D.H. 1956. The South African pilchard (Sardinops ocellata). Migration 1950-1955. Investl.Rep.Div.Fish.S.Afr. 24:1-52.
Davies, S.L., G.G. Newman and P.A. Shelton. 1981. A review of the South African multispecies pelagic fishery in ICSEAF Division 1.6 in 1980. Colln.scient.Pap.int.Commn.SE.Atl.Fish. 8:51- 74.
Eales, M.H. 1982. Initial estimates of annual anchovy consumption by natural predators off Southern Africa. Workshop on the fluctuations, assessment and management of anchovy populations. August 1982, Cape Town, Document number 28 (unpublished).
Ferreira, G. 1982. Threat of fishing collapse. Cape Argus. May 18th:l.
Getz, W.M. 1980. Harvesting models and stock recruitment curves in fisheries management. pp. 284-304. In Mathematical Modelling in Biology and Ecology (W.M. Getz, end).). Springer-Verlag, New York.
Hampton, I. 1982. Hydroacoustic investigation of the behaviour, distribution and abundance of Engraulis capensis. Workshop on the fluctuations, assessment and management of anchovy populations. August 1982. Cape Town, Document number 33 (unpublished).
Hampton, I., D.L. Cram and J.J. Agenbag. 1979. Feasibility of assessing the size of the South West African pilchard stock stock by combined aerial and acoustic measurements. Fish.Bull.S.A. Afr. 11:10- 22.
Le Clus, F. 1982. Observations on the egg production of pilchard and anchovy off South West Africa: 1981/82. Int.Rep.Sea Fisheries Research Institute SA (unpublished).
Le Clus, F. and Y.C. Melo. 1981. An assessment of the anchovy population in ICSEAF Divisions 1.3, 1.4, and 1.5 in 1980. Colln.scient.Pap.Commn.SE.Atl.Fish. 8:121-145.
Le Clus, F. and Y.C. Melo. 1982. Assessment of the 1981 anchovy population in ICSEAF Divisions 1.3, 1.4 and 1.5. Colln.scient.Pap.int.Commn.SE.Atl.Fish. 9:147-161.
Le Clus, F. and Y.C. Melo. 1983. Virtual population analysis of the anchovy stock off South West Africa: 1972-1982. Colln.scient.Pap.Commn.SE.Atl.Fish. 10: in press.
Le Clus, F. and R.M. Thomas. 1981. An assessment of the pilchard population in ICSEAF Divisions 1.3,1.4 and 1.5 in 1980. Colln.scient.Pap.int.Commn.SE.CAtl.Fish. 8:103-119.
Le Clus, F. and R.M. Thomas. 1982. Assesment of the 1981 pilchard population in ICSEAF Division 1.3, 1.4 and 1.5 Colln.scient.Pap.int.Commn.SE.Atl.Fish. 9:163-176.
Lochner, J.P.A. 1980. The control of a pelagic fish resource. S.Afr.J.Sci. 76:15-25.
Newman, G.G. 1970a. Stock assessment of the pilchard Sardinops ocellata at Walvis Bay, South West Africa. Investl.Rep.Div.Sea Fish.S.Afr. 85:1-13.
Newman, G.G. 1970b. Migration of the pilchard Sardinops ocellata in Southern Africa. Investl.Rep. Div.Sea Fish.S.Afr. 86:1-6.
Newman, G.G. and R.J.M. Crawford. 1980. Population biology and management of mixed-species pelagic stocks off South Africa. Rapp.P.-v.Reun.Cons.int.Explor.Mer. 177:279-291.
Newman, G.G., R.J.M. Crawford and O.M. Centurier-Harris. 1974. Assessment of fishing effort, stock abundance and yield for the South African multi-species pelagic fishery. Colln.scient. Pap.int.Commn.SE.Atl.Fish. 1:163-170.
Newman, G.G., R.J.M. Crawford and O.M. Centurier-Harris. 1979. Fishing effort and factors affecting vessel performance in the South African purse-seine fishery. 1964-1972. Investl.Rep.Sea Fish.Brch.S.Afr. 120:1-34.
Newman, G.G., T. Stewart, R.J.M. Crawford, L. Bothna, J.G. Field, J.R. Greene and D.S. Butterworth. 1980. A critique of "The control of a pelagic fish resource". S.Afr.J.Sci. 76:453-464.
Pope, J.G. and J.G. Shepherd. 1982. A simple method for the consistent interpretation of catch-at-age data. J.Cons.int.Explor.Mer. 40:176-182.
Shannon, L.V. and J.L. Henry. 1983. Phytoplankton primary production in the Benguela Current from ship and satellite measurements. SANCOR 5th National Oceanographic Symposium, January 1983. Sump.S.Afr.Coun.Scient.ind.Res. S.288:B18.
Shelton, P.A. and M.J. Armstrong. (This Volume). Variations in parent stock and recruitment of pilchard and anchovy populations in the Southern Benguela System.
Shelton, P.A. and L. Hutchings. 1982. Transport of anchovy, Engraulis capensis Gilchrist, eggs and early larvae by a frontal jet. J.Cons.int.Explor.Mer. 40:185-198.
Stander, G.H. and A.H.B.de Decker. 1969. Some physical and biological aspects of an oceanographic anomaly off South West Africa. Investl.Rep.Div.Sea. Fish.S.Afr. 81:1-46.
Stander, G.H. and P.J. le Roux. 1968. Notes on fluctuations of the commercial catch of the South African pilchard (Sardinops ocellata) 1950-1965. Investl.Rep.Div.Sea Fish.S.Afr. 65:1-14.
Thomas, R.M. 1982. SWA coring program. Workshop on the fluctuations, assessment and management of anchovy populations, of anchovy populations, August 1982. Cape Town. Document number 19 (unpublished).
Thomas, R.M 1983. Catch, age, growth and stock assessment of the SWA pilchard, Sardinops ocellata, in Divisions 1.3, 1.4 and 1.5 for 1982. Colln.scient.Pap.int.Commn.SE.Atl. Fish. 10: in press.
Thomas, R.M., J.D. Hewitson and H. Bohme. 1982. Suggested explanation for a shift in catch positions of juvenile anchovy off South West Africa in 1978. Fish.Bull.S.Afr. 16:95-97.
Troadec, J.-P., W.G. Clark and J.A. Gulland. 1980. A review of some pelagic fish stocks in other areas. Rapp.P.-v.Réun.Cons.int.Explor.Mer. 177:252-277.
by
Robert J.M. Crawford, Peter A. Shelton and Larry Hutchings
Sea Fisheries Research Institute
Private Bag X2
Rogge Bay
8012
South Africa
Resumen
El sistema de afloramientos del sur de Benguela soporta una gran pesquería comercial que opera con redes de cerco, arrastre de media agua y de fondo. Entre las especies que forman cardúmenes están: Sardinops ocellata, Engraulis cepensis, Trachurus trachurus, Scomber japonicus y Etrumeus teres, mientras que las principales especies que contribuyen a las pesquerías de media agua y de fondo son T. trachurus y Merluccius spp respectivamente. Frente al Cabo Oeste de la República de Sudáfrica y frente a la parte Sudoeste de Africa los desembarques de los cerqueros estaban inicialmente dominados por Sardinops, pero después del colapso de la población de Sardinops y el cambio del tamaño de malla de las redes, la especie que contribuye mayormente a las capturas en las dos regiones es Engraulis. Frente al Cabo del Oeste las capturas de Trachurus y Scomber con redes de cerco eran abundantes en el pasado, pero ahora son insignificantes. Las capturas en media agua de Trachurus frente al sur oeste de Africa han aumentado marcadamente en años recientes. Arrastreros de fondo capturaron más de un millón de toneladas de Merluccius en el Atlántico Sudeste en 1973.
Hubo un amplio aumento del reclutamiento en cada una de las once poblaciones estudiadas. En ocho de las poblaciones examinadas el reclutamiento puede ser descrito como eruptivo, con la fuerza de las clases anuales que aumentan por lo menos durante dos generaciones pero que luego declinan marcadamente. No se observaron períodos de corta duración donde las fallas del reclutamiento hayan tenido una magnitud comparable a la de los períodos eruptivos, pero en algunos casos el reclutamiento disminuyó y se mantuvo a un nivel bastante bajo. En algunas ocasiones, algunas poblaciones de peces experimentaron simultaneamente reclutamientos favorables, cuando se observaba el mayor incremento relativo del reclutamiento en la especie más abundante.
Algunos de los grandes aumentos de reclutamiento no pudieron ser conectados con ningún fenómeno ambiental obvio, pero aparentemente otros pueden ser relacionados con factores ambientales. Las mayores perturbaciones en las poblaciones de peces pelágicos parecen haber ocurrido antes que se iniciara la pesca comercial con redes de cerco. La estabilización de la cosecha de guano en las islas Guaneras frente a Sudáfrica en los primeros años de la explotación de peces pelágicos con redes de cerco sugiere que los predatores (i.e. aves guaneras) y la pesca comercial compiten por la producción excedente proveniente de la erupción del reclutamiento. Por otro lado la amplia disminución de la cosecha de guano que siguió el colapso del stock de Sardinops, sugiere que las fluctuaciones significativas en el tamaño de las poblaciones principales se reflejan en la biomasa de la combinación de especies en la región. Los colapsos de las poblaciones de Sardinops frente a Sudáfrica y el Sudoeste de Africa fueron seguidos en ambos casos de un crecimiento del tipo logístico de otras especies. La distribución geográfica de algunas especies puede estar relacionada con el tamaño de la población, y la región sur de Benguela parece contener dos subsistemas. Los principales cambios en la abundancia relativa de las especies se reflejó en la dieta de predatores. Un aumento de la mortalidad natural puede demorar el reemplazo de una especie por otra. La explotación intensiva de peces pelágicos ha dado por resultado en una dominancia de especies de vida corta.
INTRODUCTION
The southern Benguela region is a highly productive upwelling area supporting large commercial fisheries (Stander, 1964; Shannon, 1966; Dram, 1977; Newman, 1977; Crawford et al., 1980; Shannon and Anderson, 1982).
Multispecies pelagic fisheries operate off the Republic of South Africa's Western Cape and off Southwest Africa (Cram, 1977; Troadec et al., 1980; Newman and Crawford, 1980). Species contributing to the catches are similar in both regions and include pilchards Sardinops ocellata, horsemackerel Trachurus trachurus, anchovies Engraulis capensis, chubmackerel Scomber japonicus, roundherring Etrumeus teres and a myctophid Lampanyctodes hectoris. The bearded goby Sufflogobius bibarbatus has been caught off Namibia, S.W. Africa.
Stock separation has yet to be satisfactorily resolved (Butterworth, this consultation), but assessments have tended to regard the two regions (Fig. 1) as separate entities. Catches of Sardinops off the Western Cape declined after 1962, whereas those off South West Africa remained at a high level until 1968 (Tables 1 and 2). Results of a tagging experiment indicated that Sardinpos moved freely between Walvis Bay and Lüderitz off Namibia, South West Africa, but that the fishery of the Western Cape exploited a different stock (Newman, 1970b). On the basis of discrepancies in catch rates (de Villiers, 1977) backed up by biological evidence (Draganik, 1977), the International Commission for the Southeast
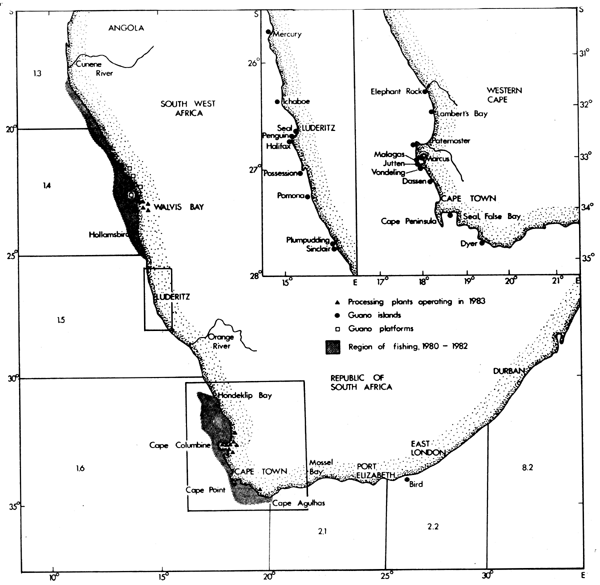
Fig. 1. Map of southern Africa illustrating regions of purse seine fishing. ICSEAF subdivisions, and locations of plants operative in 1983 for the processing of pelagic fishes and of guano islands and platforms.
| Year | Sardinops | Engraulis | Trachurus | Scomber | Etrumeus | Lampanyctories | Total |
|---|---|---|---|---|---|---|---|
| 1950 | 85,3 | - | 49,9 | - | - | - | 135,2 |
| 1951 | 101,9 | - | 98,5 | - | - | - | 200,4 |
| 1952 | 170,0 | - | 102,6 | - | - | - | 272,6 |
| 1953 | 132,5 | - | 85,2 | - | - | - | 217,7 |
| 1954 | 88,3 | - | 118,1 | 4,0 | - | - | 210,5 |
| 1955 | 121,9 | - | 78,8 | 20,2 | - | - | 221,0 |
| 1956 | 76,6 | - | 45,8 | 32,6 | - | - | 154,9 |
| 1957 | 109,5 | - | 84,6 | 7,4 | - | - | 201,5 |
| 1958 | 194,4 | 0,2 | 56,4 | 21,6 | 0,8 | - | 273,4 |
| 1959 | 260,2 | 1,4 | 17,7 | 33,1 | 2,6 | - | 314,9 |
| 1960 | 318,0 | - | 62,9 | 31,0 | 0,1 | - | 412,0 |
| 1961 | 102,2 | - | 38,9 | 49,7 | 0,1 | - | 490,9 |
| 1962 | 410,2 | - | 66,7 | 20,4 | 0,1 | - | 497,3 |
| 1963 | 390,1 | 0,3 | 23,2 | 13,2 | 0,2 | - | 427,0 |
| 1964 | 256,1 | 92,4 | 24,4 | 50,0 | 2,7 | - | 425,6 |
| 1965 | 204,5 | 171,0 | 55,0 | 41,4 | 8,2 | - | 480,1 |
| 1966 | 118,0 | 143,9 | 26,3 | 53,4 | 15,4 | - | 357,1 |
| 1967 | 69,7 | 270,6 | 8,8 | 128,2 | 32,0 | - | 509,3 |
| 1968 | 107,8 | 138,1 | 1,4 | 91,0 | 30,3 | 0,1 | 368,6 |
| 1969 | 56,1 | 149,2 | 26,8 | 91,7 | 23,3 | 4,9 | 352,0 |
| 1970 | 61,8 | 169,3 | 7,9 | 77,9 | 23,7 | 18,2 | 358,0 |
| 1971 | 87,6 | 157,3 | 2,2 | 54,2 | 21,6 | 2,0 | 324,9 |
| 1972 | 104,2 | 235,6 | 1,3 | 56,7 | 20,6 | 15,2 | 433,6 |
| 1973 | 69,0 | 250,9 | 1,6 | 58,8 | 28,7 | 42,4 | 451,4 |
| 1974 | 16,0 | 349,8 | 2,5 | 30,7 | 1,3 | 0,3 | 400,5 |
| 1975 | 89,2 | 223,6 | 1,6 | 69,3 | 23,6 | 0,1 | 407,4 |
| 1976 | 176,4 | 218,3 | 0,4 | 0,5 | 11,7 | 0,1 | 407,5 |
| 1977 | 57,8 | 235,5 | 1,9 | 21,3 | 35,0 | 5,6 | 357,2 |
| 1978 | 97,0 | 209,5 | 3,6 | 2,4 | 67,0 | 1,0 | 380,4 |
| 1979 | 52,9 | 291,4 | 4,3 | 2,7 | 21,0 | 8,7 | 380,9 |
| 1980 | 50,4 | 315,5 | 0,4 | 0,2 | 14,1 | 0,1 | 380,5 |
| 1981 | 46,2 | 292,0 | 6,1 | 0,3 | 24,3 | 10,3 | 379,2 |
| 1982 | 33,5 | 306,9 | 1,1 | 2,7 | 31,0 | 0,7 | 375,9 |
| Year | Sardinops | Trachurus | Engraulis | Other* | Total |
|---|---|---|---|---|---|
| 1950 | 46,7 | - | - | 46,7 | |
| 1951 | 127,2 | - | - | 127,2 | |
| 1952 | 225,8 | - | - | 225,8 | |
| 1953 | 262,2 | - | - | 262,2 | |
| 1954 | 250,6 | - | - | 250,6 | |
| 1955 | 227,1 | - | - | 227,1 | |
| 1956 | 227,9 | - | - | 227,9 | |
| 1957 | 227,5 | - | - | 227,5 | |
| 1958 | 229,1 | - | - | 229,1 | |
| 1959 | 273,5 | - | - | 273,5 | |
| 1960 | 283,3 | - | - | 283,3 | |
| 1961 | 343,5 | - | - | 343,5 | |
| 1962 | 379,4 | - | - | 397,4 | |
| 1963 | 555,2 | - | - | 555,2 | |
| 1964 | 635,9 | - | 0,6 | 636,5 | |
| 1965 | 666,1 | - | 1,0 | 667,1 | |
| 1966 | 718,5 | - | 3,3 | 721,8 | |
| 1967 | 926,0 | - | 24,3 | 950,3 | |
| 1968 | 1 386,6 | - | 161,2 | 1 547,8 | |
| 1969 | 1 111,0 | - | 226,1 | 1 337,1 | |
| 1970 | 513,7 | - | 188,9 | 702,6 | |
| 1971 | 325,1 | 140,2 | 184,7 | 5,2 | 655,2 |
| 1972 | 373,5 | 21,7 | 136,6 | 2,4 | 534,2 |
| 1973 | 408,1 | 12,4 | 296,1 | 4,2 | 720,8 |
| 1974 | 561,6 | 30,1 | 249,1 | 2,1 | 842,9 |
| 1975 | 561,4 | 14,1 | 186,4 | 7,7 | 769,6 |
| 1976 | 451,7 | 23,2 | 87,8 | 7,6 | 570,3 |
| 1977 | 200,0 | 81,9 | 132,9 | 1,0 | 415,8 |
| 1978 | 46,0 | 9,0 | 355,4 | 0,1 | 410,5 |
| 1979 | 33,8 | 27,9 | 277,5 | 1,6 | 340,8 |
| 1980 | 10,8 | 39,2 | 190,2 | 0,2 | 240,3 |
| 1981 | 52,4 | 4,0 | 199,1 | 0,6 | 255,5 |
* Includes Scomber, Etrumeus, Lampanyctodes, Sufflogobius and Sxyphozoa.
Atlantic Fisheries (ICSEAF) recognises three separate stocks of Trachurus: one in ICSEAF Divisions 1.3 and 1.4, a second in Divisions 1.5 and 1.6, and a third in Divisions 2.1 and 2.2 (Crawford, 1981c). Badenhorst and Boyd (1980) have speculated that anchovies spawned off the Western Cape are transported by currents to the Luderitz vicinity and cite movements of a drogue and a satellite-tracked drifter (Harris and Shannon, 1979) in support of their hypothesis. However, preliminary results suggest that the South West African and Western Cape concentrations of anchovies may be genetically distinguishable (Armstrong et al., 1983).
Hakes Merluccius spp. are trawled demersally off both South and South West Africa (Tables 3 and 4). Stock identity is under review (Lleonart et al., 1983), but traditional assessments have recognised separate populations for ICSEAF Divisions 1.3 and 1.4, ICSEAF Division 1.5, ICSEAF Division 1.6 and ICSEAF Divisions 2.1 and 2.2 (e.g. Newman et al., 1976a; 1976b; 1976c).
In a preliminary discussion of aspects of variability of some neritic stocks in the Southeast Atlantic this paper accepts traditionally recognised stock separations, that is it regards pelagic populations contributing to the purseseine fishery off South West Africa as distinct from those harvested off the Western Cape. Similarly hakes trawled off South West Africa and off the Western Cape are regarded as contributing to different populations. Should future research reveal the situation to be otherwise, stock trends indicated by current assessments and hence the basis of this paper may prove invalid.
![]()
![]()
![]()