by
S.H. Coombs, J.A. Lindley and C.A. Fosh
Natural Environment Research Council (NERC)
Institute for Marine Environmental Research
Prospect Place, The Hoe
Plymouth, Devon PL1 3AX
United Kingdom
Resumen
El muestreo con registrador continuo de plancton (RCP) ha sido utilizado en el Mar del Norte y el Atlantico Norte para describir las variaciones a largo plazo en la distribución, abundancia y ocurrencia estacional del plancton, incluyendo huevos y larvas de peces. Estos resultados han formado la base de un estudio de la disponibilidad de alimento durante la fase larvaria y la influencia de las variables ambientales.
Al igual que en otros estudios empíricos de correlación entre índices de stocks adultos y plancton no se encontró ninguna relación consistente. En forma superficial, estos resultados proporcionaron evidencia para rechazar la hipótesis convencional de que el reclutamiento es controlado por la disponibilidad de alimentos. Por otro lado, la abundancia de organismos alimenticios en el mar raramente ha sido medido en concentraciones que sean adecuadas para la sobrevivencia de larvas de peces. Sin embargo, los estimados comúnes de la abundancia de plancton están basados en un muestreo que integra una escala demasiado amplia en sentido horizontal y vertical que resulta inapropiado en relación al ambiente que puede ser percibido por una larva; por lo tanto, un muestreo a una escala de resolución más fina puede reflejar la verdadera concentración y disponibilidad de alimento para las larvas.
El muestreo vertical estratificado del plancton ha mostrado la agregación de larvas de caballa (Scomber scombrus) en capas estrechas a la misma profundidad en que ocurre la máxima productividad primaria potencial (indicada por la concentración de clorofila - a) y el microplancton del rango de tamaños 102–161 um. es abundante. Este rango de tamaños está constituido de nauplias de copépodos y estadios copépodiformes, los que también constituyen los items principales en el contenido intestinal de las larvas.
La concentración de microplancton de tamaño adecuado para la alimentación alcanzó al menos 200 partículas 1-1, lo que probablemente es suficiente para la sobrevivencia de las larvas.
Estos hallazgos parecen indicar que si se quieren evaluar las condiciones de alimentación favorables para la sobrevivencia de las larvas, es necesario muestreos de plancton a una escala más fina en un área geográfica suficientemente amplia del área de desove. Un método de conciliar los problemas logísticos de muestreos en estas escalas tan extremas es usando un muestrador de perfil batimétrico de alta velocidad tal como el Registrador Oceanográfico Ondulante (ROO) o el “Batfish”, para identificar áreas con condiciones potencialmente favorables, y después concentrar el muestreo de plancton de pequeña escala en estas áreas. Una ventaja adicional del muestreo continuado de plancton a alta velocidad es que, a diferencia de lo que ocurre con el muestreo convencional, con la integración del muestreo a través del área muestrada se reduce el sesgo que resulta de tratar una sola estación como representative de un área más amplia, y se reduce la varianza generada por la distribución desigual del plancton. Por ejemplo, de esta forma los reconocimientos cuantitativos de huevos de peces, y por lo tanto la estimación del tamaño del stock desovante, se pueden llevar a cabo a alta velocidad, colectando una cantidad relativamente pequeña de material y se pueden obtener estimados de la abundancia de la población que son mejores que los obtenidos por métodos convencionales.
INTRODUCTION
Conventional theories of fluctuation in year-class strengths of marine fish stocks have stressed the importance of availability of food, particularly the concept of the “critical period” for first-feeding larvae (see May, 1974). However, empirical studies, based on conventional sampling at the kilometre scale, have generally failed to show a relationship between the abundance of planktonic food and year-to-year changes in recruitment (for example, see Gulland, 1965). Similarly, investigations of the interrelationships between indices of adult fish stocks, environmental variables and broadscale estimates of plankton abundance derived from sampling at a scale of tens of kilometres with Continuous Plankton Recorders (see Edinburgh, Oceanographic Laboratory, 1973) have also failed to show any clear causal links (Garrod and Colebrook, 1978; unpublished results). Superficially, and within the limitations of the methods of data collection, these results might seem to give grounds for rejecting the hypothesis of dependence of recruitment on the availability of food. Moreover, concentrations of food particles at the levels needed for successful rearing of larvae have rarely been observed in the sea. Laboratory studies have indicated a typical requirement of first-feeding larvae for prey concentrations of 100–1000 particles 1-1 (e.g. O'Connell and Raymond, 1970; Laurence, 1974 and 1977); a few reports have described larval feeding at food concentrations of 10–100 particles 1-1, but this is usually accompanied by significantly depressed rates of growth and survival (e.g. Houde, 1978; Werner and Blaxter, 1980). By contrast, in the sea, suitable food organisms have rarely been reported at concentrations exceeding 20 particles 1-1 (e.g. Arthur, 1977; Beers and Stewart, 1969).
It may well be, however, that food abundance has been measured by sampling at an inappropriate scale. Recently, a few reports of stratified vertical sampling have revealed layers of particle concentration exceeding 100 particles 1-1 and in some cases there was evidence that larvae were aggregating on the food concentrations (Lasker, 1975; Ellertsen et al., 1977; Owen, 1981). Clearly, the ability to detect patches of adequate food concentration is dependent on sampling with an appropriate spatial discrimination; furthermore, because gradients of variability in the sea are greater vertically than horizontally (for example, see Steele, 1978) the critical plane for sample resolution is the vertical, and discrimination should be on a scale of metres, or less, to match the searching potential of a fish larva. It seems reasonable to assume that ontogenetic and diel vertical migrations of fish larvae would provide a feasible mechanism for encountering layers of aggregated food particles which would be available only over inaccessible horizontal distances.
It follows from these assumptions that, in order to measure plankton abundance as an estimate of available food for fish larvae, it is necessary to sample discrete depth layers instead of using large-scale integrated sampling.
In the present paper results are presented from vertically stratified plankton sampling designed to explore the relationship between the vertical distribution of mackerel larvae Scomber scombrus and microplankton. The implications of the results are discussed in relation to the design of plankton sampling for investigations of the dependence of recruitment on plankton abundance, and suitable methodologies are outlined. Additionally, experience from the use of high-speed and broad-scale sampling techniques is used to suggest improved sampling strategies for ichthyoplankton surveys, as required, for example, to provide data for stock management.
MATERIAL AND METHODS
Vertical distributions of fish eggs and larvae were investigated by oblique hauls at selected stations (Fig. 1) in 1974, 1975, 1978, 1980 and 1981 using a modified LonghurstHardy Plankton Recorder (LHPR; Longhurst and Williams, 1976) towed at a speed of 2.3 knots. This instrument takes discrete samples of plankton from a recorded volume of water over a known depth range while measuring temperature continuously. For these studies the filtration system consisted of a conical nylon net of mesh aperture 280um or 710um (for egg sampling only) with a flowmeter at the mouth and a unit containing two rolls of gauze (mesh aperture 280um) which were advanced so that discrete samples of plankton were taken at pre-determined intervals of 30, 60 or 120 seconds. On completion of a haul the rolls of gauze containing the plankton samples, were placed in 3% or 4% formaldehyde solution and subsequently analysed for fish eggs and larvae. These data were processed with the depth and flow information to give a numerical estimate of abundance over successive standard depth intervals.
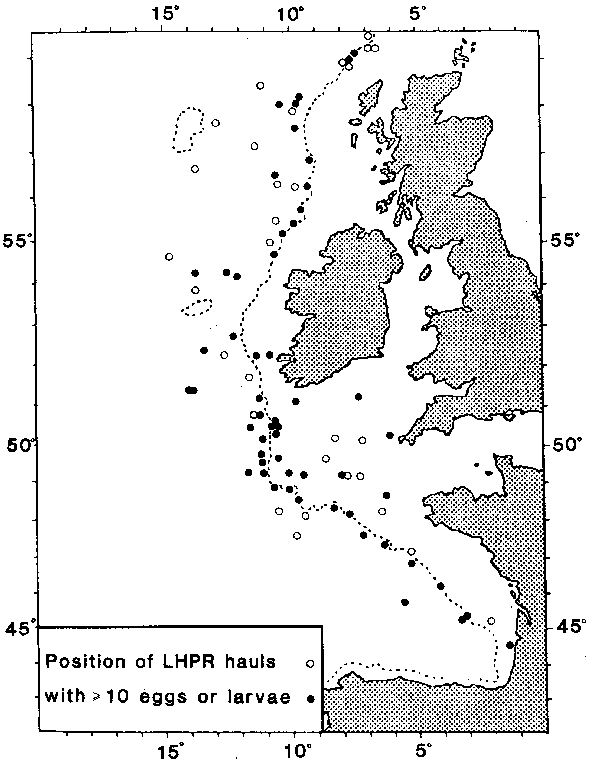
Fig. 1. Positions of LHPR hauls taken to the west of the British Isles in the years 1974–1981.
The vertical distribution of microplankton was investigated in May and June 1980 (Table 1) using an LHPR system equipped with a fine-mesh net in addition to the coarse net described above; a fine polyester gauze (53um mesh) was used for the filtering net as well as the sampling rolls in the cod-end unit (for a full description see Williams et al., in press). This “fine mesh” system was mounted on the sampler frame above the “coarse mesh” system (280um or 710um) so that both intake apertures were in line and separated by 45cm at their centres. Microplankton samples were preserved in 3% formaldehyde from which they were subsequently transferred to 1% solution for analysis by a Coulter Counter size frequency analyser, the results being expressed as equivalent spherical diameter of the particles; control samples and those selected for species analysis were examined by inverted light microscope for identification and measurement of specimens. On selected LHPR hauls in May and June 1980 (Table 1), chlorophyll--a was measured at intervals of 15 seconds by a sensor (Aiken, 1981a) attached to the sampler frame.
| Date 1980 | Time GMT | Sample validity: valid + or invalid - Coarse mesh Fine mesh Chlorophyll | No. of mackerel larvae | |||
|---|---|---|---|---|---|---|
| 1 May | 1632 | + | - | - | 0 | |
| 2 | 2229 | + | + | - | 111 | |
| 4 | 0213 | + | + | - | 260 | |
| 7 | 2312 | + | - | + | 16 | |
| 9 | 1114 | + | + | - | 0 | |
| 10 | 1930 | + | + | + | 0 | |
| 14 | 1113 | + | + | + | 162 | |
| 16 | 2251 | + | + | + | 27 | |
| 17 | 0402 | + | + | + | 91 | |
| 17 | 0925 | + | + | + | 55 | |
| 17 | 1536 | - | + | + | - | |
| 2 June | 0906 | + | + | - | 62 | |
| 3 | 1728 | + | + | + | 0 | |
| 4 | 1422 | + | + | + | 0 | |
| 7 | 1801 | - | - | + | - | |
| 8 | 2031 | + | + | + | 35 | |
| 9 | 1855 | + | - | + | 9 | |
| 11 | 1625 | + | + | + | 237 | |
| 14 | 1007 | - | - | - | - | |
The geographical distributions of eggs and environmental variables were investigated by sampling with the Undulating Oceanographic Recorder (Aiken, 1981b) along two transects (Fig. 2) in the Celtic Sea in May 1981 (see Coombs et al., 1981b). The UOR is an instrument-carrying body which undulates vertically along a pre-set path when towed at normal cruising speeds behind the survey vessel. Inside the UOR is a data logging system which scans sensors for depth, temperature, chlorophyll-a and salinity at intervals of 15 seconds, thus providing vertical profiles of these variables along the towing track. The UOR also contained a simple plankton sampler consisting of a single net bag (710um mesh aperture) with integral digital flowmeter; this provided a single sample on each deployment of the UOR, representing about 0.7m3 of water filtered per kilometre of the tow. These samples were preserved in 3% formaldehyde solution and subsequently analysed for fish eggs.
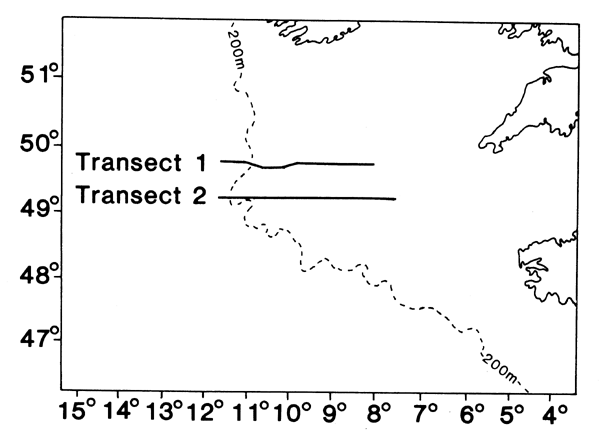
Fig. 2. Tracks along which the Undulating Oceanographic Recorder was towed in May 1981.
RESULTS
Vertical Distribution of Mackerel Eggs and Larvae
As was found previously in the Celtic Sea (Coombs et al., 1981a), mackerel eggs were taken from the surface to depths of several hundred metres in the early part of the spawning season, in March and April; later in the season, in May and June when the seasonal thermocline was established, the eggs were mostly in the upper mixed layer above about 60 m depth (see Fig. 3 and, for detailed examples, Fig. 4). The majority of larvae were taken at shallow depths (<60m) in all months sampled (March to June), although before May they were present in only a few hauls (see Fig. 3, 4 and 5). More significantly for the present investigations, larvae were concentrated within a narrower depth range (10–20m in vertical extent) than the eggs (Table 2 and see Figs. 4 and 5). There was no consistent difference between the vertical distributions of different size categories of larvae (Fig. 5), (but post-larvae at about 18mm in length, i.e., larger than the larvae in our study, have been reported by Nellen and Hempel, 1970, as being abundant in the neuston). Highest numbers of larvae were sometimes taken at the surface but the maximum was more often in sub-surface waters in the depth range of 20–40 m (Fig. 5). As in previous studies of the smaller sizes of mackerel larvae (Grave, 1978; Southward and Bary, 1980), there was no diel change in their depth of occurrence in the present study.
| Interquartile range, metres | ||||
|---|---|---|---|---|
| March | April | May | June | |
| Eggs, all stages | 92 | 105 | 41 | 30 |
| Larvae, 0–3.9 mm | - | 39 | 21 | 24 |
| Larvae, 4.0–5.9 mm | - | 25 | 23 | 21 |
| Larvae, 6.0–7.9 mm | - | 18 | 28 | 25 |
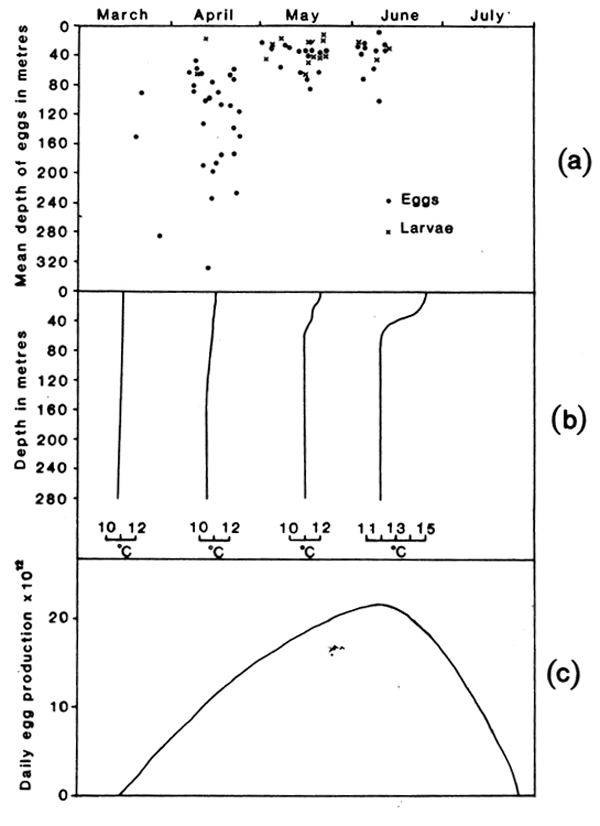
Fig. 3. (a) The mean depth of mackeel eggs (all stages of development) and mackerel larvae (<8.0mm in length) on individual LHPR hauls on which > 10 eggs or < 5 larvae were taken; (b) representative temperature profiles from the LHPR hauls in each month; (c) egg production curve for the western mackerel spawning stock (based on Lockwood et al., 19810.
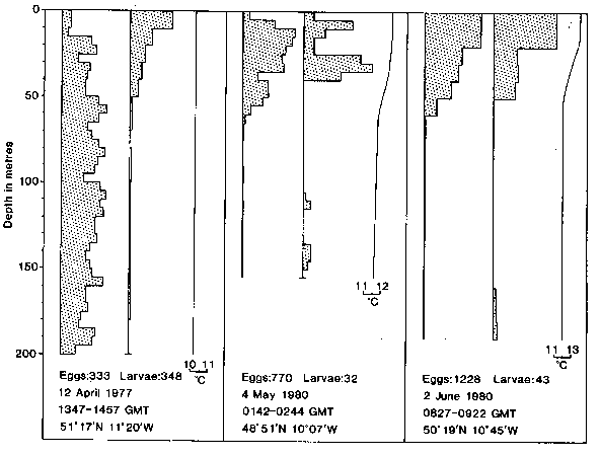
Fig. 4. Representative vertical distributions of mackerel eggs (all stages of development) and larvae (<4.0mm in length) for April, May and June taken on three individual LHPR hauls; the distributions are plotted in units of relative abundance against depth and below each profile are indicated the numbers of specimens on which it was based and station information; alongside the distributions are shown the concurrent temperature profiles.
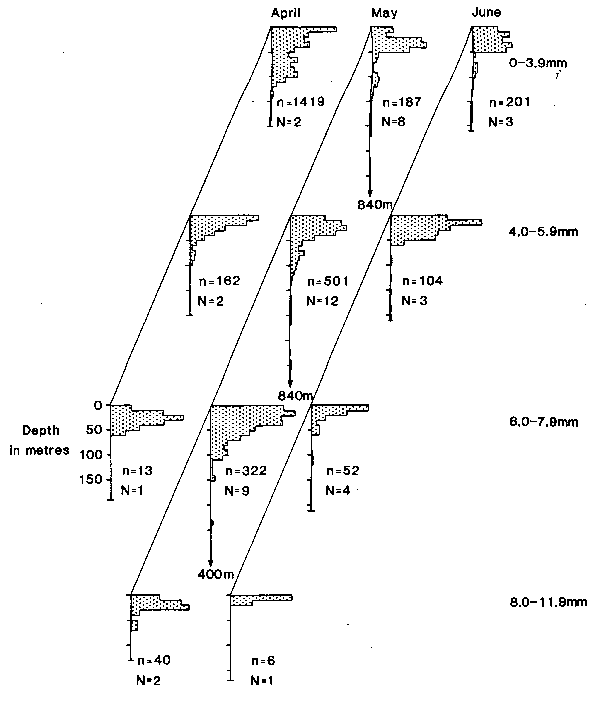
Fig. 5. Vertical distributions of mackerel larvae in four length groups plotted as the mean distribution from LHPR hauls taken in all years in the months of April, May and June. Each distribution is plotted in units of relative abundance against depth; alongside each profile are indicated the numbers of larvae (n) and of hauls (N) on which each distribution is based. Only those hauls containing>5 larvae are included.
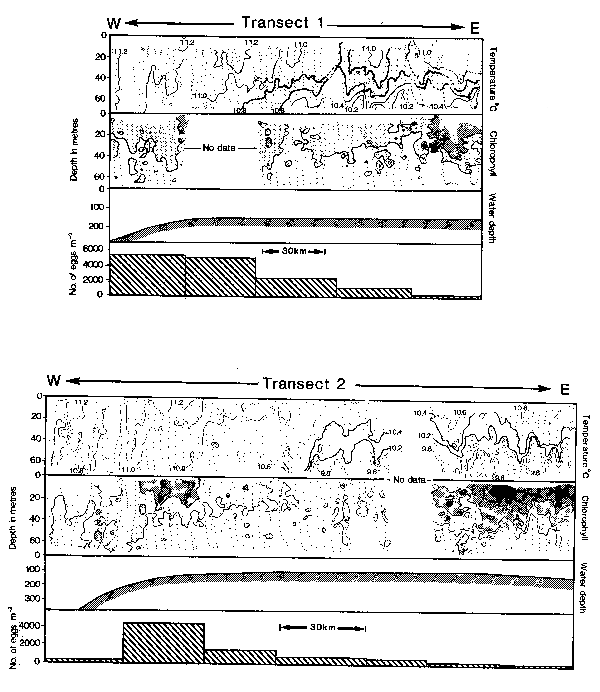
Fig. 6. Temperature and chlorophyll-a sections taken by UOR sampling along two transects in the Celtic Sea (see Fig. 2); also indicated are the water depth and numbers of early development stage mackerel eggs taken concurrently a long sections of each transect. Temperature is contoured at intervals of 0.2°C with selected isotherms drawn more heavily to show the structure more clearly. Chlorophyll-a concentration is contoured at intervals of 1.0mg m-3. and stippled at progressively darker shades above 1.0mg m-3. The small dots indicate positions of each data measurement made along the tow.
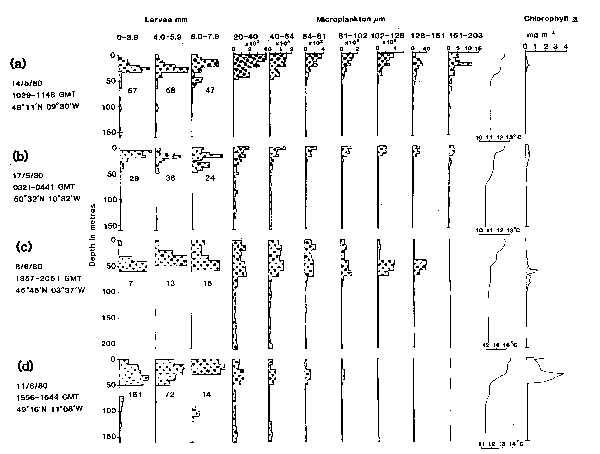
Fig. 7. The vertical distributions of mackerel larvae and microplankton and the concurrent temperature and chlorophyll-a profiles taken on four selected LHPR hauls. The distributions of larvae are plotted in units of relative abundance against depth; below each profile is indicated the number of larvae on which the distribution is based. The distributions of microplankton are plotted as numbers of particles l-l in each size category. Sampling resolution was at a vertical scale of 5m for the hauls taken in May (a and b) and 10m for the hauls in June (c and d).
Distribution of Mackerel Eggs and Larvae in relation to Temperature, Chlorophyll-a concentration and Microplankton abundance
Dickson et al., (1980), have drawn attention to the similarity between the location of mackerel spawning grounds at the shelf-edge to the west of the British Isles and a corresponding area of upwelling and associated high potential productivity (see, also, Pingree and Mardell, 1981). The general favourability of the area for spawning was shown more precisely by the relationship between abundance of mackerel eggs and concurrent measurements of chlorophyll-a (as an index of potential productivity) taken by UOR sampling along two transects in the Celtic Sea in May 1981 (Fig. 2). Highest numbers of mackerel eggs were taken at the western endes of both transects in relatively unstratified water at the shelf-edge (Fig. 6); further to the east egg numbers were lower and thermal stratification was increasingly evident at 30–50m depth in a pattern resembling internal waves which are characteristic features of the area (Pingree and Mardell, 1981). Associated with the stratified water at the eastern ends of the transects were rich concentrations of chlorophyll-a in the overlying layer of warmer water. Further to the west chlorophyll-a was generally low, but there was distinct evidence on Transect 2 and (less distinctly because of a gap in sampling) on Transect 1 of a region of enhanced values near the shelf-edge corresponding with the region of peak numbers of mackerel eggs (Fig. 6). Information about the distribution of chlorophyll-a provides an indication of potential primary production but its value as an indicator of availability of food for fish larvae depends on the relationship between chlorophyll-a and the microplankton which forms their immediate food source.
Results from sampling for microplankton in the size range 20–203um at the mackerel spawning rounds in May and June 1980 (Table 1) showed that plankton in this size range was relatively abundant in warm surface water and intermediate layers of the thermocline from about 50m to the surface (for examples, see Fig. 7). Below the thermocline microplankton was much less abundant, particularly so in the case of the smaller size categories. Highest concentrations were often in the most superficial 20m depth range but on several hauls prominent concentrations, most noticeably of the larger size groups, were observed somewhat deeper, often within the temperature discontinuity (for examples, see Fig. 7). In one haul, when there was little temperature stratification, microplankton was more evenly distributed to a depth of several hundred metres (Fig. 8), although the highest concentrations were all within the upper 150 m.
Profiles of chlorophyll-a taken concurrently with microplankton sampling showed detectable concentrations only within the upper 60m depth range, corresponding approximately with the thickness of the upper mixed layer above the thermocline (for examples, see Fig. 7; see, also, Fig. 6). Low values ( 0.5mg m-3) were recorded on most hauls; only twice, both in June, were concentrations encountered which exceeded levels of 1.0mg m-3 (Figs. 7c and d). As other workers have found (e.g. Longhurst, 1976; Holligan and Harbour, 1977), the highest values of chlorophyll-a were found at intermediate depths below the surface, frequently in association with the thermocline (e.g. Fig. 7d), although this was not a feature of the chlorophyll distributions obtained by UOR sampling (Fig. 6). On several hauls concentrations of chlorophyll-a corresponded with higher counts of phytoplankton and peaks in the abundance of microplankton particles below 102um in size (e.g. Fig. 7d). In general, while the concentrations of chlorophyll-a reflected the generally increased abundance of microplankton in the upper 60m of water depth, there was little precise correspondence with individual layers of microplankton.
Composition of the microplankton taken in the oblique hauls with the LHPR was typical of fine mesh plankton samples from around the British Isles in the spring. The most common organisms in the size range 100–203um* were nauplii and copepodites of Oncaea spp. and Oithona spp. and nauplii of Paracalanus parvus and Pseudocalanus minutus; less numerous were copepodite stages of P. parvus, P. minutus, Acartia spp. and Microsetella spp. Below 100um in size, phytoplankton was an important component being mostly Rhizosolenia spp., Coscinodiscus spp., Peridinium spp., Ceratium spp. and Thalassiosira spp. Larvacea, Foraminifera, Tintinnida and Echinodermata larvae were occasionally present. In the smallest size categories (20–64um), unidentified detritus composed of broken remains, such as detached setae, was recorded in significant amounts.
* Size range is given as the equivalent spherical diameter of the volume of each organism calculated from simple measurements of body dimension and formulae for the volume of similar simple geometric shapes e.g. assuming a cylindrical body form for a copepodite stage of Oncaea spp. having a metasome length of 240um and depth of 100um gives an equivalent spherical diameterof 153um.
Foraminifera, Tintinnida and Echinodermata larvae were occasionally present. In the smallest size categories (20–64um), unidentified detritus composed of broken remains, such as detached setae, was recorded in significant amounts.
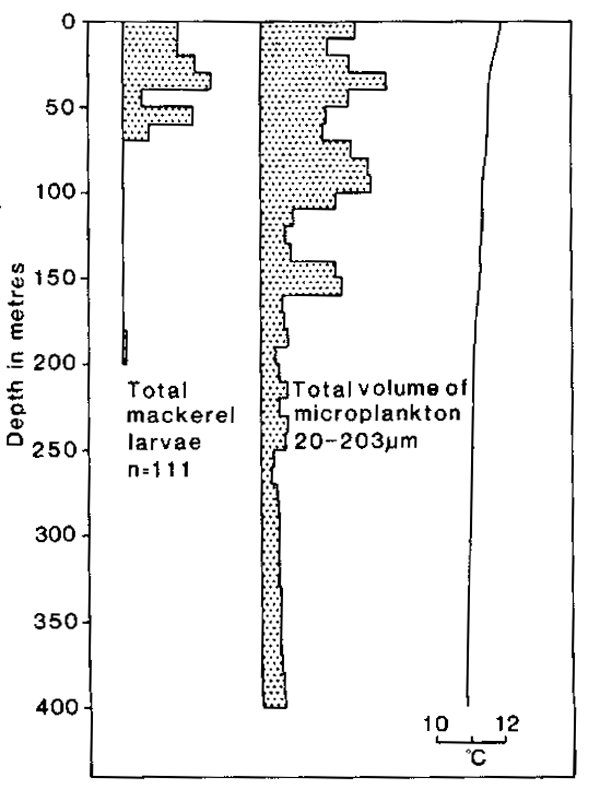
Fig. 8. The results from a single LHPR haul on 2 May 1980 when there was little or no temperature stratification. The distributions of mackerel larvae and microplankton are plotted in units of relative abundance against depth. Below the profile for mackerel larvae is indicated the number of specimens (n) on which the distribution is based.
Comparison of vertical distributions of mackerel larvae and microplankton was complicated by varying levels of abundance between hauls and by the different shapes of individual profiles. In order to derive a quantitative assessment of affinity between the various depth profiles within a haul, similarity measures were calculated between each size group of larvae and microplankton. The method adopted was first a standardization of the depth profiles to give percentage abundance of each larval or microplankton group in each depth interval, followed by calculation of Bray-Curtis similarity coefficients (e.g. Field et al., 1982) between each larval and microplankton group. For each of the three larval size categories, the corresponding similarity coefficients were ranked (i.e. assigned the numbers 1 to 7 according to increasing degree of similarity between the larval profile and the seven size categories of microplankton). This procedure was repeated for all hauls and the agreement between hauls tested using Kendall's “coefficient of concordance” (Kendall, 1955). Significance for this test implies that the relation between the particular larval size category and the various microplankton groups is replicated over several hauls in a way that cannot be due to change permutations. For each larval group, summation of the sets of ranks across all hauls, followed by standard normalization of these totals, allows a visual assessment of the relationships between mackerel larvae and microplankton size groups, as plotted in Figure 9. There was a clear pattern showing a positive relationship, significant at just below the 5% level, between larvae and microplankton of 102–128um and 128–161um in size. The distribution of the smallest larvae, at <4.0mm in length, was most closely related to the smaller of these two size categories of microplankton (102–128um) whereas the relationship was reversed for the two larger size groups of larvae (4.0–5.9mm and 6.0–7.9mm) which were more closely associated with microplankton of 128–161um (Fig. 9).
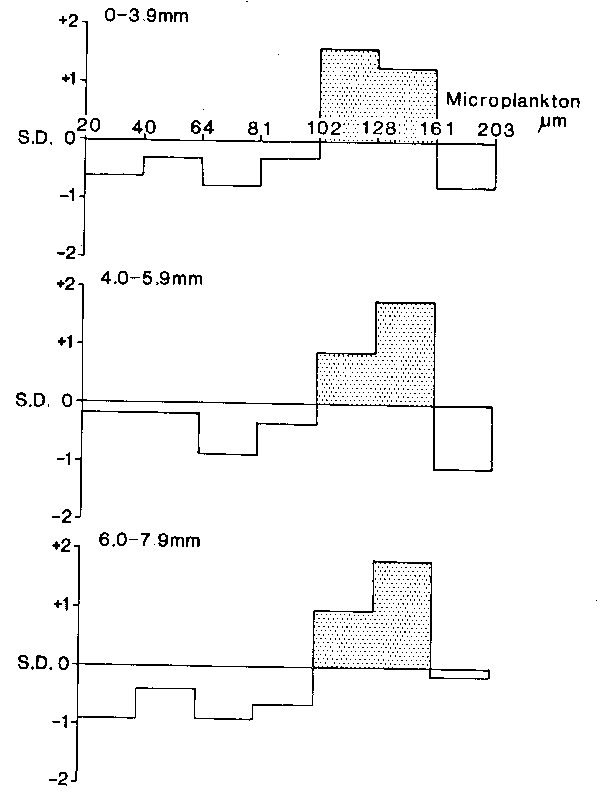
Fig. 9. The relationships between three size groups of mackerel larvae and various size groups of microplankton; for further details see text.
While this method of comparison provides a convenient summary of results from all hauls, it gives little information about the qualitative similarity between individual larval and microplankton profiles; for this purpose vertical distributions are presented from four representative hauls taken in May and June 1980 (Fig. 7). On three of these hauls, microplankton was relatively abundant (Figs. 7a, b and c), whereas on the other haul (Fig. 7d) it was present at a low concentration, particularly in the larger size categories.
On the haul taken on 14 May (Fig. 7a) the majority of larvae were in the upper 50m of the water column where microplankton was generally most abundant;more specifically, the two smaller categories of larvae of 0–3.9mm and 4.0–5.9mm in length were concentrated at 20–25m depth where microplankton of 128–161 um and 161–203um in size was most abundant. Similarly on 8 June (Fig. 7c) mackerel larvae were most numerous at 40–60m depth corresponding to concentrations of microplankton, in particular those of 102–128um and 128–161um in size. On both of these hauls (Figs. 7a and c) there were also peaks of chlorophyll-a at the same depth as the larvae. Concentration of particles in the size ranges 102–128um and 128–161 um reached maxima of 99 and 39 particles 1-1 respectively on the haul of 8 June (Fig. 7c). There was a less precise relationship between the distributions of larvae and individual microplankton profiles for the hauls taken on 17 May (Fig. 7b) and on 11 June (Fig. 7d). Also on 17 May, chlorophyll-a concentration was relatively constant throughout the upper 40m depth range and was not related in detail to the larval distributions. In contrast, on 11 June, when the larger size categories of microplankton were relatively scarce, larvae were abundant at about 40m depth where high concentrations of the smaller sizes of microplankton and chlorophyll-a were also recorded (Fig. 7d).
From the set of double-net LHPR hauls, there appears to have been a good correspondence between the distributions of mackerel larvae and microplankton and a more general similarity with temperature and chlorophyll-a, rather than a detailed coincidence in depth. These relationships reflect the occurrence of peak concentrations of larvae and microplankton in the upper 60m of the water column where the profiles for chlorophyll-a and temperature were most variable. Temperature was more clearly related to the distributions of larvae and microplankton than was chlorophyll-a; however, because of the variability within individual temperature profiles, with one or more secondary thermoclines (see Fig. 7), there was an increased probability of some apparent relationships between temperature and the other profiles.
DISCUSSION
Evidence for a functional relationship between the distribution of larvae and microplankton depends not only on their co-occurrence but also on the suitability of the microplankton as a food source, its concentration in adequate amounts and, ultimately, on agreement between gut contents of larvae and the available microplankton. In the present study, the larvae were associated with microplankton in the size range of 102–161um (see Figs. 7 and 9) which consisted mainly of copepod nauplii and copepodite stages; these are known to be typical components of the diet of mackerel larvae of <6.0mm in length and are appropriate in size to the jaw gape of the larvae (Last, 1980). Some preliminary analysis of gut contents of mackerel larvae taken in this study has shown that copepodite stages of Oncaea spp. are important dietary items; they were also one of the most numerous organism in the microplankton of 102–161 um taken at the same depth as the larvae.
Small larvae (<4.0mm in length) were associated with particles of 102–128um in size and larger larvae (4.0–5.9mm) with particles of 128–161um but there was no further increase in the size of particles preferred by the largest larvae (6.0–7.9mm, see Fig. 9). In part this may be the result of the relative scarcity of particles >161 um (for example, see Fig. 7) and a selective shift of feeding to particles of less than the maximum acceptable size under such conditions (Arthur, 1976; Ellertsen et al., 1977; Hunter and Kimbrell, 1980).
Concentrations of microplankton at 100–200 particles 1-1 were measured on several hauls for the combined size groups of 102–128um and 128–161um (see Fig. 7); while these are relatively rich concentrations compared with previously reported values, they must be considered as underestimates based on the integration of concentrations within the 5m or 10m sampling interval used in this study (see Fig. 7). Incidentally, sampling the same microplankton by conventional oblique net hauls to 60m depth would rarely have revealed concentrations exceeding about 25% of the maxima observed from LHPR sampling (see Fig. 7). Theilacker (1981) reported relatively good survival of morphometrically similar larvae of jack mackerel (Truchurus symmetricus) at prey concentrations of 1000 particles 1-1 but did not determine the level below this at which development was impaired; in the light of the expected and reported critical densities of larval food concentration of about 500 particles 1-1 for a range of species (see Laurence, 1974), the estimates of 100–200 particles 1-1 in the present study possibly reflect concentrations in the sea which would be sufficient for survival of mackerel larvae.
The results of this study, therefore, provide general evidence for a functional association between layers of mackerel larvae and microplankton; by implication, these findings give support to the concept of control of larval survival through food availability. One consequence of the suggested importance, for larval feeding, of relatively restricted layers of abundant microplankton is that, to measure food availability, some estimate is required of the occurrence, extent and permanence of such layers; at the same time it is necessary to sample over a wide geographical area to obtain an overall estimate of conditions which are representative for the whole spawning population. In practical terms these opposing scales of sampling present considerable logistic problems.
The occurrence of layers of suitable microplankton may be investigated by sampling at individual stations using systems such as the LHPR, as in these studies, by pumped sampling methods (e.g. Ellertsen et al., 1977) or by some equivalent means of depthstratified sampling; whichever system is used it is essential to sample for larvae and food particles concurrently, since a relatively small horizontal separation between the larvae and a concentration of microplankton represents an effective barrier, within the limited capability for horizontal movement possessed by the larvae. Fine scale sampling of this kind, at individual stations throughout the spawning area would entail the collection of an excessive number of samples. A more effective strategy is to use highspeed depth-profiling samplers such as the UOR or Batfish (for example, see Herman et al., 1981) to identify areas of potentially favourable conditions for larval survival, using as an index chlorophyll-a concentration or some form of particle count, and to restrict the fine-scale plankton sampling to these areas. An additional advantage of high-speed continuous plankton sampling is that the integration of sampling, reduces both the bias, which results from treating a single station as representative of a wider area, and the variance arising from the patchy distribution of plankton; thus, for example, quantitative surveys of fish eggs, and hence estimation of spawning stock size, can be carried out at high speed, involving the collection of a relatively small amount of material which can give a better estimate of population abundance than by more conventional methods (Anon, 1982).
ACKNOWLEDGEMENTS
The authors would like to acknowledge the opportunity offered by the Fisheries Laboratory, Lowestoft (Ministry of Agriculture Fisheries and Food) and the Marine Laboratory, Aberdeen (Department of Agriculture and Fisheries for Scotland) to participate in their research cruises. Additional acknowledgements are due to Dr. K.R. Clarke for statistical treatment of the data and to Dr. J. Aiken, Mr A.W. John and Mr R.K. Pipe for collaboration in various aspects of the programme.
This work forms part of the programme of the Institute for Marine Environmental Research, a component body of the Natural Environment Research Council, and is supported, in part, by the Ministry of Agriculture, Fisheries and Food.
REFERENCES
Aiken, J. 1981a. A chlorophyll sensor for automatic, remote, operation in the marine environment. Mar.Ecol.Prog.Ser. 4:235.
Aiken, J. 1981b. The Undulating Oceanographic Recorder Mark 2. J. Plankton Res. 3(4): 551.
Anon. 1982. Report of the working group on larval fish ecology, Lowestoft, England, 3–6 July 1981. Cons.int.Explor. Mer. L3 (Mimeo).
Arthur, D.K. 1976. Food and feeding of larvae of three fishes occurring in the California current, Sardinops sagax, Engraulis mordax, and Trachurus symmetricus. Fish.Bull.U.S. 74(3): 517.
Arthur, D.K. 1977. Distribution, size and abundance of microcopepods in the California current system and their possible influence on survival of marine teleost larvae. Fish.Bull.U.S. 75(3):601.
Beers, J.R. and G.L.Stewart. 1969. Micro-zooplankton and its abundance relative to the larger zooplankton and other seston components. Mar.Biol. 4:182.
Coombs, S.H., R.K.Pipe and C.E.Mitchell. 1981a. The vertical distribution of eggs and larvae of blue whiting (Micromesistius poutassou) and mackerel (Scomber scombrus) in the eastern North Atlantic and North Sea. Rapp.P.-v.Réun. Cons. int. Explor. Mer. 178: 188.
Coombs, S. H. , J. Aiken and S. J. Lockwood. 1981b. A survey of mackerel spawning and environmental conditions in the Celtic Sea in May 1981. Cons.int.Explor.Mer. H32(Mimeo).
Dickson, R.R., P.A. Garbutt and V.N. Pillai. 1980. Satellite evidence of enhanced upwelling along the European continental slope. J.Phys.Oceanog. 10(5): 813.
Edinburgh, Oceanographic Laboratory. 1973. Continuous Plankton Records: a plankton atlas of the North Atlantic and the North Sea.Bull.Mar.Ecol. 7.
Ellertsen, B., E. Moksness, P.Solemdal, T. Strómme, S. Tilseth, T. Westgård and V. Óiestad. 1977. Vertical distribution and feeding of cod larvae in relation to occurrence and size of prey organisms. Cons.int.Explor.Mer. L33 (Mimeo).
Field, J.G., K.R. Clarke and R.M. Warwick. 1982. A practical strategy for analysing multispecies distribution patterns. Mar.Ecol.Prog.Ser. 8: 37.
Garrod, D. J. and J. M. Colebrook. 1978. Biological effects of variability in the North Atlantic Ocean. Rapp.P.-v.Réun.Cons.int.Explor.Mer. 173: 128.
Grave, H. 1978. Feeding of mackerel larvae and early juveniles in the central North Sea. Cons.int.Explor.Mer. H14(Mimeo).
Gulland, J.A. 1965. The stability of fish stocks. J.du Cons.37(3):199.
Herman, A. W. , D. D. Sameoto and A. R. Longhurst. 1981. Vertical and horizontal distribution patterns of copepods near the shelf break south of Nova Scotia. Can.J.Fish.Aquat.Sci. 38: 1065.
Holligan, P.M.and D.A.Harbour. 1977. The vertical distribution and succession of phytoplankton in the western English Channel in 1975 and 1976. J. Mar. Biol. Ass. U. K. 57: 1075.
Houde, E. D. 1978. Critical food concentrations for larvae of three species of subtropical marine fishes. Bull. Mar. Sci. 28(3): 395.
Hunter, J.R. and C.A. Kimbrell. 1980. Early life history of Pacific mackerel, Scomber japonicus. Fish Bull. U. S. 78(1): 89.
Kendall, M.G. 1955. “Rank correlation methods”. Griffin, London.
Lasker, R. 1975. Field criteria for survival of anchovy larvae: The relation between inshore chlorophyll maximum layers and successful first feeding. Fish Bull.U.S. 73(3): 453.
Last, J.M. 1980. The food of twenty species of fish larvae in the west-central North Sea. Tech. Rep. Fish. Lab. , Lowestoft. No. 60.
Laurence G.C. 1974. Growth and survival of haddock (Melanogrammus aegelfinus) larvae in relation to planktonic prey concentration. J. Fish. Res. Bd. Canada. 31: 1415.
Laurence G.C. 1977. A bioenergetic model for the analysis of feeding and survival potential of winter flounder, Pseudopleuronectes americanus, larvae during the period from hatching to metamorphosis. Fish Bull. U. S. 75(3): 529.
Lockwood, S.J., I.G. Baxter, J.C. Gueguen, G. Joakimsson, R. Grainger, A. Eltink and S. H. Coombs. 1981. The western mackerel spawning stock estimate for 1980. Cons. int. Explor. Mer. H13 (Mimeo).
Longhurst, A.R. 1976. Interactions between zooplankton and phytoplankton profiles in the eastern tropical Pacific Ocean. Deep-Sea Res. 23:729.
Longhurst, A.R. and R. Williams. 1976. Improved filtration systems for multiple-serial plankton samplers and their deployment. Deep-Sea Res. 23: 1067.
May, R. C. 1974. Larval mortality in marine fishes and the critical period concept. pp. 3–19. In The Early Life History of Fish (J.H.S. Blaxter, ed.) Springer-Verlag, Berlin.
Nellen, Von. W. and G. Hempel. 1970. Beobachtungen am Ichthyoneuston der Nordsee. Ber. Dt. wiss. Kommn. Meeresforsch. 21: 311.
O'Connell. C. P. and L. P. Raymond. 1970. The effect of food density on survival and growth of early post yolk-sac larvae of the northern anchovy (Engraulis mordax Girard) in the laboratory. J. Exp. Mar. Biol. Ecol. 5: 187.
Owen, R. W. 1981. Microscale plankton patchiness in the larval anchovy environment. Rapp.P.v. Réun. Cons. int. Explor. Mer. 178: 364.
Pingree, R. D. and G. T. Mardell. 1981. Slope turbulence, internal waves and phytoplankton growth at the Celtic Sea shelf-break. Phil.Trans.R.Soc.Lond.A. 302:663.
Southward, A.J. and B.McK. Bary. 1980. Observations on the vertical distribution of eggs and larvae of mackerel and other teleosts in the Celtic Sea and on the sampling performances of different nets in relation to stock evaluation. J.Mar.Biol.Ass.U.K. 60: 295.
Steele, J.A. (ed.). 1978. Spatial Pattern in Plankton Communities. Plenum Press. New York.
Theilacker, G. H. 1981. Effect of feeding history and egg size on the morphology of jack mackerel. Trachurus symmetricus, larvae, Rapp.P.-v.Réun.Cons.int.Explor.Mer. 178:432.
Werner, R.G. and J.H.S. Blaxter. 1980. Growth and survival of larval herring (Clupea harengus) in relation to prey density. Can.J.Fish.Aquat.Sci. 37:1063.
Williams, R., N.R. Collins, and D.V.P. Conway (in press). The double LHPR system - a high speed micro - and macro-plankton sampler. Deep-Sea Res.
Por
Humberto Tovar
Instituto del Mar del Perú (IMARPE)
Apartado 22
Callao
Perú
Summary
The fluctuations of guano bird populations and proportional compositions of guanay, boobies and pelicans are analysed for the years 1960 to 1981. These fluctuations are related with climatic phenomena, El Niño and the amount of anchoveta captured as causes of reduced food available to the birds and the rates of mortality of adults and chicks.
INTRODUCCION
En el Perú la evaluación de poblaciones de aves guaneras de las tres especies más importantes: guanay (Phalacrocorax bougainvillii), piquero (Sula variegata) y alcatraz (Pelecanus thagus), se viene efectuando mediante el método del censo gráfico, cuyos resultados fueron dados a conocer por Jordán (1963), Jordán y Fuentes (1964 y 1966), Fuentes (1969) y Tovar (1978) con datos analizados hasta el ciclo reproductivo 1973/74.
Los censos gráficos de las aves guaneras tienen la finalidad de determinar la magnitud poblacional de cada ciclo reproductivo y conocer sus fluctuaciones, las que están relacionadas con los cambios ecológicos, tal como el Fenómeno “El Niño”, que se presenta en el litoral peruano más o menos en forma cíclica y que actúan como un factor limitante natural de la población aviar. En los últimos años el desarrollo acelerado de la pesquería de la anchoveta se ha convertido en otro factor limitante extranatural. Estos dos factores limitantes han ocasionado el descenso de la población de aves guaneras a niveles muy bajos, de los que hasta la fecha no puede recuperarse, permaneciendo relativamente estacionaria.
En el presente trabajo se hace referencia a los análisis realizados anteriormente para los ciclos reproductivos 1960/61 a 1973/74 y se analizan los datos correspondientes a los ciclos reproductivos de 1974/75 a 1980/81.
MATERIAL Y METODOS
El material considerado para la evaluación poblacional de aves guaneras en el período 1974–1981 estuvo constituido por 14 censos gráficos, con dos censos para cada ciclo reproductivo y los censos se llevaron a cabo en las siguientes fechas:
| Ciclo reproductivo 1974/75: | 20 noviembre 1974 y 15 febrero 1975 |
| Ciclo reproductivo 1975/76: | 20 noviembre 1975 y 10 marzo 1976 |
| Ciclo reproductivo 1976/77: | 10 diciembre 1976 y 20 febrero 1977 |
| Ciclo reproductivo 1977/78: | 10 diciembre 1977 y 10 marzo 1978 |
| Ciclo reproductivo 1978/79: | 20 noviembre 1978 y 20 febrero 1979 |
| Ciclo reproductivo 1979/80: | 10 diciembre 1979 y 10 marzo 1980 |
| Ciclo reproductivo 1980/81: | 10 diciembre 1980 y 10 marzo 1981 |
El citado material se obtuvo gracias a la cooperación de Pesca Perú, Subdivisión Fertilizantes, quien tiene a su cargo la administración de Islas y puntas guaneras del litoral peruano (Fig. 1).
Se siguió el método descrito por Jordán (1963) que se puede resumir como sigue: en la fecha y hora señalada para el censo, se grafican los contornos de las colonias de aves en cada isla y punta guanera en los croquis respectivos, indicando para cada especie la zona ocupada por aves en proceso reproductivo y en reposo; la información incluye además apreciaciones numéricas de las aves localizadas en barrancos y pequeños islotes fuera del croquis; luego empleando un planímetro se efectúa una lectura de cada una de las colonias graficadas, dichas lecturas se convierten a metros cuadrados multiplicando por el coeficiente pre-determinado para cada isla y punta; una vez obtenida el área, el cálculo del número de aves y la interpretación se efectúa a base de una escala de densidades promedio para cada especie. El cómputo final en cada lugar se efectuó considerando por separado adultos y polluelos, aves en reproducción y aves en reposo; los individuos apreciados en barrancos e islotes son agregados en cada caso.
El empleo del mismo método permite efectuar comparaciones de las poblaciones a través de los años y analizar las fluctuaciones de las mismas.
Con el fin de obtener resultados más confiables sobre poblaciones de aves guaneras en cada ciclo reproductivo, se efectuaron dos censos gráficos, uno al inicio y otro al finalizar la fase reproductiva para así tener una idea mas concreta de la población aviar.
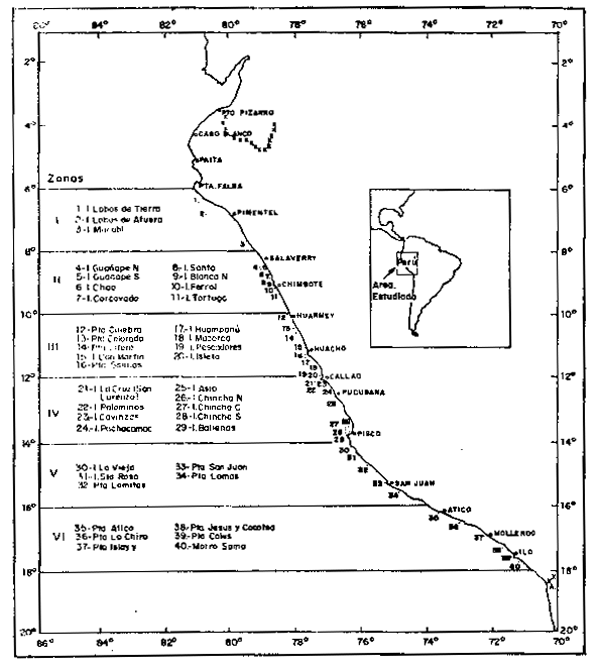
Fig. 1.- Ubicacion de Islas y Puntas Guaneras del litoral peruano con división en zonas de 2° Lat. Sur.
| CICLO | GUANAY | PIQUERO | ALCATRAZ | TOTAL | |||
|---|---|---|---|---|---|---|---|
| REPROOUCTIVO | Cantidad | % | Cantidad | % | Cantidad | % | (millones) |
| 1960/61 | 9.44 | 75 | 2.85 | 23 | 0.27 | 2 | 12.56 |
| 1961/62 | 13.70 | 80 | 2.99 | 18 | 0.32 | 2 | 17.01 |
| 1962/63 | 14.89 | 82 | 2.76 | 15 | 0.42 | 2 | 18.07 |
| 1963/64 | 12.46 | 85 | 2.13 | 14 | 0.12 | 1 | 14.77 |
| 1964/65 | 13.46 | 82 | 2.82 | 17 | 0.23 | 1 | 16.51 |
| 1965/66 | 3.12 | 71 | 1.02 | 23 | 0.24 | 6 | 4.38 |
| 1966/67 | 2.92 | 63 | 1.33 | 28 | 0.42 | 9 | 5.44 |
| 1967/68 | 2.86 | 66 | 1.19 | 28 | 0.26 | 6 | 4.31 |
| 1968/69 | 3.21 | 61 | 1.76 | 34 | 0.26 | 5 | 5.24 |
| 1969/70 | 3.07 | 65 | 1.43 | 30 | 0.24 | 5 | 4.74 |
| 1970/71 | 2.69 | 59 | 1.54 | 34 | 0.30 | 7 | 4.52 |
| 1971/72 | 4.24 | 66 | 1.77 | 27 | 0.46 | 7 | 6.47 |
| 1972/73 | 0.84 | 46 | 0.80 | 44 | 0.17 | 9 | 1.81 |
| 1973/74 | 1.02 | 41 | 1.14 | 45 | 0.35 | 14 | 2.52 |
| 1974/75 | 1.03 | 42 | 1.06 | 43 | 0.37 | 15 | 2.46 |
| 1975/76 | 1.29 | 37 | 1.79 | 51 | 0.43 | 12 | 3.51 |
| 1976/77 | 1.14 | 38 | 1.62 | 53 | 0.28 | 9 | 3.04 |
| 1977/78 | 1.68 | 38 | 2.20 | 49 | 0.58 | 13 | 4.46 |
| 1978/79 | 2.06 | 36 | 3.03 | 53 | 0.63 | 11 | 5.72 |
| 1979/80 | 2.10 | 40 | 2.45 | 47 | 0.69 | 13 | 5.24 |
| 1980/81 | 2.29 | 44 | 2.34 | 145 | 0.58 | 11 | 5.21 |
RESULTADOS
Estimados de las Poblaciones (Tabla 1, Fig. 2)
Los resultados de las evaluaciones de las aves guaneras hasta el ciclo reproductivo 1973/74 fueron dadas a conocer por Tovar (1978) citando como nivel poblacional para el referido ciclo reproductivo 2.52 millones de aves cuya composición por especies fue 45, 41 y 14% de piquero, guanay y alcatraz, respectivamente. Durante el ciclo 1974/75, la población se mantuvo relativamente en el mismo nivel. En cambio, durante el ciclo reproductivo 1975/76, la magnitud poblacional fue de 3.51 millones que representan un incremento del 43%; durante el ciclo 1976/77, como consecuencia de anomalías térmicas en la superficie del mar, hubo una disminución de medio millón de aves, llegando a 3.04 millones de aves compuesto por 53, 38 y 9% de piquero, guanay y alcatraz, respectivamente. Como consecuencia del notable afloramiento en la costa peruana, principalmente al sur de 14°S en 1978, las aves guaneras aumentaron su nivel poblacional hasta 4.46 millones en el ciclo reproductivo 1977/78, el ascenso poblacional continuó en el ciclo reproductivo 1978/79, llegando al nivel de 5.72 millones, constituido por 53, 36 y 11% de piquero, guanay y alcatraz o pelícano, respectivamente. La población durante el ciclo reproductivo 1979/80 fue de 5.04 millones, el doble que en 1973/74, manteniíndose la composición por especies en los mismos niveles.
| Durante el ciclo reproductivo
1980/81, el nivel poblacional llegó
a 5.21 millones, constituido por
45, 55 y 11% de piquero, guanay y
alcatraz, respectivamente.
Para una mejor comprensión de la situación poblacional de las aves, se analizan en forma independiente cada una de las especies de aves guaneras. La población de guanay: Para analizar la fluctuación poblacional de guanay se consideró como punto de referencia el ciclo reproductivo 1960/61 con 9.44 millones de aves adultas, en 1961/62 la población fue estimada en 13.70 millones y en 1962/63 continuó el ascenso de la población de guanay llegando al nivel de 4.89 millones; pero en el ciclo reproductivo 1963/ 64 se produce una considerable mortandad de aves a consecuencia de alteraciones en las condiciones oceanográficas que según Jordán y Fuentes (1966) determinaron cambios en la distribución vertical de la anchoveta haciéndola inaccessible a las aves. En este ciclo reproductivo el nivel poblacional de guanay se estimó en 3.12 millones, permaneciendo estacionario en cerca de 3 millones hasta el ciclo reproductivo 1970/71, con un ascenso hasta 4.24 millones en 1971/72. A consecuencia del Fenómeno “El Niño” de 1972, esta población descendió a 0.84 millones en el ciclo 1972/73, ascendiendo a 1.02 millones en 1973/74, donde permaneció estacionaria con ligeras variaciones hasta 1976/77. A partir de 1977/78 comenzó el ascenso llegando a 2.29 millones en 1980/81. | 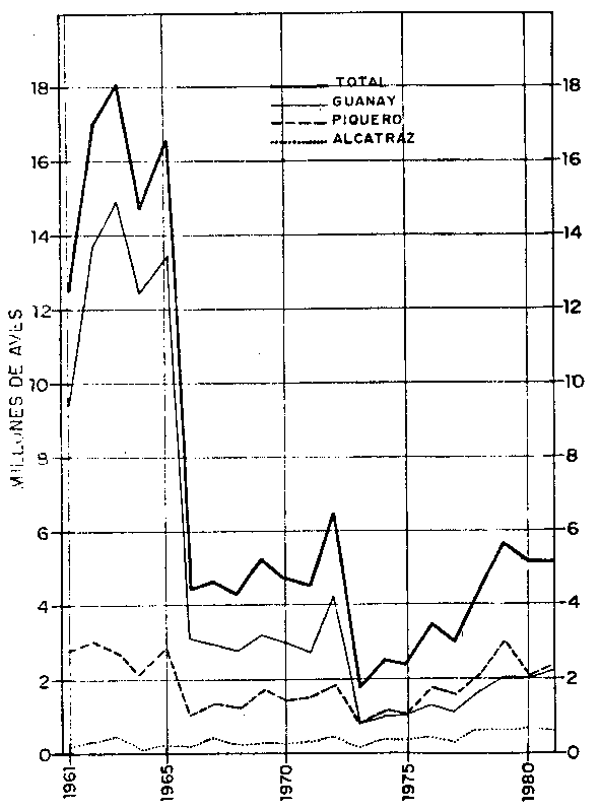 Fig. 2.- Aves guaneras adultas en cada ciclo reproductivo. |
Población de piquero:
El piquero es otra de las especies productoras del fertilizante orgánico conocido como “guano de islas”.
De la misma forma que para la especie anterior, para el piquero se parte del nivel
poblacional del ciclo reproductivo 1060/61 con 2.85 millones, notando un ligero aumento
de 0.14 millones en 1961/62; en los siguientes años se nota un descenso poblacional llegando a su nivel más crítico en 1972/73 con 0.80 millones que representa sólo el 28% de la
población inicial. La población llegó a este nivel cr tico a consecuencia del Fenómeno
“El Niño” en 1972, que produjo una depresión ecológica en el mar peruano. Una ves normalizadas las condiciones ambientales marinas, el nivel poblacional comenz ō
a recuperarse; inclusive en 1978/79 llegō a superar el nivel inicial en 5%, descendiendo nuevamente en
los siguientes ciclos reproductivos, llegando a 1980/81 con 2. 34 millones.
Población de alcatraz o pelícano:
Cuantitativamente el alcatraz es la especie de menor importancia por su reducido nivel poblacional ocupando normalmente el tercer lugar despuēs del guanay y piquero; además produce un fertilizante de baja calidad.
Durante el ciclo reproductivo 1960/61, el nivel poblacional de alcatraz llegō a 0.27 millones de aves. En los ciclos reproductivos 1963/64 y 1972/73 la poblaciōn bajó hasta 0.12 y 0.17 millones de aves respectivamente; aparentemente las alteraciones del medio ambiente marino no ocasionaron fluctuaciones de tanta consideración como ocurrió principalmente en guanay. Por el contrario, en los últimos años de la dēcada del 70 se nota un aumento considerable de la población llegando a 1980/81 con 0.58 millones, que representa un aumento del nivel poblacional en mas del 100% con respecto a 1960/61, sugiriendo que el alcatraz es la única especie que no fue afectada por los altos volúmenes de captura de anchoveta para la industria y las alteraciones del medio ambiente marino ocurridos en los últimos años.
Composición por Especies (Tabla 1, Fig. 3)
Hay evidencias que desde tiempos remotos, el guanay siempre predominó entre las especies de aves productoras de guano de islas. Vogt (1942) cita en orden de importancia primero al guanay seguido de piquero y alcatraz; la Compañ ī a Administradora de Guano (1954) refiere que el guanay produce el 85% del fertilizante; Gamarra (1955) al analizar datos de 1946, obtiene como resultado los porcentajes de 81, 17 y 2% correspondientes al guanay, piquero y alcatraz, respectivamente; Jordán (1963) para el ciclo reproductivo 1961/62 obtiene los siguientes porcentajes: guanay 80%, piquero 18% y alcatraz 2%; Jordán y Fuentes (1965) tambiēn refieren que la composiciōn por especies fue de 82, 15 y 2% de guanay, piquero y alcatraz, respectivamente; Fuentes (1969) al analizar datos del ciclo reproductivo 1968/69, determina que la población de aves guaneras estuvo compuesta por 58, 37 y 5% de guanay, piquero y alcatraz, indicando que la composición por especies de la población de aves guaneras estaba cambiando; Tovar (1978) al analizar datos del ciclo reproductivo 1973/74, determinó que el piquero llegó al primer lugar con 45%, guanay con 41% y alcatraz con 14%. Las ūltimas evaluaciones de poblaciones indican que el guanay continuó descendiendo, llegando a 1978/79 con 53, 36 y 11% de piquero, guanay y alcatraz, respectivamene; durante 1980/81 los niveles porcentuales fueron de 45, 44 y 11% de piquero, guanay y alcatraz, respectivamente.
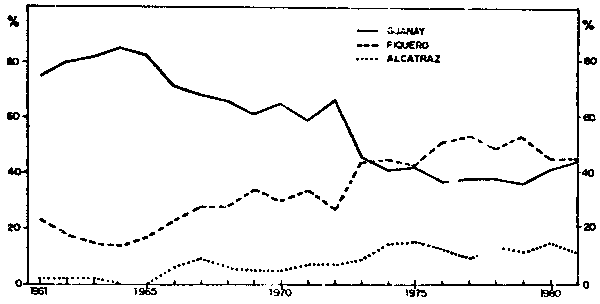
Fig. 3.- Composición por especies de la población de aves guaneras en cada ciclo reproductivo de 1960/61 a 1980/81.
Estos significativos cambios en la composición por especies se hallan íntimamente relacionados a la escasa disponibilidad de recurso anchoveta que a su vez está relacionado con las alteraciones de las condiciones ambientales marinas, más conocidas como Fenómeno “El Niño” y el desarrollo acelerado de la pesquería de anchoveta. La anchoveta es el alimento principal del guanay, mientras que las otras dos especies de aves guaneras pueden cambiar o reemplazar la anchoveta por otros peces y lógicamente por esta razón, el guanay fue la especie más afectada por la reducción de la población de anchoveta.
Alimentación
El alimento, como en cualquier comunidad zoológica, es fundamental; y en el caso específico de las aves guaneras, desempeñó un rol muy importante en el normal desarrollo poblacional y composiciōn específica.
Según Vogt (1942), la presencia de grandes bandadas de aves obedecen a la presencia de grandes cardúmenes de anchoveta, Avila (1954) y Jordān (1959) refieren que el guanay se alimenta principalmente de anchoveta. Sin embargo, es necesario tener presente que las referidas investigaciones fueron realizadas cuando el recurso anchoveta se hallaba en su fase inicial de explotación; es decir, que la anchoveta era abundante y se encontraba disponible para las aves. Pero el desarrollo acelerado de la industria de la harina de anchoveta obligó a capturar cada año mayores volúmenes de anchoveta, convirtiendo al hombre en un desleal competidor de las aves, ahondando más el problema. Los cambios temporales y cíclicos de las condiciones ambientales marinas a causa del fenómeno conocido como “El Niño”, influyeron también poderosamente en las fluctuaciones de poblaciones de aves.
Tovar (en prensa) determinó que en septiembre y octubre de 1977, durante la escasez de anchoveta, las aves estuvieron alimentándose de otras especies ícticas como: lorna (Sciaena deliciosa), anchoveta blanca (Anchoa sp.), coco (Paralonchurus peruanus), cabinza (Isacia conceptionist), (Bagre sp.), anchoveta (Engraulis ringens), ayanque o cachema (Cynoscion analis), corvinilla (Sciaena gilberti) y otras seis especies mās; mientras que a partir de noviembre de 1977 a marzo de 1978, nuevamente el guanay estuvo alimentándose de anchoveta.
Estas faltas de disponibilidad del recurso anchoveta para la alimentación de las aves
guaneras originaron fluctuaciones y cambios en la composición por especies, porque cada
una de las tres especies tienen diferentes modalidades para obtener su alimento: a) el
quanay busca su alimento en grandes bandadas y precisa de cardúmenes grandes de anchoveta, la captura la efectúan mediante buceos y son más dependientes del recurso anchoveta,
razōn por la cual la poblaci n de guanay bajó considerablemente por la escasez de anchoveta
y de la cual hasta ahora no puede recuperarse; b) el piquero busca su alimento en pequeñas
bandadas y lógicamente necesita de pequeños cardúmenes, dependiendo en menor grado de la
disponibilidad de anchoveta; la captura la realizan mediante descensos rápidos y en picada
desde aproximadamente 40 metros de altura ; y c) el alcatraz o pelícano, a semejanza del
piquero, no depende de grandes cardúmenes y pesca en forma solitaria. Además está incapacitado para bucear por tener sacos aéreos en el pectoral y cuello, razón por la cual
esta especie se alimenta de peces que se hallan en la superficie, ademas están capacitados
para alimentarse de peces más grandes; es posible que ésto motivó que la población de esta
especie no fuera afectada, por el contrario la poblacional ha aumentado.
Exito reproductivo (Tabla 2, Fig. 4)
El ciclo reproductivo de las aves guaneras se halla íntimamente relacionado a la época de mayor y major disponibilidad de los recursos ícticos, principalmente de la anchoveta; por esta razón, el ciclo reproductivo de las aves comienza generalmente en noviembre de cada año y concluye en febrero-marzo del siguiente año, teniendo en cuenta que el guanay necesita de cuatro meses para cumplir su ciclo reproductivo, un mes de celo, un mes de incubación, incluido la postura, y dos meses de cuidado de los pichones.
| CICLO REPRODUCTIVO | CANTIDAD (en millones) | PORCENTAJE DE REPRODUCCION | |
|---|---|---|---|
| ADULTOS | POLLUELOS | ||
| 1960/61 | 12.56 | 4.91 | 39 |
| 1961/62 | 17.01 | 11.76 | 69 |
| 1962/63 | 18.07 | 12.84 | 71 |
| 1963/64 | 14.72 | 6.01 | 41 |
| 1964/65 | 16.51 | 8.60 | 52 |
| 1965/66 | 4.38 | 0.04 | 1 |
| 1966/67 | 4.64 | 2.09 | 47 |
| 1967/68 | 4.31 | 1.58 | 37 |
| 1968/69 | 5.24 | 2.00 | 35 |
| 1969/70 | 4.74 | 2.10 | 44 |
| 1970/71 | 4.52 | 1.85 | 41 |
| 1971/72 | 6.47 | 2.80 | 43 |
| 1972/73 | 1.81 | 0 | 0 |
| 1973/74 | 2.52 | 0.70 | 28 |
| 1974/75 | 2.46 | 0.64 | 26 |
| 1975/76 | 3.51 | 0.90 | 26 |
| 1976/77 | 3.04 | 0.58 | 25 |
| 1977/78 | 4.46 | 0.96 | 22 |
| 1978/79 | 5.72 | 1.31 | 23 |
| 1979/80 | 5.24 | 1.79 | 35 |
| 1980/81 | 5.21 | 1.90 | 36 |
|
CICLO | GUANAY | PIQUERO | ALCATRAZ | TOTAL | |||
|---|---|---|---|---|---|---|---|
| Cantidad | % | Cantidad | % | Cantidad | % | ||
| 1960/61 | 3.76 | 76 | 1.06 | 22 | 0.09 | 2 | 4.91 |
| 1961/62 | 9.08 | 78 | 2.30 | 19 | 0.38 | 3 | 11.76 |
| 1962/63 | 10.53 | 82 | 1.93 | 15 | 0.38 | 3 | 12.34 |
| 1963/64 | 5.75 | 96 | 0.22 | 3 | 0.04 | 1 | 6.01 |
| 1964/65 | 6.47 | 75 | 2.00 | 23 | 0.13 | 2 | 8.60 |
| 1965/66 | 0.004 | 9 | 0.03 | 68 | 0.01 | 23 | 0.04 |
| 1966/67 | 1.27 | 61 | 0.51 | 24 | 0.31 | 15 | 2.09 |
| 1967/68 | 0.92 | 58 | 0.51 | 32 | 0.15 | 10 | 1.58 |
| 1968/69 | 0.99 | 49 | 0.92 | 46 | 0.09 | 5 | 2.00 |
| 1969/70 | 1.57 | 75 | 0.37 | 17 | 0.16 | 8 | 2.10 |
| 1970/71 | 1.15 | 62 | 0.58 | 31 | 0.12 | 7 | 1.85 |
| 1971/72 | 1.78 | 64 | 0.61 | 22 | 0.41 | 15 | 2.80 |
| 1972/73 | 0 | 0 | 0 | 0 | 0 | 0 | 0 |
| 1973/74 | 0.12 | 17 | 0.54 | 77 | 0.04 | 6 | 0.70 |
| 1974/75 | 0.17 | 27 | 0.32 | 50 | 0.15 | 23 | 0.64 |
| 1975/76 | 0.61 | 68 | 0.27 | 30 | 0.02 | 2 | 0.90 |
| 1976/77 | 0.14 | 24 | 0.33 | 57 | 0.11 | 19 | 0.58 |
| 1977/78 | 0.40 | 42 | 0.26 | 27 | 0.30 | 31 | 0.96 |
| 1978/79 | 0.55 | 42 | 0.57 | 43 | 0.19 | 15 | 1.31 |
| 1979/80 | 0.65 | 21 | 1.09 | 78 | 0.05 | 2 | 1.79 |
| 1980/81 | 1.03 | 54 | 0.74 | 39 | 0.13 | 7 | 1.90 |
El éxito reproductivo se determinó a base de la información sobre estado reproductivo que incluyen en los censos mediante gráficos de áreas ocupadas por aves con pichones y huevos; pero el éxito reproductivo depende de magnitud y disponibilidad de las fuentes de alimentación.
La tasa de reproducción fue calculado a base de la proporción de polluelos con respecto al total de adultos en cada ciclo reproductivo.
La tasa de reproducción en 1960/61 fue de 39%, llegando a 1962/63 con 71% que representa la tasa más alta porque en los siguientes años fue descendiendo. Inclusive durante 1965 y 1972, a causa de anomalías oceanográficas en el mar peruano, las tasas de reproducción fueron bajísimas. Después de 1972 las tasas de reproducción no llegaron al 30% a excepción de 1979/80 y en 1980/81 que fue de 35% y 36% como se verá más adelante, muchas veces estas tasas de reproducción no se concretan en un incremento.
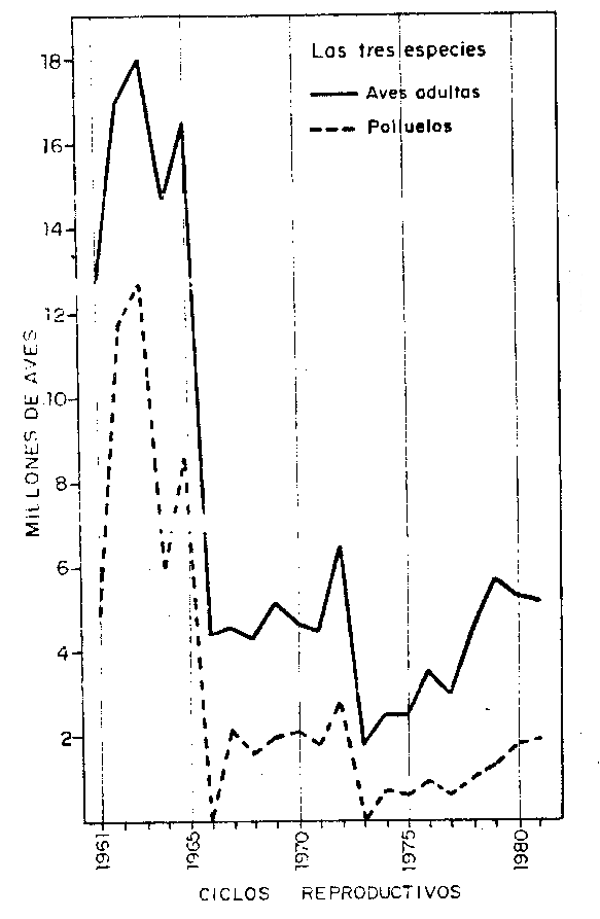
Fig. 4a.- Aves adultas y polluelos en cada ciclo reproductivo, a base de censos gráficos. | 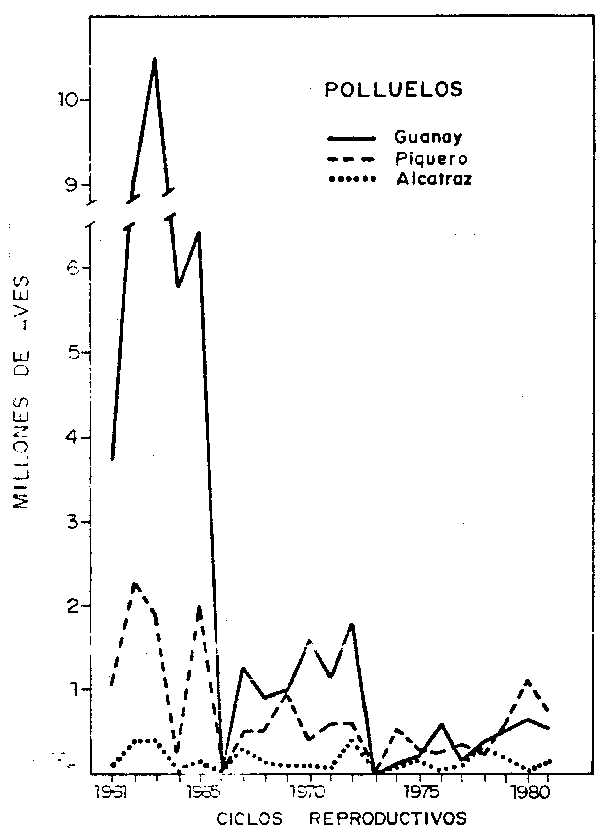
Fig. 4b.- Cantidad de polluelos en cada ciclo reproductivo. |
Reproducción de guanay (Tabla 3, Fig. 5):
Debido a la mortalidad de aves ocurrida en 1957/58 a causa del fenómeno oceanográfico conocido como “El Niño”, la población quedó reducida estimándose en 1960/61 en 9.44 millones. En este ciclo el porcentaje de reproducción fue del 40%; en los siguientes dos años aumentó a 70% en 1962/63 luego disminuyó en los siguientes años, e inclusive durante 1965 y 1972, a causa de anomalías oceanográficas, el porcentaje de reproducción fue cero; a partir de 1972/73 se acentuó más el descenso del porcentaje de reproducción de guanay con 31% en 1979/80, para nuevamente ascender a 45% en 1980/81.
Reproducción de piquero (Tabla 4, Fig. 6) :
Efectuando el análisis de la misma forma que para la especie anterior, la población de piqueros tuvo porcentajes de reproducción con 77 y 70% en los años 1961/62 y 1962/63, respectivamente; en los siguientes años los porcentajes fueron descendiendo, llegando a niveles más críticos, de 3% en 1965/66 y cero en 1972/73, a causa de la presencia de anomalías oceanográficas. El porcentaje promedio para 1966/67 y 1971/72 fue de 38%, en los siguientes años, de 1973/74 a 1979/80, que tuvieror como porcentaje de reproducción 19% a excepción de los años 1973/74 y 1979/80 que tuvieron como tasa 47 y 44%, respectivamente. Finalmente, para 1980/81, al porcentaje de reproducción fue de 32%.
Estos datos indican que en los últimos años las tasas anuales de reproducción fueron muy bajas para el piquero.
Reproducción de alcatraz o pelícano (Tabla 5, Fig. 6):
A diferencia de las dos especies anteriores, el alcatraz, estuvo sometida a fluctuaciones muy irregulares, sin embargo es la única especie que tuvo los porcentajes más altos de reproducción, a excepción de 1, 4, 0, 5 y 7% para los años 1961/62, 1965/66, 1972/73, 1975/76 y 1979/80, respectivamente. En los años restantes tuvo una reproducción promedio de 57%, con los procentajes más altos de 90, 89 y 107%, respectivamente, para los años 1962/63, 1971/72 y 1976/77. El nivel poblacional de esta especie fue de 0.42 millones en 1962/63, y en 1980/81 fue de 0.58 millones, con un incremento de 38% en dicho período.
Es necesario aclarar que esta especie puede alimentarse de anchoveta y además de otros peces, incluyendo peces más grandes, por lo cual soporta mejor la ausencia o falta de disponibilidad de anchoveta.
|
CICLO REPRODUCTIVO | CANTIDAD (en millones) |
PORCENTAJE DE |
|
|---|---|---|---|
| ADULTOS | POLLUELOS | ||
| 1960/61 | 9.44 | 3.76 | 40 |
| 1961/62 | 13.70 | 9.08 | 66 |
| 1962/63 | 14.89 | 10.53 | 70 |
| 1963/64 | 12.46 | 5.75 | 46 |
| 1964/65 | 13.46 | 6.47 | 48 |
| 1965/66 | 3.12 | 0.004 | 0 |
| 1966/67 | 2.92 | 1.27 | 43 |
| 1967/68 | 2.86 | 0.92 | 32 |
| 1968/69 | 3.21 | 0.99 | 31 |
| 1969/70 | 3.07 | 1.57 | 51 |
| 1970/71 | 2.69 | 1.15 | 42 |
| 1971/72 | 4.24 | 1.78 | 41 |
| 1972/73 | 0.84 | 0 | 0 |
| 1973/74 | 1.02 | 0.12 | 12 |
| 1974/75 | 1.03 | 0.17 | 15 |
| 1975/76 | 1.29 | 0.61 | 47 |
| 1976/77 | 1.14 | 0.14 | 12 |
| 1977/78 | 1.68 | 0.40 | 24 |
| 1978/79 | 2.06 | 0.55 | 27 |
| 1979/80 | 2.10 | 0.65 | 31 |
| 1980/81 | 2.29 | 1.03 | 45 |
|
CICLO | CANTIDAD (en millones) | PORCENTAJE DE REPRODUCCION | |
|---|---|---|---|
| ADULTOS | POLLUELOS | ||
| 1960/61 | 2.85 | 1.06 | 37 |
| 1961/62 | 2.99 | 2.30 | 77 |
| 1962/63 | 2.76 | 1.93 | 70 |
| 1963/64 | 2.13 | 0.22 | 10 |
| 1964/65 | 2.82 | 2.00 | 53 |
| 1965/66 | 1.02 | 0.03 | 3 |
| 1966/67 | 1.33 | 0.51 | 46 |
| 1967/68 | 1.19 | 0.51 | 43 |
| 1968/69 | 1.76 | 0.92 | 42 |
| 1969/70 | 1.43 | 0.37 | 26 |
| 1970/71 | 1.54 | 0.58 | 38 |
| 1971/72 | 1.77 | 0.61 | 34 |
| 1972/73 | 0.80 | 0 | 0 |
| 1973/74 | 1.14 | 0.54 | 47 |
| 1974/75 | 1.06 | 0.32 | 30 |
| 1975/76 | 1.79 | 0.27 | 15 |
| 1976/77 | 1.62 | 0.33 | 20 |
| 1977/78 | 2.20 | 0.26 | 12 |
| 1978/79 | 3.03 | 0.57 | 19 |
| 1979/80 | 2.45 | 1.09 | 44 |
| 1980/81 | 2.34 | 0.74 | 32 |
| CICLO REPRODUCTIVO | CANTIDAD (en millones) | PORCENTAJE DE REPRODUCCION | |
|---|---|---|---|
| ADULTOS | POLLUELOS | ||
| 1960/61 | 0.27 | 0.09 | 33 |
| 1961/62 | 0.32 | 0.38 | 118 |
| 1962/63 | 0.42 | 0.38 | 90 |
| 1963/64 | 0.42 | 0.04 | 33 |
| 1964/65 | 0.23 | 0.13 | 56 |
| 1965/66 | 0.24 | 0.01 | 4 |
| 1966/67 | 0.42 | 0.31 | 74 |
| 1967/68 | 0.26 | 0.15 | 58 |
| 1968/69 | 0.26 | 0.09 | 35 |
| 1969/70 | 0.24 | 0.16 | 67 |
| 1970/71 | 0.30 | 0.12 | 40 |
| 1971/72 | 0.46 | 0.41 | 89 |
| 1972/73 | 0.17 | 0 | 0 |
| 1973/74 | 0.35 | 0.04 | 14 |
| 1974/75 | 0.37 | 0.15 | 40 |
| 1975/76 | 0.43 | 0.02 | 5 |
| 1976/77 | 0.28 | 0.11 | 107 |
| 1977/78 | 0.58 | 0.30 | 52 |
| 1978/79 | 0.63 | 0.19 | 30 |
| 1979/80 | 0.69 | 0.05 | 7 |
| 1980/81 | 0.58 | 0.13 | 22 |
| CICLO REPRODUCTIVO | CANTIDAD (en millones) | PORCENTAJE DE INCREMENTO (%) |
PORCENTAJE DE MORTALIDAD | ||
|---|---|---|---|---|---|
|
ADULTOS |
POLLUELOS | ||||
| ADULTOS | POLLUELOS | ||||
| 1960/61 | 12.56 | 4.91 | - | - | - |
| 1961/62 | 17.01 | 11.76 | 35 | 0 | 9 |
| 1962/63 | 18.07 | 12.84 | 6 | 0 | 91 |
| 1963/64 | 14.72 | 6.01 | 0 | 18 | 100 |
| 1964/65 | 16.51 | 8.10 | 12 | 0 | 70 |
| 1965/66 | 4.38 | 0.04 | 0 | 73 | 100 |
| 1966/67 | 4.64 | 2.09 | 6 | 0 | 0 |
| 1967/68 | 4.31 | 1.58 | 0 | 7 | 100 |
| 1968/69 | 5.24 | 2.00 | 22 | 0 | 41 |
| 1969/70 | 4.74 | 2.10 | 0 | 10 | 100 |
| 1970/71 | 4.52 | 1.85 | 0 | 5 | 100 |
| 1971/72 | 6.47 | 2.80 | 43 | 0 | 0 |
| 1972/73 | 1.81 | 0 | 0 | 72 | 100 |
| 1973/74 | 2.52 | 0.70 | 39 | 0 | 0 |
| 1974/75 | 2.46 | 0.64 | 0 | 2 | 100 |
| 1975/76 | 3.51 | 0.90 | 43 | 0 | 0 |
| 1976/77 | 3.04 | 0.58 | 0 | 13 | 100 |
| 1977/78 | 4.46 | 0.96 | 47 | 0 | 0 |
| 1978/79 | 5.72 | 1.31 | 28 | 0 | 0 |
| 1979/80 | 5.24 | 1.79 | 0 | 12 | 100 |
| 1980/81 | 5.21 | 1.90 | 3 | 0 | 0 |
| CICLO REPRODUCTIVO | CANTIDAD (en millones) | PORCENTAJE DE INCREMENTO (%) | PORCENTAJE DE MORTALIDAD | ||
|---|---|---|---|---|---|
| ADULTOS | POLLUELOS | ADULTOS | POLUELOS | ||
| 1960/61 | 9.44 | 3.76 | - | - | - |
| 1961/62 | 13.70 | 9.08 | 45 | 0 | 0 |
| 1962/63 | 14.89 | 10.53 | 9 | 0 | 87 |
| 1963/64 | 12.46 | 5.75 | 0 | 16 | 100 |
| 1964/65 | 13.46 | 6.47 | 8 | 0 | 83 |
| 1965/66 | 3.12 | 0.004 | 0 | 77 | 100 |
| 1966/67 | 2.92 | 1.27 | 0 | 6 | 0 |
| 1967/68 | 2.86 | 0.92 | 0 | 2 | 100 |
| 1968/69 | 3.21 | 0.99 | 12 | 0 | 62 |
| 1969/70 | 3.07 | 1.57 | 0 | 4 | 100 |
| 1970/71 | 2.69 | 1.15 | 0 | 12 | 100 |
| 1971/72 | 4.24 | 1.78 | 58 | 0 | 0 |
| 1972/73 | 0.84 | 0 | 0 | 80 | 100 |
| 1973/74 | 1.02 | 0.12 | 21 | 0 | 0 |
| 1974/75 | 1.03 | 0.17 | 1 | 0 | 92 |
| 1975/76 | 1.29 | 0.61 | 25 | 0 | 0 |
| 1976/77 | 1.14 | 0.14 | 0 | 12 | 100 |
| 1977/78 | 1.68 | 0.40 | 47 | 0 | 0 |
| 1978/79 | 2.06 | 0.55 | 23 | 0 | 5 |
| 1979/80 | 2.10 | 0.65 | 2 | 0 | 92 |
| 1980/81 | 2.29 | 1.03 | 9 | 0 | 71 |