![]()
![]()
![]()
Modernization of Irrigation Schemes: Synthesis of Country Papers - Thierry Facon
Modernization of Irrigation Schemes in Bangladesh - M.A. Matin
Modernization of Irrigation Schemes in China - Zhang Hansong
Modernization of Irrigation Schemes in India: A Strategic Need for Planning - B.N. Navalawala
Modernization of Irrigation Schemes in the Republic of Korea - Bong-Hoon Lee
Modernization of Irrigation Schemes in Malaysia - Teh Siew Keat
Modernization of Irrigation Schemes in Pakistan - Muhammad Yasin and Shahid Ahmad
Modernization of Irrigation Schemes in the Philippines - Rodolfo Undan
Modernization of Irrigation Schemes: Past Experiences and Future Options in Sri Lanka - Ranjith Ratnayake
Modernization of Irrigation Schemes in Thailand - Siripong Hungspreug
Thierry Facon
Technical Officer, Water Resources, Development and
Management Service,
Food and Agricultural Organization of the United Nations
(FAO), Rome, Italy
For each of the nine Asian countries represented at the Expert Consultation on Modernization of Irrigation Schemes, a country paper was prepared and presented during the meeting. These papers, which follow a common format, briefly introduce the national water sector and irrigation subsector, describe government policies for modernization programmes and their institutional aspects, assess their impact, discuss future trends in modernization, and illustrate modernization programmes and issues with case studies.
There is, of course, a great heterogeneity among the nine countries in terms of natural resources endowment, agro-ecology and climate, agricultural, technical and institutional features of the irrigation subsector. However, to a varying degree, all countries face increasing water scarcity, share concerns related to the inefficiency and decay of the irrigation infrastructure, and are undergoing a process of reform of the management of the subsector.
Similarly, regional trends of macro-economic and institutional reform and of economic growth at the same time impose a transformation of the irrigation subsector and provide a conducive environment to the improvement of its performance.
As a result, there seems to be a general recognition of the need to modernize irrigation schemes, and all countries are described as being engaged in modernization programmes at various stages of implementation, from concept development to full implementation. However, the understanding of “modernization” varies greatly among the authors of the country papers and there are significant differences on how these modernization programmes are driven.
Because of the great differences in country circumstances and also in the technical focus of the country papers, it was not an easy task to prepare a synthesis of these papers. This paper in fact does not attempt to make a full synthesis and comparative analysis. Rather, after two summary tables presenting the main physical, technical and institutional features of national irrigation systems, the paper discusses how various aspects of socio-economic development both impose and facilitate an improvement of the performance of the irrigation schemes, and changes in their financing, goals and operation. The main issues, responses and associated measures related to modernization policies and programmes are then presented, followed by an assessment of the status of modernization programmes in each country. The actual contents, or lack of specific meaning, of modernization, and related approaches are then discussed.
Finally, several country papers raise common issues and share concerns over the feasibility of modernization programmes, which are presented for discussion during the meeting.
NATIONAL LAND AND WATER RESOURCES AND IRRIGATION SUBSECTORS
Table 1 summarizes and qualifies, for each country, perceived constraints concerning the availability of water and land resources for irrigated agricultural production. In Sri Lanka, Pakistan, China and India, projections show a water deficit in the short- to medium-term and the water constraint is therefore defined as absolute. In the other countries, water availability for agricultural production is also considered an important constraint, which is defined as relative as there still exists a potential for further water resources development. In all countries, competition for developed or future water resources from other sectors will require an improvement in irrigation water use efficiency. Groundwater depletion (Bangladesh) and salinization (Pakistan) are serious causes for concern.
TABLE 1: MAIN PHYSICAL FEATURES OF IRRIGATION SUB-SECTOR
Land resources are not considered as an important constraint except in the most densely populated countries. Net losses of agricultural land to waterlogging, salinization and urbanization are important phenomena.
Because of the great climatic diversity (from arid to monsoon, to humid tropical and equatorial) among and within the countries, the need to irrigate main staple and secondary crops also varies widely across countries.
Most countries present a mixture of small, medium and large irrigation schemes, the extremes being Pakistan on the one side with the 16 million ha Indus system, and Bangladesh on the other where most irrigation is under groundwater-supplied small schemes. In a great majority of schemes, water conveyance, distribution and on-farm application are by gravity.
Sources of water supply are also quite diverse. Poorly regulated surface water resources are a specific constraint in Pakistan, Republic of Korea and the Philippines. Recent irrigation development in Bangladesh is groundwater-based, but in view of the depletion of aquifers, surface schemes will be developed in the future. Conjunctive use is particularly developed in Pakistan and India to compensate for rigid varabandi irrigation schemes.
TABLE 2: INSTITUTIONAL FEATURES OF IRRIGATION SUB-SECTOR
Table 2 presents, for each country, the main institutional features as well as funding sources for investment in irrigation infrastructure and operation and maintenance (O&M) of irrigation schemes. Public sector agencies (with, usually, a distribution of authority and responsibilities among central, federal state and other local political levels) and institutions still play a major role in irrigation management and development. However, most countries are undergoing a process of irrigation management transfer and/or privatization (IMT/PIM), in parallel to a more general process of political and administrative decentralization. Bangladesh, which has privatized tubewell equipment supply and irrigation services, represents a particular case. The degree of progress but also of success of IMT programmes varies among countries: from a fairly advanced and successful stage with functional water users’ associations in the Philippines to rather disappointing pilot projects in Pakistan and established but non-functioning water user associations (WUAs) in the Republic of Korea.
TABLE 3
Implications and opportunities of socio-economic
development
|
· From subsistence to
commercial farming |
® |
Profitability, consolidation, variability |
|
· Changing food and fibre
consumption patterns |
® |
Diversification of cropping patterns |
|
· Increased income
expectations |
® |
Farm labour costs, labour shortages, rural exodus |
|
· Increased competition for
natural resources |
® |
Diversion from existing water supply to other
sectors |
|
· Increased budget
resources |
® |
Possibility to finance large investment programmes |
|
· Increased competition for
budget resources |
® |
Closer scrutiny of investment programmes |
|
· Change in economic
policies |
® |
Decrease subsidies |
|
· Stronger banking system,
savings and private capital funding |
® |
New options for financing irrigation development |
|
· Decentralization
(political, administrative, fiscal) |
® |
New options for irrigation planning and management |
|
· Growing awareness of
environmental problems |
® |
Environmental impact assessment Mitigation of environmental
impacts Improved water and other input use efficiency |
|
· Higher levels of
education |
® |
Shifts in extension and training methods |
|
· Enhanced technology
environment |
® |
Information, communication, automation,
mechanization |
|
· Better service
environment |
® |
Greater demand on and accountability of services |
|
· And new management
concepts |
® |
Change in service functions |
|
|
|
Capacity to transfer functions to other operators |
|
· Developed industrial
sector |
® |
Local development and manufacture of irrigation
equipment |
SOME CONSIDERATIONS ON SOCIO-ECONOMIC DEVELOPMENT AND IRRIGATION MODERNIZATION
Most of the countries in the region are undergoing deep societal and socio-economic transformations, characterized by fast economic growth, especially in the industrial and services sectors, liberal macro-economic policies, development of trade, reforms and privatizations in the public sector and institutions, development of the civil society, and growing awareness of environmental issues and problems. These trends can be found as a common thread in most of the country papers. In general, it is estimated that these profound changes in the environment call for a deep transformation of the irrigation subsector, most notably an improvement of its economic, technical, and environmental performance, diversification of produce and cropping patterns, changes in management systems and structures, financial and fiscal sustainability.
On the other hand, improved levels of education and of technological environment, more dynamic markets and diversified financing systems, more efficient and decentralized administration, and new management models, constitute many favourable conditions for an improvement of the performance of the irrigation sub-sectors and modernization of irrigation schemes. Table 3 presents a synthesis of the driving forces of socio-economic development as they may affect the modernization of irrigation schemes. Some of the considerations found in this table are referred to explicitly in the country papers while others are more implicit.
It should be noted that, according to their present level of development, and related relative importance of the agricultural sector in the national economy, relationships between the agricultural sector and other sectors differ. For countries such as the Republic of Korea or Malaysia, the development of the overall economy will determine the transformation of the agricultural sector and national policy goals for the modernization of irrigation, whereas in countries such as Pakistan, India or the Philippines, modernization of irrigation as support to agricultural development is considered as important or vital to the national economy; achieving national food security in those countries will continue to depend primarily on self-sufficiency in major food crops while, in richer countries, the issue is to maintain a strategic minimum level of national production, through direct support and subsidies to national producers if necessary.
An important factor is also farm and non-farm labour costs. The more developed the country, the more important and difficult it is for farming to generate income levels competitive with other sectors and the more the minimization of farm labour costs and irrigation agency staff costs is a consideration in the irrigation technology and operation and maintenance of irrigation schemes.
MAIN ISSUES IN THE MODERNIZATION OF IRRIGATION SCHEMES
The adoption by governments of modernization policies and programmes, more specifically, is in reponse to four main issues which are more directly related to the irrigation subsector. These are:
TABLE 4
Main issues in irrigation scheme
modernization
|
ISSUE |
RESPONSE |
MEASURES |
|
Population growth and national food security
|
® Increase and secure food production
|
® Augmenting irrigated land and/or cropping
intensity |
|
® Reclaiming land |
||
|
® Maintaining soil fertility |
||
|
® Upkeeping irrigation system |
||
|
® Reducing yield gap |
||
|
® Improving crop husbandry |
||
|
® Strengthening of agricultural support
services |
||
|
® Developing a conducive environment
for agricultural investment |
||
|
® Increasing profitability of agriculture |
||
|
Water resources constraint
|
® Protection of water resources Water resource
management (quantity and quality) |
|
|
® Further development of surface water
resources |
|
|
|
® Develop conjunctive use |
|
|
|
® Develop alternative water resources |
|
|
|
® Optimize rainfall use Improve irrigation
water use efficiency |
|
|
|
® Develop appropriate cropping patterns |
|
|
|
Irrigation system performance |
® Optimize water use throughout the year |
|
|
® Match supply with crop water requirements |
|
|
® Reduce transportation and conveyance
losses
|
® Rehabilitation of infrastructure |
|
® Upgrading infrastructure |
|
|
® Improving design |
|
|
® Improving operation |
|
|
® Improving maintenance |
|
|
® Improving flexibility and responsiveness |
|
|
|
|
|
® Intermediate storage |
|
|
|
® Upgrade existing institutions |
|
|
|
® Institutional reform |
|
|
|
® Water pricing |
|
|
|
® Improved on-farm water management |
® Upgrading infrastructure |
|
|
|
® Improving scheduling |
|
|
Degradation of irrigation infrastructure
|
® Rehabilitation programmes |
|
|
® Rehabilitation/modernization programmes |
|
|
|
® Improving financial base for O&M
|
® Increasing water charges |
|
|
® Transferring costs to users |
||
|
® Transferring O&M to users |
||
|
® Improving pattern of public expenditure |
||
|
® Improving income from farming |
||
|
Reducing O&M costs
|
® Increasing efficiency of O&M |
|
|
® Improving designs |
||
|
® Increasing accountability of agency |
||
|
® Transferring O&M to users |
Put together, however, these four issues and the responses they call for in terms of policy goals, strategies and specific objectives and measures at each level provide a general framework which more or less applies to most of the countries in the region. This is presented in Table 4.
As this table shows, the modernization of irrigation schemes is a part of a broader transformation of the water and agricultural sectors, responds to a complex set of institutional, technical, operational and economic issues, and would consist of a complex set of institutional, technical, operational and agricultural changes, generally associated with changes in water pricing and cost recovery. When modernization of irrigation schemes is given a specific meaning (see section Definitions), it is clearly distinct from rehabilitation. There is a general agreement on the specific objectives of the improvement of the performance of irrigation systems, in terms of delivering water to farmers in a more efficient, flexible, reliable and equitable manner.
STATUS OF NATIONAL MODERNIZATION PROGRAMMES
Table 5 summarizes the status of national modernization programmes, from the recognition of need to the development of a modernization concept and the implementation of pilot and national programmes, according to the information provided by the country papers, including the case studies which they present.
All countries recognize the need for modernization of irrigation schemes. With the exception of Pakistan and Sri Lanka (according to the country papers), they have developed a specific concept for modernization which is relevant and more or less consistent with modernization as it is understood generally during this Consultation.
Malaysia seems to be the most advanced in having defined a long-term modernization programme and implementing it in the eight granary schemes which have been determined for achieving national rice production objectives. Both China and the Republic of Korea are committed to extensive modernization programmes, with the Government of Korea having announced considerable budget allocations for its implementation. Programmes for these two countries share the characteristic of having very ambitious targets and fast implementation rates, including in terms of the time estimated for the implementation of individual sub-projects (one/two years), with concerns for their sustainability.
TABLE 5: PROGRESS OF MODERNIZATION PROGRAMMES
Thailand’s Royal Irrigation Department is proceeding methodically through the various steps of defining policy and technical concepts, and planning, while implementing institutional reforms, in particular for water resources management. The case of Bangladesh, here again, is quite special, this country’s core reforms having already been implemented.
Most countries estimate that it is still too early to assess the impact of modernization programmes. However, the assessment of pilot projects not only in India but also in Malaysia and Korea (as well as of previous irrigation projects in Sri Lanka and Malaysia) calls for some prudence. The improvements in water use efficiency and yields of pilot projects in India are far from long-term targets. Developing functional information and automation systems, as shown by the examples of the Republic of Korea and Malaysia, can take many years. Building successful water users’associations and implementing more participatory approaches to correct previous approaches to irrigation system improvement and intensification (Sri Lanka), described as top-down and technocratic, is not easy.
In relation to the above considerations, the sheer magnitude, in terms of improvements to be achieved in higher water use efficiency and yields, and in terms of surface area and the rather short period of time to achieve those objectives in countries such as India, Pakistan and China, should be a cause for concern.
DEFINITIONS OF MODERNIZATION OF IRRIGATION SCHEMES
As already mentioned in this paper, the country papers can finally be divided in two groups. For the first group of authors, modernization of irrigation schemes is a new concept with distinctive technological and operational features: this group includes China, India, Republic of Korea, Malaysia, the Philippines and Thailand; for the second group (Sri Lanka, Pakistan, Bangladesh1), modernization seems to have a purely institutional content. Table 6 presents the main traits which apparently oppose the two groups of country papers.
In reality, the opposition is not so severe: the first group of authors recognizes that modernization of irrigation schemes is a process that combines technological, institutional and operational changes, and it indicates some of the technical options that might be adopted to achieve a greater flexibility, efficiency, reliability and equity of irrigation water delivery, and specifies information, control and communication requirements for improved operation of the systems. Also, quantifying the challenges facing the national irrigation subsectors in a specific timeframe seems to concentrate the minds of these authors on defining physical targets for modernization and on the ways and means to achieve them.
TABLE 6
Main traits of the two groups of country
papers
|
Modernization is a new concept |
vs. |
Modernization is the continuous process of irrigation
development |
|
Top-driven |
vs. |
Bottom-driven |
|
Technology-driven |
vs. |
Centrality of farmers Centrality of institutions |
|
Project |
vs. |
Phased programme |
|
Physical targets |
vs. |
General goals |
|
Prescriptive approach |
vs. |
Integrated approach |
SOME ISSUES RELATED TO THE IMPLEMENTATION OF MODERNIZATION PROGRAMMES
In this concluding section, issues which are raised by some of the authors of the country papers and which are of general relevance have been selected for discussion during this Consultation:
Genuine commitment to modernization and acceptability of modernization programmes
Modernization programmes mobilize considerable staff and financial resources and involve a complex process of change. This requires a strong political leadership, especially as some of the implications of modernization programmes may be politically unsavoury. In particular, changing the pattern of public expenditure for operation and maintenance from maintaining large staff in irrigation agencies to financing actual O&M works or irrigation system upgrades can meet resistance from political decision makers. Similarly, technical staff of irrigation agencies may resist or sabotage the development of automation and improved information systems if the avowed aim of their introduction is a reduction in staff. Also, increases or changes in water tariffs and cost recovery may meet resistance from farmers and consequently from local or national politicians.
On the other hand, once the decision has been made to implement an ambitious modernization programme, there is the risk that this programme transforms itself into a purely equipment and infrastructure programme without building the management structures and funding systems that will ensure its sustainability, or properly addressing the on-farm water management and irrigation equipment and farming services components that would enable farmers to take advantage of improved water delivery systems, thereby again compromising the achievement of agricultural and economic benefits that are a condition for the profitability of the projects and the sustainability of the schemes.
Cost effectiveness of modernization of existing schemes versus development of new schemes
This question is raised in some of country papers. In reality, in many cases the existing schemes have to be rehabilitated and the question is therefore to compare costs of benefits of merely rehabilitating versus upgrading and modernizing the irrigation schemes. There is a perception that modernization may imply substantially higher costs. Also, as the modernization of large gravity schemes would be a complex operation, one may be tempted to limit the implementation of modern irrigation concepts to new schemes, where it would be simpler.
M.A. Matin
Head of Administration, National Minor Irrigation
Development Project, Bangladesh
PART I: POLICIES REGARDING MODERNIZATION OF IRRIGATION SCHEMES
INTRODUCTION
Bangladesh is almost entirely an alluvial, deltaic plain with hills on the northeast, east and southeast margins. Within the alluvial plain there are several slightly elevated areas of older alluvium referred to as terrace areas. Bangladesh is slightly above mean sea level. Three major river systems drain to the Bay of Bengal through Bangladesh. The Brahmaputra-Jamuna Rivers entering Bangladesh from the north, joins the Ganges river, flowing from the west about 90 km west of Dhaka in central Bangladesh. Down stream of their confluence, the Jamuna-Ganges, known as the Padma, flows southeasterly for 103 km to its confluence with the Meghna river. The latter river drains eastern Bangladesh including the hills of Assam, Tripura and Meghalay. The Meghna flows southward below the confluence with the Padma and discharges to the Bay of Bengal through a complex of estuaries.
Basin operations are a major concern because Bangladesh is undoubtedly the most flood prone country in the world in terms of proportion of area of risk to total area. Flooding also occur due to tidal surges caused by cyclones in the Bay of Bengal. But the problems of providing full protection against tidal surges and taming the major rivers are immense. Moreover forecasting and preparedness measures are generally inadequate. Actually in Bangladesh, large-scale surface irrigation is relatively unimportant. After the 1972 World Bank sponsored land and water supply study, emphasis has been placed on minor irrigation through low lift pumps and mainly by tubewells, to some extent supported by complementary low cost flood control & drainage projects. Groundwater is the main source of water needed to produce the main staple crop rice. Suitable groundwater extraction techniques i.e., use of VDSSTW (Very Deep Set Shallow Tubewell) and FMTW (Force Mode Tubewell) will be used to pump groundwater from wells.
IRRIGATION SUBSECTOR
In Bangladesh as stated earlier more emphasis has been placed on minor irrigation through low lift pumps and tubewells (shallow tubewells and Deep and Force mode tubewells). In previous stages (during 1950 to 1987), public tubewells, regulations of private installations and public monopolies in the supply of pumps, motors and other equipment increased costs and adversely affected development.
Over the years, however, the potential for dry season irrigation has been well documented. Equipment markets and imports have been liberalized gradually. Repair facility and flexible markets have been developed. So the transformation from supply driven public sector controlled domain of irrigation to demand driven private sector took place.
In view of the above context, the National Minor Irrigation Development Project (NMIDP) was established in 1991 in response to the needs of farmers and the requirement of increased private sector investment in minor irrigation technologies. The project objective is to ensure sustainable growth in agriculture through increased minor irrigation and consolidation of the transition from a government controlled supply driven system to a demand driven system. Development of appropriate technologies include demonstration and construction of VDSSTWs and FMTWs in cooperation with interested farmers. Since the inception of the project's field activity in December 1994, 655 VDSSTWs and 32 FMTWs have been constructed by the farmers due to the promotional impact of the project. It may be mentioned that project's activity is mainly concentrated with VDSSTW and FMTW technology whereas irrigation by STW (shallow tubewell) is mainly controlled by the private sector.
At present out of 9.7 million ha cultivable area, 7.4 million ha land is suitable for irrigation. Out of 7.4 million ha, 3.2 million ha land has been brought under irrigation, still there is a possibility of bringing 4.2 million ha area under groundwater irrigation as the required amount of groundwater resource will be available in future.
GOVERNMENT POLICIES FOR MODERNIZATION PROGRAMMES
Inherently linked to agriculture, the management of water and flood occupies a critical position in any perception of planning for the development of the country. The perspective plan strategy is divided into two halves, the short term period covering the period 1996-2000, and the long term period covering 2000 onwards.
The expansion of irrigation is a vital component of the Government's strategy in agriculture. Only a third of irrigable land is currently under irrigation and future growth in agriculture is dependent of expanding the area under irrigation. Irrigation through major canals cover only 6% of the total area, the remainder being classified under minor irrigation consisting of low lift pumps, shallow tubewells, deep tubewells, manual tubewells and traditional systems. Table 1 provides information about irrigation under different categories.
Supported by donor agencies and the Government, more than two thirds of irrigation has been developed in the private sector. The liberalization of the economy, deregulation, privatization and access to minor irrigation equipment by the private sector has resulted in a very rapid growth of irrigated lands. It is important to recognize some factors: first, there has been a general reduction of area irrigated per well as a consequence of drawdown of the resource base, and second, there has been an increase in salinity intrusion particularly along the coastal areas in the southwestern part of the country.
The environmental consequence of this would have very significant implications for the future. Thus, while future irrigation will still have a bias towards groundwater utilization, policy decisions on the technology to be promoted, for instance between DTW and LLP; will have an impact on overall growth as well as distributional impact of that growth.
TABLE 1
Area and type of irrigation acreage
|
No |
Irrigation Command Area (acres x 1000) |
83-84 |
88-89 |
93-94 |
|
1
|
Ground Water Wells |
|
|
|
|
a) Shallow tubewell |
1186 |
2326 |
3429 |
|
|
b) Deep tubewellc) |
650 |
940 |
962 |
|
|
c) Manual pumps |
40 |
40 |
71 |
|
|
Sub Total |
1,876 |
3,306 |
4,462 |
|
|
2
|
Surface Water Irrigation Schemesa) |
|
|
|
|
a) Low-lift pumps |
845 |
1,192 |
1,132 |
|
|
b) Traditional |
920 |
967 |
860 |
|
|
c) Canal (major) |
337 |
419 |
427 |
|
|
Sub Total |
2102 |
2578 |
2419 |
|
|
Total |
3978 |
5884 |
6881 |
|
A combination of short and medium term strategies involving both the public and private sector would include:
As per the above outlined strategy, indicative targets have been set for irrigation and flood control measures under the perspective plan. The targets embody methods to be adopted by both public and private sectors. These targets emphasize the importance of an appropriate policy on environment which would generate the requisite response from the private sector. At the same time these targets, which will be carefully reviewed during implementation, emphasize the importance of the institutional environment to generate the appropriate response. The targets are given in Table 2.
Within the framework of the plan, future irrigation development in the private sector based on groundwater utilization will continue to be pursued but with adequate safeguards against exploitation. At the same time, prospects for the development of surface water for irrigation in combination with drainage and other measures would also be pursued. Given the nature of such interventions, these would be undertaken in the public sector. It is essential however, to point out that a qualitative change in the approach to irrigation would have to emphasize to give a focus on irrigation efficiency including the introduction of water conservation measures.
TABLE 2
Irrigation targets (Area in lakh (1 million = 10 lakhs)
hectare)
|
|
Irrigation |
Estimated Bench Mark of 94-95 |
Target for 1995-2000 |
Expected Growth rate during 95-2000 |
Target for 2000-2010 cumulative |
Estimated Growth rates drawing (2000-2010) |
|
Surface Water |
|
|
|
|
|
|
|
A
|
i) Gravity flow |
3.33 |
4.66 |
6.95% |
7.85 |
5.35% |
|
ii) LLP including floating pump |
4.6 |
12.15 |
21.44% |
15 |
2.13% |
|
|
iii) Traditional
|
|
|
|
|
|
|
|
2.60 |
2.3 |
-2.42% |
2 |
-1.39% |
||
|
Sub-Total |
10.53 |
19.11 |
25.97% |
24.85 |
6.09% |
|
|
Contribution of A to total Irrigation |
34.93% |
38.15% |
12.66% |
41.07% |
|
|
|
|
Ground Water |
|
|
|
|
|
|
i) DTW |
4.4 |
6 |
6.40% |
6 |
0 |
|
|
ii) STW |
14.5 |
22 |
8.70% |
22 |
0 |
|
|
B
|
iii) HTW |
0.15 |
0.2 |
5.90% |
0.3 |
4.14% |
|
iv) FMTW |
- |
1 |
- |
3 |
11.61% |
|
|
v) DSSTW |
0.47 |
0.9 |
13.88% |
2.25 |
9.60% |
|
|
vi) VDSSTW |
- |
0.38 |
- |
1.1 |
11.21% |
|
|
Sub-Total |
19.52 |
30.48 |
34.88 |
35.65 |
36.56 |
|
|
Contribution of B to total Irrigation |
64.74% |
60.85% |
35.30% |
58.30% |
71.39% |
|
AGRICULTURAL SUPPORT SERVICES PROGRAM (ASSP)
Agricultural support services and farmer's participation
The main objectives of the government's agricultural policy are to:
As land is scarce in Bangladesh these objectives can only be achieved through the efficient, productive and sustainable use of all farm land. This will depend on the farmers who decide to produce, what technology and inputs to use, how much to sell, how much care to take in looking after their crops and livestock. ASSP is playing a vital role influencing the farmers decisions.
The function of ASSP is to:
In carrying out these functions, ASSP recognizes five basic principles:
1. Farmer's existing knowledge is an important source of information and expertise. Extension staff and other farmers can learn from the achievements and experiments of successful farmers.The approach of ASSP is group extension approach. This means that field staff will, wherever possible, carry out their key tasks of identifying farmer's problems, advising on solutions to problems and demonstrating new technology with groups of farmers and not with individuals.2. The basic unit of production is the rural household and its farm. Together these form a system. Change in one part of the system will affect other parts. New practices may need more labour, reducing the amount of time spent on other important activities. Extension staff need to take the whole system into account when advising farmers and analysing the problems they face.
3. Homestead activities, and the storage, processing and marketing of produce are important parts of the production system. As women are often responsible for much of this work emphasis is given on both men and women's access to its extension services.
4. The resources and circumstances of farmers vary considerably. Large scale farmers have different possibilities for developing their farms compared with small and marginal farmers. Extension staff must be aware of these variations and provide appropriate information and services to all categories of farmers.
5. Farmers only make changes to their farms and farming practices which they feel will benefit them; for example by increasing output, improving nutrition, reducing costs or reducing the uncertainty of production. Extension staff encourage farmers to adopt changes which will bring benefit to their households, while at the same time meeting the strategic agricultural needs of the country.
The types of group with which ASS
P's field staff work include:
Methods for programme implementation
These consist of:
ASSP is thus rendering support service to the farmers keeping liaison with other departments or agencies involved in the irrigation sector. The achievement after introducing the support service like ASSP has helped to build up a bottom-up participatory approach of the farmers in the formulation and design of modernization programmes.
IMPACT OF MODERNIZATION PROGRAMMES
In the early fifties, groundwater irrigation was introduced in Bangladesh by the Government. Till 1974 the technology promoted by BADC was the large submersible/vertical turbine pump, known as DTW. The public sector was responsible for the installation and operation of these DTW. After 1978 sale of DTW at subsidized rate started. The Government of Bangladesh (GOB) played an important role in the development of minor irrigation. The effect of Government policies on growth of STW is shown below (Figure 1). In 1980 the sales of STW raised sharply as a result of credit availability and deregulation. Major portion of irrigated area is covered by STW. A fall of groundwater levels in the dry season of 1983, was followed in 1984 by new regulation of spacing of wells.
Actually the transformation of markets from a supply driven to a demand driven competitive system started in 1987. This change took place due to deregulation of controls that obstructed the growth of the private sector. A rapid growth and a final breakthrough of the STW was realized. The growth of STW was further stimulated by the removal of taxes and duties on irrigation equipment in 1988 and in 1990. Since 1987, the private sector has taken over the role of public sector as the vehicle for minor irrigation development. Development of pump technology will continue. In a growing economy diversification of pump technologies and pump capacities will expand. The demand for high head pump to run VDSSTW increased and for this a knowledgeable private sector is required to cope with the changes in situation. Therefore the strengthening of the private sector involved in minor irrigation is needed.
Crop diversification is promoted by Government through the Department of Agriculture Extension (DAE). Larger areas are brought under HYV wheat, potato and sunflower. The impact of the modernization of minor irrigation and other programmes related to crop production is given in Table 3.
TABLE 3
Growth of production
|
Agriculture: Average annual growth rate (%) |
1970-80 |
1980-93 |
|
|
0.6 |
2.6 |
|
Distribution of gross domestic product (%) |
1970 |
1993 |
|
Agriculture: |
55 |
30 |
|
|
1980 |
1993 |
|
Value added in Agriculture (million $) |
6429 |
7306 |
|
Cereal imports (thousand tons) |
2194 |
1175 |
|
Food aid in cereals (thousand tons) |
1480 |
719 |
|
Fertilizer consumption (hundred gram/ha) |
455 |
1032 |
FUTURE TRENDS
In the year 2025 population will be nearly doubled. Demand for food grain will also be doubled. To cope with the food demand more areas will have to be brought under irrigation. STW, LLP, DSSTW, VDSSTW, FMTW and DTW will be used for irrigation purpose. Due to the deeper groundwater levels in the dry season, the share of DSSTW, VDSSTW and FMTW will increase. DTW technology will disappear since farmers prefer to arrange irrigation on an individual basis or with small group of farmers only. DSSTW, VDSSTW & FMTW will be applied in 45% of the irrigated area in Bangladesh by 2025.
INTERNATIONAL SUPPORT
Support in terms of research, training, technical assistance will be required from organization like FAO & IIMI. Presently World Bank and EEC sponsored Technical Assistance and Financial support programmes is rendered to the ongoing project “National Minor Irrigation Development (NMIDP)”.
PART II: CASE STUDY: THE NATIONAL MINOR IRRIGATION DEVELOPMENT PROJECT
PROJECT PROFILE
The National Minor Irrigation Development Project (NMIDP) is an initiative of the Government of Bangladesh. The project is designed to respond to the needs of farmers and the requirements for increased private sector investment in minor irrigation technologies. Financed with the support of the Commission of the European Communities (CEC) and World Bank (IDA), the project aims to encourage developing 350 000 hectares of irrigated areas by the year 2010. NMIDP commenced in May 1993 and is scheduled to continue for 7 years.
PROJECT OBJECTIVES
The project objective is sustainable growth in agriculture through increased minor irrigation and consolidation of the transition from a government controlled system to a demand driven competitive supply system.
PROJECT OUTPUTS
Groundwater irrigation
Surface water irrigation
POLICY AND PLANNING SUPPORT
Training needs assessments for minor irrigation sector development and implementation of agreed further training programmes.
GROUNDWATER IRRIGATION
Groundwater irrigation problems
There are areas, particularly at the end of the dry season, where it is not possible to use STWs because the water level in these areas falls beyond the suction limit of the centrifugal pump. In many of these situations it is still possible to draw water from the same well by placing the STW in a pit. Lowering of a STW in a pit is called a deep set shallow tubewell (DSSTW) or a very deep set shallow tubewell (VDSSTW). Moreover, there are areas where the static water levels fall deeper (over 35 feet). That means even a VDSSTW will not work. In these situations a submersible or vertical turbine pumps is needed. These types of pumps, force mode tubewells (FMTWs), are more costly and require access to electricity. For deep and very deep setting of STWs lined pits are used. Especially in loose soils it is necessary to line deep pits to prevent them from collapsing. The depth of the pit will depend on the groundwater levels during the dry season. The necessity for innovative groundwater technology is strongly related to the present and future groundwater levels. The seasonable decline of groundwater in the dry season is the effect of a consistently increasing volume of pumped irrigation water. The increase of annual maximum depth to groundwater causes clear limitations to STW application.
The immediate objective of Market Development and Promotion Unit (MDPU) is to enhance the awareness of minor irrigation investment opportunities amongst the equipment suppliers and the investors, make the opportunities attractive by introducing more appropriate and affordable pumping technologies, and guide/support the suppliers to carry out their own promotion, at present, and in the future.
First promotion campaign
MDPU started in December 1994 with a first promotion campaign in the Madhupur tract, the area north of Dhaka, where VDSSTW and FMTW technologies were virtually unknown. The area is somewhat elevated and groundwater levels are therefore deeper. Among farmers' communities awareness was raised, and VDSSTW and FMTW technologies promoted by a small fleet of Village Promotion Units (VPUs) and Mobile Advice Centres (MACs). Irrigation Advice Centres, introduced as “Shepoks”, at strategic sites in selected thanas, staffed by well trained advisors, gave initial advice to potential investors in VDSSTW and FMTW technologies. Although the technology was considered beneficial for the farmer, the crucial question was whether the farmer really was going to adopt it. After the first wave of awareness activities, the conclusion was “yes”, and there was a clear demand for VDSSTW and FMTW and FMTW technology. MDPU's second promotion campaign started in October 1995. After one year promotion in 18 thanas in the Madhupur tract, the “East Area”, the number of VDSSTWS had grown from 8 to more than 600. This was considered as a direct impact of the promotion campaign. Most interested farmers invested in VDSSTW or FMTW without any subsidy, even without any credit facility from the banks. The number of FMTWs went up from 2 to over 30.
CASE STUDY: ACHIEVEMENTS
Impact of promotional activities
Promotional activities and farm visits by TA staff resulted in a total of 711 farmers responded positively in installing a VDSSTW, of which a total of 655 (25 in current month) farmers have actually installed and operated VDSSTW. Another 56 farmers have started construction this month but not yet completed their VDSSTWs.
Suppliers
Three field days and 4 suppliers day have been held this month for the suppliers and a total of over 2050 suppliers visited the IACs so far. Return visits were made by IAC Advisors to the suppliers.
Market development and promotion
Promotional activity in the west area, which started in January 1996, is continuing satisfactorily and a good number of posters, handbills, and farmers handbooks were distributed. Thirty-five markets have been visited by MACs which attracted nearly 20 000 farmers. Six private sector seminars have been conducted which were attended by 220 suppliers.
Potential investors continued to visit IACs in the Eastern Area and IAC Advisors made more than 500 visits to investors (farmers) and over 1 150 visits to suppliers.
BIBLIOGRAPHY
Ministry of Planning. Participatory Perspective Plan - 1995-2010. Bangladesh.
Water Management in Asia. Volume-I, Main Report. World Bank Technical Paper. Washington D.C.
ASSP manual - Department of Agricultural Extension, 1995.
Revised Project Plan (RPP) of NMIDP - 1995-96.
World Development Report 1995. World Bank, Washington D.C.
MDPU Progress Achievements. September 1996.
Zhang Hansong
Engineer, Department of Rural Water Conservancy,
Ministry of Water Resources, Beijing, China
PART I: POLICIES REGARDING MODERNIZATION OF IRRIGATION SCHEMES
WATER RESOURCES
In China, the annual availability of water resources per capita is only 2300m3, which is about 25% of the average availability in the world. The annual precipitation is as high as over 1 600 mm in the southeastern coastal regions, varies in range of 400-800 mm in the northern and northeastern regions, and less than 250 mm in the extensive northwestern regions, with much uneven distribution in both space and time.
According to various demands of crops in different areas for irrigation and drainage, the whole country can be divided into three zones: Perennial Irrigation Zone, in which the average annual precipitation is less than 400 mm; Unstable Irrigation Zone, in which the average annual precipitation is over 400 mm and less than 1000 mm; Rice Irrigation Zone in which the average annual precipitation is over 1000 mm. The three irrigation zones are shown in Figure 1.
FIGURE 1. Zoning irrigation and drainage
DEVELOPMENT AND PRESENT SITUATION OF IRRIGATION AND DRAINAGE IN CHINA
Irrigation has played an important role in China due to its limited cultivated area, large population and limited water resources. Development of water resources has been given priority and great achievements have been made in river harnessing, flood and waterlogging control, irrigation and drainage development, water and soil conservation, etc.. The irrigated area has been increased from 15.9 million ha in 1949 to 50.4 million ha in 1995, which accounts for 53% of the total cultivated area in the whole country. The development of irrigation has greatly improved the conditions of agricultural production. The total grain output reached 466.57 million tons in 1995. At present, about two-thirds of grain produced comes from the irrigated land (Table 1).
TABLE 1
Effective irrigation area and grain output from 1949 to
1995 in China
|
Year |
Effective Irrigation Area (Million ha) |
Percentage of Cultivated Land (%) |
Total Grain Output (Million tons) |
Average Yield of Grain (kg/ha) |
|
1949 |
15.93 |
16.3 |
113.20 |
1020 |
|
1957 |
25.01 |
22.4 |
195.05 |
1470 |
|
1965 |
32.04 |
30.9 |
194.55 |
1620 |
|
1975 |
46.12 |
46.3 |
284.50 |
2340 |
|
1980 |
48.89 |
49.2 |
320.55 |
2730 |
|
1985 |
47.93 |
49.5 |
379.10 |
3480 |
|
1995 |
50.41 |
53.1 |
466.57 |
4245 |
|
|
|
|
|
*Effective irrigated area |
50.41 |
|
|
Percentage of cultivated land (%) |
53% |
|
|
*Actual irrigated area |
44.10 |
|
12.79 |
|
|
29.7 |
|
|
4.2 |
|
|
24.42 |
|
|
Waterlogging control area |
20.07 |
|
|
7.66 |
|
|
Improved or controlled saline-alkali area |
5.43 |
|
|
163.07 |
|
|
Controlled soil and water erosion area |
66.87 |
|
|
387 |
|
|
Total capacity (thousand million m3) |
349 |
|
|
2,593 |
|
|
Total capacity (thousand million m3) |
72 |
|
|
81,795 |
|
|
Total capacity (thousand million m3) |
59 |
|
|
247 |
|
|
Cultivated areas protected (million ha) |
30.61 |
|
|
68,240 |
|
|
173.53 |
|
|
Number of livestock supplied with drinking water
(million) |
103.60 |
|
REHABILITATION AND MODERNIZATION OF IRRIGATION PROJECTS
Ageing of the irrigation projects is a serious problem in China. Investigations by the Ministry of Water Resources in 1992 have shown that in a large number of projects the headworks have deteriorated and need reconstruction. Also considerable lengths of canal linings have been seriously damaged. Due to the policy of low water fees collected and free water delivery service practised by irrigation and drainage projects in the past, sufficient funds for regular maintenance and rehabilitation were lacking in the past (generally, the actual water charges are merely 30 to 50% of the cost, and only in a few regions do they go up to about 70%). The basic national construction funds for water resources and the special subsidy funds for irrigation and drainage projects have been used for new projects over a long period of time. The funds for rehabilitation and modernization of key projects have not yet been earmarked except for some on-farm engineering facilities in the projects.
During the Ninth Five-Year Plan it is proposed that irrigated areas will be increased to 3.3 million ha and the grain production capacity will be increased to 40-50 thousand million kg. The Central Government has decided to grant a part of the funds each year for rehabilitating the irrigation infrastructure. The remaining funds required for rehabilitation and modernization of irrigation projects will be borne by the central, provincial, prefecture and county governments in proportions based on canal lengths. Meanwhile, the government still adheres to the policy of mobilizing the farmers in the benefited regions to contribute funds and labour input to carry out the complementary works under branch canals. The situation of rehabilitation and modernization projects in 1996 are shown in Table 2.
DIRECTIONS OF THE FUTURE
In the Ninth-Five Year Plan for national economic development, Government placed first priority on agriculture and indicated that the country should be self-sufficient in grain production. To achieve the above goals, the proposed directions in future are as follows:
|
Number of Irrigation Districts
|
Total Cost (Million Yuan)
|
Amount (Million Yuan) |
Estimated Benefits |
|||||
|
Central |
Province |
Prefecture (County) |
Increased Irrigation Area |
Improved Area |
Increased Output |
Increased Value |
||
|
1. Dawa Irri. District |
18 |
6 |
6 |
6 |
6.7 |
3.3 |
35 |
63 |
|
2. Dongfeng Irri. District |
10.48 |
4 |
4 |
2.48 |
6.7 |
6.7 |
50 |
90 |
|
3. Lishu Irri. District |
15.25 |
5 |
5 |
5.25 |
3.3 |
20 |
36 |
65 |
|
4. Yinhe Irri. District |
15 |
5 |
5 |
5 |
5.7 |
3.3 |
22 |
40 |
|
5. Shonglian Irri. District |
15 |
5 |
5 |
5 |
6.7 |
3.3 |
45 |
81 |
|
6. Jiaokou Irri. District |
16.1 |
5 |
5 |
6.1 |
3.3 |
1.3 |
22 |
40 |
|
7. Pishihang Irri. District |
16 |
5 |
8 |
3 |
6.9 |
8.5 |
30 |
54 |
|
8. Songtao Irri. District |
15 |
5 |
5 |
5 |
3.3 |
5.3 |
28 |
50 |
|
9. Ouyanghai Irri. District |
15.1 |
5 |
5 |
5.1 |
3.3 |
6.7 |
30 |
54 |
|
10. Zhanghe Irri. District |
15.5 |
5 |
5 |
5.5 |
3.3 |
8.7 |
33 |
59 |
|
11. Dujiangyan Irri. District |
16 |
5 |
5 |
5.5 |
4 |
8 |
36 |
64 |
|
12. Yerqiang Irri. District |
15 |
5 |
5.5 |
5 |
3.3 |
6.7 |
30 |
54 |
|
Total |
182.43 |
60 |
63.5 |
58.93 |
56.5 |
81.8 |
397 |
714 |
The rehabilitation of irrigation projects should be regarded as a key priority in the future and capital for construction at all levels taken up. Besides, it is also necessary to explore all possibilities for gathering funds and to utilize all available loans and investments both at home and from abroad.
Speeding up the reform of water charges
In 1985, the Central Government issued a rule which required to collect water charges according to the water-supply costs. In view of the farmer’s lower incomes, the present water charges are only 1/2 to 2/3 of the water-supply costs. In future water charges should match water supply costs. Where this is not possible, the local government of benefited areas should subsidise the water costs.
Popularizing the techniques of water saving
When rehabilitating and modernizing irrigation projects, canal seepage control, low-pressure pipe-lines for conveying water, sprinkler and drip irrigation methods should be used widely.
Drawing up an overall plan of rehabilitation and modernization for the existing irrigation districts
As the number of projects needing rehabilitation and modernization is large, a comprehensive plan for taking up these projects stage by stage is needed.
Mobilizing farmer’s participation
In China, irrigation and drainage works of small size are fully built and managed by the farmers themselves. The government is only responsible for the organization, provision of services and appropriate subsidies (e.g. a subsidy for small rural water conservation projects.) The on-farm engineering facilities under the tertiary (lateral) canals in irrigation districts of large scale are also built and managed by the farmer themselves. Water users’ participation needs to be strengthened keeping in mind the results achieved in the pilot projects financed by the World Bank in Hunan and Hubei Provinces.
PART II: CASE STUDY
REHABILITATION AND MODERNIZATION OF AN IRRIGATION SYSTEM FOR WATER SAVING, IN HANDUN IRRIGATION DISTRICT, SHANGDONG PROVINCE
The Handun Irrigation District is located on the left bank of the lower reaches of the Huanghe River, and in the north of the delta of the Huanghe River. The headworks are located 126 kilometres upstream from the entrance of the Huanghe River to the sea. Handun Irrigation District was established in 1959, with 64 032 ha of designed command area, out of which 32 016 ha are presently irrigated. The project aims to improve the irrigation conditions of this saline-alkali and low yielding land, increase the irrigation area, guarantee the increase of food production, and water supply for people and livestock as well as to meet the demands of beach reclamation in the lower reaches of the Huanghe River. The total investment costs of the project are 68.84 million yuan for 5 years (8.5 yuan equals 1 US$).
DESCRIPTION OF THE REHABILITATION AND MODERNIZATION WORKS
The main objectives of the project are improvement of the headworks and to line the main canal; introduction of water saving technologies on the basis of pilot on-farm improvements; increase of water storage capacities in the lower reaches of the Huanghe River; and improvement and strengthening of the irrigation management organization.
Lining of the main canal
The length of the lined main canal is 22 km. The gradient of the main canal was increased from 1/7500 to 1/9000-1/10000 to prevent scouring and siltation. (The average silt content of water diverted from the Huanghe River is about 10 kg/m3). Plastic membranes (polyethylene with 0.2 mm thickness) was used as lining material for the full section with concrete at the sides. The conveyance capacity of the main canal increased from 50 m3/s to 60 m3/s, and the amount of silt deposition was also reduced. Besides this, the quantity of seepage losses was decreased significantly.
Rehabilitation of main canals and branch canals
In recent years, 32 intake gates for branch canals and 8 bridges along the main canal were reconstructed, 3 branch canals in the upper irrigation district were built, and 3 main canal in the lower irrigation district were rehabilitated, which improved the system operation significantly.
Complementary on-farm engineering facilities
Demonstration areas with U type lined branch canals and tertiary canals were established in the upper irrigation district, and 133 ha of demonstration area equipped with low-pressure pipelines was established in the middle and lower irrigation district. The results show that the effect of water saving is very good.
Renovation of drainage system
Several drainage ditches at branch and tertiary level with a total length of 306 kilometres were realigned and, culverts for drainage were built. The Jianghe Main Ditch for both irrigation and drainage was renovated, and as a result the drainage capacity has increased from 15 m3/s to 50 m3/s.
TABLE 3
Investments for rehabilitation of Handun Irrigation District (Unit: million yuan)
|
Item |
Amount |
|
National Investment |
26.22 |
|
Local government Investment |
8.50 |
|
Farmer Investment |
34.12 |
|
Total |
68.84 |
The Yanhe reservoir and 6 ponds with a storage capacity of 60 million m3 were built.
The investment for the above works is given in Table 3.
IMPROVEMENT AND STRENGTHENING OF THE IRRIGATION MANAGEMENT ORGANIZATION
Management organizations at all levels were established and strengthened. The main canal and relevant structures are managed by the main Engineering Bureau, branch canals and relevant structures are managed at county level. The management stations established in each township are responsible for management of the canal system under the branch level in the irrigation district, while some structures along the canal are contracted to farmers. Networks with telecommunication for measuring water as well as a central control system with computer facilities were set up.
Management of water use was strengthened and the water supply was measured to promote water saving. Water saving awareness is raising so water charges can be collected on a volumetric basis. At present, there are two irrigation methods adopted, i.e., furrow irrigation for cotton and border irrigation for wheat. Flood irrigation is no longer applied.
FARMER’S PARTICIPATION
The tertiary canals and the works in the tertiary units are managed by the farmers. For the larger tertiary units, there are 1 to 2 persons, responsible for the management of irrigation water and maintenance of small scale works. These persons are paid from the collected water charges. Besides, the desilting of the main canal, earth works and on-farm engineering facilities are basically completed by farmers. Charges are collected from farmers in accordance with the family size and the size of the area cultivated. Farmers are also required to contribute in terms of labour or instead to compensate in cash or kind.
RESULTS OF REHABILITATION AND MODERNIZATION
The main benefits are as follows:
The rehabilitation and modernization have improved the production conditions as shown in Table 4.
TABLE 4
|
Year |
Yield of Grain (kg/ha) |
Yield of Cotton (kg/ha) |
Actual Irrigated Areas (1000 ha) |
|
1988 |
5,100 |
900 |
32 |
|
1989 |
4,935 |
705 |
35.3 |
|
1990 |
3.345 |
180 |
36.9 |
|
1991 |
5,700 |
938 |
39.3 |
|
1992 |
3,330 |
158 |
42.8 |
|
1993 |
5,325 |
113 |
42 |
|
1994 |
6,225 |
788 |
42 |
|
1995 |
6,495 |
449 |
42.3 |
B.N. Navalawala
Adviser (Irrigation & Command Area
Development) Planning Commission, Govt. of India
INTRODUCTION
In India, the importance of irrigation, in accelerating economic growth in general and agricultural development in particular, has been widely recognized and accordingly a high priority has been assigned to it in the successive developmental plans. The average annual outlay on major and medium irrigation projects including CAD (Command Area Development) has increased from around Rs. 760 million ($21.7 million at average current rate of Rs. 35 = 1 US$) in the First Plan to nearly Rs. 56 000 million ($ 1599 million) in the Annual Plan 1995-96. Similarly for Minor Irrigation the average annual outlay has increased from Rs. 130 million ($3.71 million) in the First Plan to Rs. 15 200 million ($434 million). During the period (1951-95), total public sector investment of Rs. 580 000 million (i.e., about $16 700 million) was made for major, medium and minor irrigation development including the CAD programme in India. (The classification of irrigation projects in India is on the basis of extent (size) of cultivable command area (CCA) serviced by an irrigation work. A project with aCCA of more than 10 000 ha is called “Major Irrigation”, with a CCA of more than 2000 ha but less than 10 000 ha is called “Medium Irrigation” and a project/scheme, having a CCA up to 2000 ha. and less is called “Minor Irrigation”. As a result of such massive investments, the area under irrigation increased from 22.60 million ha at the beginning of the First Five Year Plan (1951) to about 77.77 million ha at the end of March 1995. The share of groundwater development is about 52% in the total irrigation utilization and about 50% in the total irrigation potential created up to the end of March, 1995. Foodgrain production in India has increased from about 55 million tonnes in 1949-50 to about 191 million tonnes in 1994-95.
CONSTRAINTS
Although India's population is about 16% of the world's population, its total average annual run-off in the rivers is just 4% of the world's rivers. Against a total annual precipitation of 4000 km3, average annual flow in the rivers is estimated at 1880 km3. However, in view of the constraints in the present technology available for storing of water and inter-State river issues, the total utilizable water resources are estimated at 1140 km3, comprising of 690 km3 of surface water and 450 cubic km of ground water which together accounts for merely 28.5% of the total precipitation. Major water consumer sectors are agriculture and domestic.
Taking 1990 as the base year and on the basis of the total annual renewable fresh water, the per caput water availability in India was 2464 m3 per year against which per caput water availability for South Asian countries was 4414 m3 and world average of 9231 m3. Water utilization in 1990 was estimated at 552 km3, i.e., about 48% of the total utilizable water resources.
India's population is estimated to be 1086 million in the year 2007 and 1394 million in the year 2025 and, accordingly, per caput water availability per year will come down to 1920 m3 and 1496 m3 respectively. Thus, it being in the range of 2000-1000 m3, India is likely to be subjected to water stress.
Out of its total geographical area of 329 million ha, the total area available for cultivation is about 142 million ha without accounting for fallow lands and 165.65 million ha including fallow lands. The average size of operational land holdings has reduced from 1.69 hectare in 1985-86 to 1.57 hectare in 1990-91. Although the combined percentage of marginal (below 1 ha) and small (1-2 ha) land holdings is 76.2% of total number of landholdings, its percentage to total operated area, nevertheless, comes to just 29%. As per 1981-82 Land Utilization statistics and reports till 1984-85, the availability of net cultivated land per caput decreased from 0.48 ha in 1951 to 0.20 ha. in 1980 and will further decrease to 0.15 ha by the turn of the century. Since 1970-71, the net sown area has remained stagnant at 140-142 million ha but cropping intensity increased from 118.2% in 1970-71 to 130.16 in 1992-93 mainly as a result of extension of irrigation facilities. Out of the total net sown area, about 127 million ha have been under cultivation for foodgrain crops for the last two decades. This means per caput foodgrain crop land decreased from 0.18 ha in 1981 to 0.15 ha in the year 1991 against an average of 0.19 ha of South Asian countries. Further, there will be pressure on good cultivated lands for uses other than agriculture due to urbanization, industrialization, etc. As such it is likely that land available for cultivation of foodgrain crops could come down to about 122 and 120 million ha by the years 2007 and 2025 respectively and in that case, per caput food grain crop land would further reduce to 0.112 ha and 0.086 ha respectively.
Despite impressive success in raising foodgrain production, the annual compound growth rate of agricultural performance has remained moderate vis-à-vis population growth. Overall agricultural productivity (in 1993) in the case of foodgrain crops in India is about 2 tonnes/ha as compared to other countries like China, South Korea and Indonesia which have a productivity of 4.58, 5.60, 3.91 tonnes/ha respectively and a global average of 2.74 tonnes/ha. The productivity level (1991 status) of India ranks at 27th position in the case of rice (with yields of 2576 kg/ha against the global highest of 8843 kg/ha), 32nd in the case of wheat (with 2226 kg against the highest of 7447 kg/ha), 38th in case of maize (1474 kg/ha against the highest of 8500 kg/ha), 32nd in case of groundnut in shell (944 kg/ha against the highest of 6452 kg/ha and 33rd in case of Potato (15969 kg/ha against the highest of 44318 kg/ha).
STRATEGIC NEED FOR MODERNIZATION
The main consideration in the strategy for water resources development in India has been the need for production of food, fodder, fibres, fuel and urbanization, putting severe competing claims on land use as well as on water use as a result of population growth. Keeping this in mind, the 8th Five Year Plan (1992-97) has set the target of pushing food grain production from 168.38 million tonnes in 1991-92 to 210 million tonnes in 1996-97 with a growth rate of 4% per annum and with an expansion (utilization) of irrigation from 75.7 millio ha in 1991-92 to 89.3 million ha in 1996-97 i.e. with an average growth rate of 3.5% per annum. During this period, it is envisaged that the gross cropped area under foodgrain would marginally increase from 127 million ha in 1991-92 to 130 million ha in 1996-97. This means that the agricultural growth strategy has to move in two directions viz., expanding the area for cultivation as well as under irrigation and optimizing the agricultural productivity on irrigated areas. Thus, the strategy for water resource development as outlined in the 8th Five Year Plan can be summarized as follows:
1. expansion of the irrigated area; andHowever, there is no possibility of increasing substantially the cultivated area and the increase in irrigation development has been slowed down to about 1.8 to 2 million ha per year against 2.3 million ha per year during (1974-85). Against this background, the 8th Plan emphasizes the improvement of performance efficiency of existing irrigation projects through modernization/rehabilitation as well as improved maintenance of the existing schemes in order to optimize the agricultural productivity as well as the water use efficiency.
2. optimization of water use efficiency in existing irrigation project/schemes including conjunctive use of ground and surface water resources.
DRIVING FORCES
Food self-sufficiency for Indian population in the year 2007 and 2025 is the main basis for long-term planning for water resources management. Per caput availability of foodgrains in India (1995) is as low as 502 grams per day against 480 grams per day which was 30 years ago and this is mainly due to the low level of development as a result of which a larger number of people are in the low income group as well as below poverty-line. Per caput foodgrain availability in China is 883 gms per day, 783 gms per day in Indonesia and 583 gms per day in Egypt. Therefore, at least 850 gms per caput as daily foodgrain requirement needs to be considered for the purpose of long-term water resources planning. Accordingly, the foodgrain requirement will be about 337 million tonnes in the year 2007 and 433 million tonnes in the year 2025 for human consumption. So far, the feed for the livestock population has been fodder grown on pasture lands. This scenario is going to be changed in the next 25 years when land availability will be very much constrained due to high pressure on land use on account of urbanization, industrialization as well as for environmental purposes. In such a situation some portion of foodgrain will have to be made available for feeding the livestock population. Even by the most modest estimation, this could be about 10 and 17 million tonnes annually in the year 2007 and 2025 respectively. Therefore, total foodgrain requirement for India would be 347 million tonnes in the year 2007 and 450 million tonnes in the year 2025. Out of 120 million hectares of area likely to be available in the year 2025 for foodgrain crops, 50 million ha will be rainfed agriculture and the balance of 70 million ha would be irrigated lands out of a total irrigated area of 113.5 million ha. On this basis, yield required from irrigated lands in the year 2025 will be 5 tonnes per hectare against the present yield level of about 2 tonnes per ha as well as the cropping intensity, as needed, would be something about 160% in 2025 against 130% at present.
So far, water use for domestic purposes has been low, as a result of the low level of development and low per caput income. Higher level of development results in higher income level which in turn increases the demand for domestic water. Today, on an average, it is 75-80 litres per caput per day for the total population. This is due to the low level of access to safe drinking water and sanitation. Although, in India, 80% of the total population (1991 census) have access to safe drinking water, the population that have access to sanitation is a mere 14%. The corresponding figures for China are 72% and 85% and for Israel, 100% and 99%. More disturbing is the fact that today only 3% of the Indian rural population has access to sanitation as against 81% in China and 95% in Israel. Surely, this low access to basic necessities has to be improved to be 100% by the year 2025 and with that the water demand per caput of total population will have to be increased to at least 120 litres per day in 2007 and 130-140 litres per day in 2025 on the basis of 180 litres per caput per day for urban population and 90 litres per caput per day for rural population. Urban population is projected to increase form 25.70% in 1990 to 40% of total population in 2025. Further, it will be required to consider the water demand for livestock population which could be about 3 to 4 km3 annually. Taking all these factors into account, broad estimates for water demands in the year 2007 and 2025 for the projected population and food self-sufficiency would show that the water demand will be of the order of 967 km3 and 1362 km3 in the year 2007 and 2025 respectively. Also, India will start experiencing periodic water stress from the year 2007 onwards as a result of its per caput water availability decreasing from 2000 m3 per year in 2007 to 1000 m3 per year in 2025.
TABLE 1
Projected water requirements (in cubic km)
|
Particulars
|
Total water requirement in the year |
||
|
1990 |
2007 |
2025 |
|
|
(A) With 40% water use efficiency in Irrigation |
|||
|
(i) Domestic (including partially for livestock population).
|
25 |
48 |
65 |
|
(4.53) |
(4.96) |
(4.77) |
|
|
(ii) Irrigation
|
460 |
822 |
1090 |
|
(83.33) |
(85) |
(80.03) |
|
|
(iii) Energy
|
19 |
27 |
40 |
|
(3.44) |
(2.79) |
(2.94) |
|
|
(iv) Industries
|
15 |
30 |
120 |
|
(2.72) |
(3.1) |
(8.81) |
|
|
(v) Environmental & others
|
33 |
40 |
47 |
|
(5.98) |
(4.15) |
(3.45) |
|
|
Total
|
552 |
967 |
1362 |
|
(100) |
(100) |
(100) |
|
|
|
|||
|
As % age of total utilizable water resources |
48.4 |
84.8 |
119.5 |
|
(B) With 60% water use efficiency in Irrigation |
|||
|
(i) Domestic (including partially for livestock population).
|
- |
48 |
65 |
|
|
(6.36) |
(6.07) |
|
|
(ii) Irrigation |
- |
610 |
800 |
|
|
(-80.79) |
(-74.63) |
|
|
(iii) Energy
|
- |
27 |
40 |
|
|
(-3.58) |
(-3.73) |
|
|
(iv) Industries
|
- |
30 |
120 |
|
|
(3.97) |
(-11.19) |
|
|
(v) Environmental & others
|
- |
40 |
47 |
|
|
(-5.3) |
(-4.38) |
|
|
Total
|
- |
755 |
1072 |
|
|
(-100) |
(-100) |
|
|
As % age of total utilizable water resources |
- |
66.2 |
94 |
Due to competing demand for water from other sectors, particularly domestic and industries, the share of irrigation from the total water demand will have to be brought down from its present level of 84% to 74% in the year 2025 although the yield per unit land required by then will be nearly two and a half times higher than its present level. This will only be possible when the water use efficiency (which is at present 40%) in irrigation is improved to the level of at least 60% since, in that case, it can result in saving about 200 km3 in the year 2007 and 290 km3 in the year 2025 which would be in the range of 22% of the total water requirements in the years 2007 and 2025. The results of the above scenarios namely with 40% and 60% irrigation water use efficiency are given in Table 1.
From the above, it can be seen that unless the water use efficiency is improved to a reasonable level, say 60%, the lack of fresh water is likely to be a major physical constraint for future food production and rural development in India. However, the potential for water saving is enormous. This situation demands a more detailed and scientific study for scenarios based on projected population, industrial activity expected, impact of global climate change and food self-sufficiency in the years 2007 and 2025 which should be undertaken urgently.
Financial management of irrigation works
Adequate and timely maintenance of irrigation systems and water pricing are interlinked with each other. In India water charges on average are very low - typically amounting to only 2-3% of the harvest's value in most states. Against the water rates at 5% of gross income for food crops and 12% of cash crops as recommended by the Irrigation Commission (1972), the actual gross receipts per ha of irrigated area by major-medium projects is at present barely 2% of the estimated gross output per ha of irrigated area and less than 4% of the difference between output per ha of irrigated and unirrigated area. This varies a great deal across State but in no State does the gross receipt per ha account for more than 3% of the gross productivity per ha of irrigated area. Similar problems exist in the case of ground water irrigation where water rates reflect only about 1/6th of the economic water rates. For example, in Haryana, the water recovery rate for tubewell irrigation comes to Rs. 1.25 (i.e., about 3 cents) per unit of electric power consumed against operating costs of Rs. 10 (i.e., about 29 cents) per unit of electric power consumed. With 7 million units of power consumption for all government managed tubewells, the annual financial loss is Rs. 6 million ($1.70 million). Water rates in Tamil Nadu were last revised 32 years ago. In Punjab, Kerala, Haryana, Jammu and Kashmir and Himachal Pradesh, there has been no change in rates since the mid-seventies. Several States (including Andhra Pradesh, Bihar Gujarat, Karnataka, Madhya Pradesh, Orissa, Rajasthan, Uttar Pradesh and West Bengal) announced revisions during 1981-86, but in some cases, the implementation of the revised rates was held up by the Governments. On an average, gross revenue collection per ha of irrigated area amounts to about Rs. 68 ($1.94) against which the estimated working expenses are Rs. 216 ($6.10) per ha, resulting in a financial loss of Rs. 148 ($4.20) per ha and year. The direct fall-out of such low irrigation water rates with added problems of low recovery is that today the water charges collected do not cover even working expenses, not to speak of depreciation charges and return on investments (Table 2).
TABLE 1
Working expenses, gross receipts and range of water rates
(Rs./ha)
|
S.No. |
Name of the States |
Working Expenses* |
Gross Receipts1 |
Range of Water Rates2 |
|
1 |
2 |
3 |
4 |
5 |
|
1 |
Andhra Pradesh |
1112 |
124 |
99 to 222 |
|
2 |
Bihar |
259 |
27 |
30 to 158 |
|
3 |
Gujarat |
4163 |
199 |
25 to 830 |
|
4 |
Haryana |
648 |
76 |
17 to 99 |
|
5 |
Jammu & Kashmir |
581 |
26 |
6 to 289 |
|
6 |
Karnataka |
1298 |
136 |
37 to 556 |
|
7 |
Kerala |
544 |
45 |
37 to 99 |
|
8 |
Madhya Pradesh |
456 |
97 |
15 to 297 |
|
9 |
Maharashtra |
4497 |
283 |
65 to 1000 |
|
10 |
Orissa |
128 |
37 |
6 to 185 |
|
11 |
Punjab |
339 |
76 |
14 to 81 |
|
12 |
Rajasthan |
747 |
92 |
20 to 143 |
|
13 |
Tamil Nadu |
527 |
10 |
6 to 65 |
|
14 |
Uttar Pradesh |
615 |
64 |
7 to 237 |
|
15 |
West Bengal |
404 |
14 |
74 to 593 |
|
|
All India |
873 |
82 |
N.A. |
1. Combined Finance and Revenue Accounts of Union and State Governments in IndiaNote:
2. Central Water Commission (Statistics Directorate).
1 Based on data for the year 1989-90.MODERNIZATION PROGRAMME
2 Range of water rates is given according to the rates prevailing during the year 1989-90.
* Inclusive of interest on capital
It is estimated that about 13 million ha of irrigated land from projects completed before Independence and 8 million ha from schemes completed 25 years ago require modernization/upgrading which would enable to a great extent the restoration of areas which have gone out of irrigation due to deteriorated performance of the systems. Further, it is estimated that with irrigation management improvement including increased water use efficiency from its present level of 38-40 percent to 60 percent, an additional 8 million ha can be brought under irrigation from existing irrigation infrastructure. States have no adequate resources to tackle this problem as a time-bound programme. The ongoing centrally sponsored command area development programme, under implementation since 1974, envisages the execution of on-farm development works such as field channels, land levelling, field drains and conjunctive use of ground and surface water; the introduction of Warabandi as well as evolving and propagating cropping patterns and water management practices appropriate to each command area. Other ancillary activities like construction of link roads, godowns and market centres, arrangements for supply of inputs as well as provision of credit and agricultural extension are also part of this programme. But, this programme is essentially for activities below the Government outlet. Therefore, the present scope of the ongoing centrally sponsored CAD programme can be enlarged to cover modernization/renovation works above the outlet. Total investment (estimated at current price level) for modernization/renovation works (at an estimated cost of Rs. 6000, i.e., $170 per ha) of more than 21 million ha of irrigated area on a selective basis could be in the order of $3.6 thousand million. This is to be appreciated in view of the present level of investment cost at Rs. 60-70000 ($1700-2000) per hectare of new irrigation development. The total estimated cost of modernization and renovation of irrigation projects/schemes during the VIII Plan is $2 thousand million and the VIII Plan outlay is about $506 million.
CATALYTIC ROLE OF MODERNIZATION FOR IMT
Irrigation Management Transfer (IMT) is a relatively recent development. Although State Governments in India consider IMT an appealing strategy for a variety of reasons which has been encouraged for the last two decades in India, the adoption rate has nevertheless been sluggish, scattered and mainly site-specific in the sense that even where successful WUAs are in place, it has not spread further to other areas or even to the adjoining blocks of the same command area. According to the available information, the total area presently managed in India by WUAs in different forms in nine states (i.e., Andhra Pradesh, Gujarat, Haryana, Karnataka, Kerala, M.P., Maharashtra, Tamil Nadu, and U.P.) is estimated to be 0.347 million ha which equals less than half a percent of the total area being irrigated in India. Contrary to this, in the Philippines which embarked on a programme of irrigation management transfer in 1983, 0.90 million ha, or 58% of the total irrigated area (1.54 million ha), is now being managed by 4087 WUAs, involving about 0.6 million farmers. Similarly Mexico, which embarked in 1989 on this programme, has now about 2.4 million ha, or 46% of the total irrigated area managed by WUAs. In China, 26% (i.e., 13 million ha) of the total area being effectively irrigated is presently managed by WUAs.
As an effective tool to improve the quality of service as well as the water-use efficiency in irrigation, the modernization/rehabilitation of irrigation schemes, prior to turn-over, will better motivate farmers and, thus, enable them to take over the management. Restoring a system to its full functional order will improve the productivity and profitability of the irrigation system as well as lower the future costs of maintenance. However, if rehabilitation is done without farmers' participation or investment, it can weaken the farmers’ interest to take over management and the work may not be compatible with farmers’ preferences. Also, rehabilitation of inherently uneconomical technological devices such as deep public tubewells in some areas like U.P., Bihar, Gujarat cannot be expected to have sustainable results. Such situation can very well be turned into building up a strong financial incentive for IMT by giving the highest priority in funding to only such modernization/rehabilitation works where the beneficiary farmers have organized themselves, formed WUAs with due registration and accepted the IMT.
CONCLUSION
Today, irrigation in India is facing an unprecedented situation in which farmers are concerned to receive a high quality of service with regard to irrigation, both in terms of precision and reliability, in the wake of a fast-developing trend towards commercialization of agriculture on the one hand and financial constraints, due to high costs of construction for both ongoing projects as well as new projects and steeply declining financial performance of irrigation projects, already in service, on the other. Financial resources have now become scarcer and scarcer and thus demand their utilization more efficiently and judiciously. This has made the decision-making process for new capital investments not only more cautious and vigilant, but also requires exploration with all care and caution of other less capital-intensive options like modernization or rehabilitation of existing irrigation projects for improving the water use efficiency and thereby enhancing the coverage of existing irrigation capacities. Furthermore, the projects which were completed before independence and also those completed 25 years ago are now urgently in need of modernization/renovation because timely and adequate maintenance has been neglected for a long time. There is one more and yet critical dimension to this problem i.e., the future scenario of water resources planning for drinking purpose, food grain production and health care for Indian population which will grow to 1086 million and 1394 million by the year 2007 and 2025 respectively. According to this scenario, India's water demand would exceed its total utilizable water resource and thereby India will start experiencing periodic water stress from the year 2007 onwards. As an effective tool to improve the quality of service as well as water use efficiency in irrigation, modernization/rehabilitation of irrigation projects/schemes, prior to turn-over, will better motivate farmers and enable them to take over the irrigation management. Thus, the modernization of irrigation projects has also a catalytic role as far as process of irrigation management transfer to farmers is concerned.
Bong-Hoon Lee
Rural Development Bureau, Ministry of Agriculture and
Forestry
Republic of Korea
PART I: NATIONAL POLICIES REGARDING MODERNIZATION OF IRRIGATION SCHEMES
WATER RESOURCES AND WATER DEMANDS
The total amount of water resources in Korea is estimated to be about 127 thousand million m3 per year. While 70 thousand million m3 (55%) is runoff to the rivers, 57 thousand million m3 (45%) are estimated as losses. The amount of yearly used water is 31 thousand million m3 including 2 thousand million m3 of groundwater (Figure 1).
Water resources in Korea, are closely related with the topography and rainfall patterns. Korea is a mountainous country and as 67% of the land consists of mountains, the slope of rivers is steep. Rainfall pattern is not uniform throughout the year and 65% of annual average precipitation (1 274 mm) falls from June to September. Therefore, the difference of river water level between the rainy season and the dry season is quite large, and as such reservoir construction is important in Korea.
The quantity of runoff water of Korea’s five major rivers is shown in Table 1. Runoff from these 5 major rivers is 46 thousand million m3 per year, which is equal to 66% of the total river runoff in Korea, and plays an important role for water supply. Each river’s forecasted water demand and supply are shown in Table 2.
Water demand in Korea mainly consists of domestic, industrial, agricultural and river navigation use. These water demands tend to increase gradually and will increase to 37 thousand million m3 in 2021, which is a 28% increase compared with the current demand (see Table 3)
IRRIGATION SUBSECTOR CONTEXT
In Korea, the importance of irrigation for paddy production cannot be overemphasized as rice is the main food crop. Comparatively, research and investments which are supported by government are not sufficient.
FIGURE 1. General status of water resources in Korea (unit: thousand million m3)
TABLE 1
Average yearly runoff of five major rivers (unit:
million m3/year)
|
Name |
Han |
Nakdong |
Keum |
Youngsan |
Seomjin |
|
Average Runoff |
19,385 |
13,946 |
6,205 |
2,588 |
3,831 |
|
Name |
Han |
Nakdong |
Keum |
Youngsan & Seomjin |
|
Demand (A) |
12,482 |
10,562 |
7,582 |
5,574 |
|
Supply (B) |
10,548 |
9,484 |
7,478 |
5,645 |
|
Balance (B-A) |
-1,934 |
-1,078 |
-104 |
71 |
|
Name |
1993 |
2001 |
2011 |
2021 |
|
Demand (A) |
28,961 |
33,188 |
36,200 |
36,988 |
|
Supply (B) |
31,261 |
33,030 |
33,155 |
33,047 |
|
Balance (B-A) |
2,300 |
-158 |
-3,045 |
-3,941 |
|
|
Total |
Reservoirs |
Pumping Stations |
Weirs |
Wells |
|
Number of Facilities |
58, 454 |
18,179 |
5,827 |
18,455 |
5,993 |
|
Irrigated Paddy field (thousand ha) |
|
517 |
163 |
110 |
151 |
|
Ratio |
941 |
55% |
17% |
12% |
6% |
The total area of Korea’s farmland is around 2 million ha consisting of 1.2 million ha of paddy land and 0.8 million ha of upland. Water resources are available only for 0.9 m ha (75%) of the total paddy land. Water resources for irrigation are from reservoirs, pumping stations, diversion weirs and tubewells. Reservoirs are the main source for paddy irrigation.(see Table 4)
In cases of severe drought (once in 10 years), only 32% of the paddy land can be irrigated. Continuous development of water resources is needed to increase the area under irrigation.
GOVERNMENT POLICIES FOR MODERNIZATION PROGRAMMES
Government policies for modernization of irrigation schemes mainly focus on raising the irrigation efficiency through complementary water resources development, canal lining, automatization of irrigation management, rehabilitation of irrigation facilities and improvement of drainage.
A comprehensive plan for the above mentioned programmes has been taken up by the Government and actively pursued. The plan is called “10 Year Plan for Rural Water Development”. The yearly investment plan is shown in Table 5. During 10 years (from 1995 to 2004), 296 thousand ha of paddy land will be irrigated and more than 17 thousand million dollars will be invested in this plan. After the completion of this plan, the irrigation rate of paddy land might be raised from the present level of 75% to 88% and the irrigation rate in years with severe drought would be increased from the current 32% to 60%.
TABLE 5
Ten-year plan for rural water development
|
Projects |
Area being irrigated (million ha) |
Investment (million $) |
|
|
|
|
1995-1998 |
1999-2004 |
|
Surface water development |
166 |
1,593 |
5,455 |
|
Groundwater development |
30 |
682 |
1,149 |
|
Large-scale comprehensive development |
100 |
1,482 |
3,639 |
|
Total |
296 |
4,535 |
12,838 |
Projects with a command area larger than 50 ha are implemented by FIA and after completion of the projects, FIA takes over the irrigation management responsibilities. “Heung-Nong-Kye”, which is organized in every village as a WUA and belongs to FIA, takes care of the management of tertiary canals and irrigation at farm level. However it is not working well because of member farmers’ indifference. One of the main reasons for farmers' indifference is the reduction of water fees. In 1989, MAF decided that the maximum rate of water fee would be 5 kg of brown rice/10a2. It is just 1% of the rice yield from the area. The rest of the water fee(around 20 kg/10a) comes from the government budget. The situation is aggravated as farmers do not want to participate in maintenance work but expect that government or FIA are taking over this work.
Small-scale irrigation projects with less than 50 ha are implemented by local government(city or county), and the responsibility of irrigation management after completion is transferred to the WUA which is called “Nongji-Kaeryang-Kye.” MAF does not support them financially, and the WUAs have to secure their own management budget or they have to do maintenance work themselves. In principle this organization also does not function well. Therefore strong reforms of the government support system are required to improve farmers' participation in irrigation management.
AGRICULTURAL SUPPORT SERVICES
All the modernization projects are executed with 100% support of the central or local government and there are no farmers’ contributions. Therefore MAF has no special agricultural support services to the farmers who are cultivating in the project area.
FARMERS' PARTICIPATION
The five stages of modernization of irrigation schemes are: the planning stage, feasibility study stage, detailed design stage, implementation stage and assessment stage.
At the planning or feasibility study stage, the surveyor tries to hear farmer's opinion in order to change the proposed plan. At the design stage, farmer's opinion can be reflected through public hearing. Institutionally it seems possible to reflect most of the farmers' opinion regarding the detailed design, but in reality it is very difficult to consider all opinions since this would delay project implementation which is not in the interests of government.
Modernization projects are implemented either by FIA or by the city and county. The involvement of the Central government (MAF) and the provincial government is restricted to the supervision of FIA or of the city and county. Farmers do not contribute to the implementation of the projects at all by labour or by money.
IMPACT OF MODERNIZATION PROGRAMME
The impact of modernization results in an expansion of the irrigated area, increased water distribution efficiency and equity, increased agricultural production, reduction of farmers’ labour and increased flexibility in crop diversification. Asystematic assessment of the modernization programmes in Korea has not been undertaken. The importance of such as assessment, however, should be recognized, as valuable improvements can be achieved through such a study.
FUTURE TRENDS
One of the most difficult problems in irrigation management is the lack of government subsidy given to FIA. Introduction of an automated irrigation management system is one way to reduce staff without sacrificing efficiency. At a first stage, an automated irrigation management system could be installed in large-scale irrigation projects, and then gradually introduced into smaller projects.
INTERNATIONAL SUPPORT
Cooperation from international organizations like FAO, IPTRID, IIMI, ICID with regad to modernization of irrigation scheme in Korea is needed. First of all, a training programme for young engineers should be drawn up to enlarge their experiences and widen their knowledge. International organizations can play an important role for arranging these training programmes.
PART II: CASE STUDIES: AUTOMATED WATER MANAGEMENT SYSTEM IN THE MAEHO PROJECT
NEED FOR AN AUTOMATED WATER MANAGEMENT SYSTEM
One of the reasons why irrigation management techniques are still not developed in Korea is that water management is still done by empirical methods. The problems associated with empirical irrigation management are as follows:
These problems can easily be overcome with an automated water management system which controls systematically all irrigation facilities. The system introduced in the Maeho project is called TC/TM(Tele-control/Tele-metering) system, and its advantages are as follows.
IRRIGATION PLAN FOR THE MAEHO PROJECT AREA
The Maeho district is located in Seong-ju, Kyung-Book province, in the southern part of Korea. Total irrigated area is 744 ha and yearly 3 500 metric tons of brown rice are produced in this area. The Deoka reservoir and Maeho pumping station were constructed 30 years ago for provision of irrigation water to the project. Details of the Deoka reservoir and the Maeho pumping station are shown in Tables 6 and 7.
TABLE 6
Maeho pumping station
|
Irrigated Area |
Capacity of pumps |
Diameter of pumps |
Quantity of pumped water |
|
561 ha |
400 HP x 2 |
500 mm x 2 |
0.997 m3/s |
|
|
250 HP x 2 |
550 mm x 2 |
0.580 m3/s |
|
Irrigated Area |
Storage Capacity of Reservoir |
Storage in depth Per Unit Area |
Diameter of intake pipe |
|
183 ha |
1,096,000 m3 |
598 mm |
0.6 m |
TC/TM SYSTEM OF MEAHO PROJECT
Constitution of TC/TM system
The TC/TM system mainly consists of three sub systems. The first one is the data system which gathers, delivers and stores real time data, the second one is the model system supporting irrigation planning, and the third one is the decision support system which can be used through menu driven methods and color graphic presentation.
Data system
· Gathering the data.
The data system consists of 3 stages. The first stage is the gathering of real time hydrological data to analyse the irrigation situation of the Maeho area. These data are water depth in the reservoir, river and irrigation canal together with rainfall data in the catchment area.
· Delivery of the data.
The second stage is the delivery of the gathered data to the Central Management Office.
Three communication methods are applied using either own cables, telephone lines or micro waves. In the Maeho project, the applied communication method uses a telephone line with a modem.
· Management of the data.
The third stage is the management of the gathered data. Due to the frequent data transmission from sensors, the quantity of data is tremendous, and therefore a Database Management System is necessary to handle these data properly.
Model system
A computer model was developed for.
Decision support system
The TC/TM system is fundamentally managed by the computer, and therefore a high level of computer skills is needed. In this TC/TM project, a menu driven method is adopted so that users can get the result easily on color graphics.
System details of Maeho TC/TM
Communication and remote control
The water depth of the reservoir, river and canals is measured by sensors and is delivered to the Central Management Office through a modem and telephone line. There are 22 stations on the three main irrigation canals to measure the real time water depth. Furthermore the pumping stations, several main gates in the reservoir and the irrigation canals are tele-controlled by the main computer.
Data control system
The functions of the data control system are as follows,
Computer programs for operation
Plan for investment and implementation
The total amount required to complete the Maeho TC/TM project was 933 million Won (1.1 million $). About 300 thousand $ were invested every year from 1994 to 1997. Research and detail design were carried out from 1994 to 1995 by the Seoul National University. In 1996, installation of the system was commenced and is going on until 1997. The TC/TM system is expected to start functioning in the latter part of 1997.
Anticipated problems on implementation of TC/TM system
The problems which can be anticipated on implementing the TC/TM system are:
Teh Siew Keat
Director, Irrigation Division, Department of Irrigation and
Drainage,
Jalan Sultan Salahuddin, Kuala Lumpur,
Malaysia
INTRODUCTION
Malaysia is comprised of two regions, Peninsular Malaysia and the States of Sabah and Sarawak. It has a total area of 330 000 km2 and a population of 18.9 million with a growth rate of about 2.6 percent per annum. Malaysia has a tropical and monsoon climate. The annual rainfall is 2 420 mm for Peninsular Malaysia, 2 630 mm for Sabah and 3 830 mm for Sarawak. The annual rainfall volume amounts to 990 thousand million m3, of which 360 thousand million m3 (36%) returns to the atmosphere as a result of evaporation and transpiration, 566 thousand million m3 (57%) appears as surface runoff and the remaining 64 thousand million m3 (7%) as recharge the groundwater.
About 20% of the land in Malaysia is currently utilized for agriculture, of which more than two thirds are for industrial crops, mainly rubber and oil palm while paddy cultivation covers 660 000 hectare (2 % of total land area). Agriculture will continue to play an important role in the Malaysian economy. Irrigated agriculture, producing food crops such as rice, vegetables and other short-term food and animal feed as well as high-value floriculture crops, will continue to focus on fresh food for consumption as well as for downstream processing into higher value-added commodities. The production of rice, the staple food of the Malaysians, will be intensified in existing granary areas to fulfill a 65% self-sufficiency level. However, the production of all other food commodities would be market-led and domestic resource cost considerations will predominate. The agriculture sector's share of Gross Domestic Product in 1995 was 13.6% (or RM 16 406 million at 1978 price). The sector is targeted to grow at 2.4% per annum during the Seventh Malaysia Plan (1996-2000) to an annual value of RM 18 460 million by year 2000. The targeted growth is based on enhancing productivity, efficiency and modernization.
WATER RESOURCES AND WATER DEMAND
The current total water demand is about 12.5 thousand million m3, 75% of which is for irrigated agriculture. The domestic and industrial demand to irrigation demand ratio is expected to increase to 30:70 by year the 2000, with total demand reaching 15 thousand million m3. This demand of 15 thousand million m3 is a mere 2.6% of the average annual water resources where the surface runoff is estimated at 566 thousand million m3.
However, despite the seemingly abundant water resources, instances of acute water shortages have occurred in various parts of the country affecting both agriculture and public water supplies. This is largely due to the uneven distribution of rainfall both in time and space. As water resources become more difficult and expensive to develop, there is a need to step up irrigation performance and improve the efficiency of water management at various levels, the watershed, the conveyance and on-farm.
DEVELOPMENT OF WATER MANAGEMENT IN AGRICULTURE
Irrigation development in Malaysia dates as far back as the end of the eighteenth century. The Kerian Irrigation Scheme was the first of the large schemes to be constructed in the year 1892. Since the formation of the Department of Irrigation and Drainage in the year 1932, following an acute rice shortage after the Great Depression, irrigated areas for paddy cultivation progressively increased. By the year 1960, about 200 000 hectares had been developed, the emphasis then being to supplement rainfall for single crop cultivation.
During the 1960s and early 1970s, the advent of double rice cropping required the development of adequate water resources for the off season crop. To meet the additional irrigation requirement, large dams, major pumping installations and conveyance and distributary systems were developed.
During the 1980s, the priority for irrigation took a new dimension with the need to rationalize rice cultivation regarding production cost and profit considerations. Since Malaysia does not have the comparative advantage in rice production due to high investment and production costs, irrigation development was confined to the eight large irrigated areas in the country, designated as Granary Areas totalling 210 500 ha and comprising the irrigated areas of MADA, KADA, Seberang Perai, Trans Perak, Northwest Selangor, Kerian-Sungai Manik, Besut and Kemasin-Semarak. Irrigation facilities were intensified and extended to the tertiary levels to provide good water management at the farm level. Paddy production from these Granary Areas has since increased significantly.
Under the Seventh Malaysia Plan, irrigation development will continue. Federal funding will be confined mainly to the eight Granary Areas with emphasis of increasing the rice production. Infrastructure development such as construction of dams, pumping stations and canal and farm road development will continue. However, there will be an emphasis placed on water management especially in improving the irrigation efficiency. The current irrigation efficiency is around 35-45% with water productivity index of about 0.2 kg/m3. This has become a matter of concern and a programme for upgrading and modernization of irrigation management has thus been formulated with a view to improving the irrigation performance.
UPGRADING AND MODERNIZATION OF IRRIGATION MANAGEMENT
With the latest policy to focus on rice cultivation in the Granary areas with expectation for an overall increase in production to sustain self sufficiency level at about 65%, water management is expected to play an important role along with other inputs. This calls for concerted efforts to step up irrigation management practices, which broadly encompasses the following strategies:
Enhancement of water resources in water stress areas
As large bulk water source development projects involving the construction of dams and pumping stations are costly, cheaper means will be simultaneously pursued including small reservoirs, conjunctive use of groundwater, recycling of drainage water and use of water from other sources. A study has been initiated to assess the irrigation supply and demand conditions for optimal crop production in all the Granary Areas.
Improving irrigation efficiency
The irrigation sector is currently the main consumer of water. Domestic and industrial water demand is increasing at a fast rate and will compete for the same source of water. The need to reduce wastages is evident and will prove crucial to sustaining irrigated agriculture in the granary areas. Measures envisaged are: (i) improved system management including automation, (ii) upgrading of irrigation facilities, (iii) recycling, (iv) rain harvesting, (v) improved on-farm management through efforts such as land levelling and formation of water user group and (vi) stepping up irrigation extension. A monitoring and evaluation system are being developed to assess irrigation performance of each granary area.
Improving cropping intensity and crop yields
There will be a review of the Granary Areas with a view to exploit the potential of increasing the cropping intensities and crop yields through rehabilitation and modernization in terms of operation and maintenance. Water management in support of changing agriculture practices (for example direct seeding) and farm mechanization (e.g. need for good drainage) will be provided.
Promoting the estate system of farming
Estate systems such as mini estates and contract farming are to be encouraged especially through the involvement of the private sector. The advantage of economy of scale will facilitate more organized and efficient management of water among others for better agriculture production.
Training
Training in water management will be provided for irrigation managers and operators, irrigation extension workers as well as farmers. The National Water Training Centre in Kota Baru will continue to serve this need. Linkages with irrigation institutions and research bodies at both national and international levels will be maintained. International institutions referred to include ICID, IIMI and FAO. A JICA assisted study related to modernization of irrigation systems in the Granary Areas has provision for on-the-job training for local counterparts.
PART II: CASE STUDY: MODERNIZATION OF KERIAN IRRIGATION SCHEME
INTRODUCTION
The Kerian Irrigation Scheme typifies several other schemes in Malaysia which are in need of similar modernization efforts. The Kerian Irrigation Scheme is located in the North West region of Peninsular Malaysia. It is one of the granary areas in Malaysia and has an area of 23 560 ha. The Scheme is divided into eight irrigation compartments as shown in Figure 1. The main source of water is from the Bukit Merah Reservoir. About 61% of the irrigation supply comes from this reservoir. A major pumping station, the Sungai Bogak Pumphouse, with four pumps of 5.1 m3/s each, is located at the downstream portion of the irrigation system, where water is pumped from the Kerian River into the main canal whenever needed. The Bogak Pumphouse contributes about 14% towards meeting the irrigation requirement. The effective rainfall constitutes only 25%.
FIGURE 1. Schematic layout of the Kerian Irrigation Scheme
The Kerian Irrigation Scheme underwent a World Bank financed rehabilitation and upgrading programme which was completed in 1987. The objective was to increase the yield from 2.55 ton/ha to 3.70 ton/ha and the cropping intensity from 157% to 190%. In terms of yield and crop production, the Kerian Irrigation Scheme has encountered difficulties in achieving the targeted figures. With the physical improvement to the irrigation infrastructures there was an immediate albeit gradual increase in the scheme production with higher yields and cropping intensities. However, as could be seen from Figure 2, the scheme performance suffered a set back after 1990. There were many reasons for this set back of varying degrees of complexity. Labour shortages, competition for water and changes in farming practices are some of the main reasons.
THE NEED FOR MODERNIZATION
With competing use by other sectors, water is increasingly seen as an economic good. Irrigated agriculture while having to increase and sustain productivity will have to reduce its water consumption and this needs to be achieved at lower financial costs and resource utilization. These challenges call for efforts involving both technological and management interventions.
Constraints in labour, land and water resources require that present and future development be mainly targeted at exploiting the full potential of increased cropping intensities and crop yields through rehabilitation, modernization and management of the existing irrigation systems. The current irrigation efficiency at around 35-45% with water productivity index of about 0.2 kg/m3 provides room for further improvement within the irrigation sub-sector. A programme for Modernization of Irrigation System has been initiated with a view to improve irrigation performance and in general the farm productivity.
By the year 2010, all the Granary Areas including the Kerian scheme are expected to increase their production by a total of approximately 0.5 million tonnes more than the production of 1990 (an increase of about 45%). The main thrust is to increase the productivity of these areas and in general, the strategy is to improve cropping intensity and yield as they are still well below their full potential. The target is to produce an overall average yield of 4.5 tonnes per hectare with at least 180% cropping intensity by year 2010. These have to be achieved at reduced water consumption and lower financial cost and resource utilization. The task will stress technological and management intervention for the production of paddy which involves large volumes of scarce resources (land, water, labour and capital).
With the direct seeding method of rice cultivation, farm machinery is widely in use in every aspect of the farming activities and farmers have started to operate larger farm lots. Farmers have now realized the importance of improved water management as a prerequisite to yield improvement and high quality products. Quartenary channels in the form of canalets and flexible hoses are some of the on-farm facilities that have been practised by farmers in their efforts to secure on-time delivery. Similar efforts have also been advocated for drainage purposes. The future scenario is that paddy production will be on an estate basis and water management will be on-demand where commercialization will take its real perspective.
The pressures on improvement of irrigation performance and the changes in farming environment make irrigation management more complex. At farm level, there is a need for real-time on-demand water management to ensure commercialize farming a sustainable venture. The system as a whole must then respond to these changes and be able to support the needs for real-time on-demand system to function.
The main strategy is to maximize the use of rainfall and minimize the release from the dam and pumping supplement while ensuring that the dam operational levels are always in the permissible range. A computer-based water management system together with telemetric monitoring of certain critical information has been installed. The irrigation management software at the work-station provides the required irrigation supply at each sub-block.
MODERNIZATION WORKS UNDERTAKEN (IRRIGATION MANAGEMENT SYSTEM)
The water management and telemetric system of the Kerian Irrigation Scheme was first started in 1990. However, it has not been fully commissioned as the system is still being improved and updated. The hardware of the irrigation management system consists of 23 rainfall or rainfall cum water level telemetric stations and desktop computers stationed at the control centre and locality offices. A schematic flow chart showing the layout for data collection and communication is given in Figure 3. Sixteen (16) more manual rainfall stations are proposed to be converted to the telemetric type with automatic rainfall recorders.
Rainfalls are scanned daily at 08.00 hours while water levels are scanned hourly by the monitoring software and stored in the server at the control centre. In the event of breakdowns of some of the telemetric stations, the operators at the field will be contacted by VHF radio/telephone so as to take manual readings. These data can then be keyed in the computers in the locality offices and the data are transmitted for storage in the server at the control centre.
Presently, the flow rates through the dam and main canal regulators are obtained manually through daily readings of the gate openings and water levels concerned. Similarly, daily readings of the three evaporation pans are also done manually. Hourly data on the pumping rates and the numbers of pump running from the Bogak Pumphouse are transmitted by the pump operator via the computer in the pumphouse.
The daily flows through the CHO along the main canals are obtained from two sets of water levels and gate opening readings taken at 08.00 and 16.00 hours. The irrigation technicians are required to input these flow data at the computers in their locality offices which are linked to the server at the control centre. Every Tuesday, the Irrigation Technicians are requested to collect data on the progress of supply and field activity. These weekly data are transmitted every Wednesday to the control centre through the locality offices.
A supervisory computer interfaces with a Front End Processor which scans the stations at selected intervals for the field data and then transmits those data to the computer for storage in the hard disk. The water levels are monitored at various strategic points of the main canals near the headworks and regulators, inside the reservoir as well as at critical river points upstream and downstream of the reservoir.
Currently, however, due to some interface problems between the Front End Processor of the telemetry system and the supervisory softwares (both were upgraded in stages since 1995), water budgeting is done more for seasonal and weekly planning purposes including decision for pumping supplement.
The weekly water demand is determined for the individual command areas based on the irrigation duties while demands for domestic and social purposes are allowed for. Weekly contributions of effective rainfall are predicted at 70%, 80% and 90% confidence levels for effectiveness of 50%, 40% and 30% respectively. The weekly inflow probability curves with confidential levels of 70%, 80% and 90% are prepared for the water resource from Bukit Merah Reservoir and it is based on 25 years of dam inflow records.
FARMERS’ PARTICIPATION IN THE PROCESS OF IMPLEMENTATION
Farmers are not directly involved in the implementation of the development programme. However, their farming practices undoubtedly become one of the critical factors in the success of the programme. Farmer leaders together with the various other agencies will determine an acceptable cropping schedule to be gazetted before the start of a new cropping schedule. The Department of Irrigation and Drainage provides advice on the expected adequacy of water supply for the forthcoming season. Cropping schedules are designed to enable the optimum use of rainfall in both seasons, harvesting to be done during the drier months and reducing the peak demand for supply during the presaturation periods. Farmers are requested to cooperate by adhering strictly to the gazetted schedule.
Farmers were also requested to capture as much rainfall as possible by constructing farm ridges where necessary and maintaining them. The recommended farm ridges constructed from local spoil will allow storage of up to 225 mm of water while irrigation water is normally maintained at 100 mm. Selected farms with the cooperation of the farmers are used to mark and record field water depth where the daily data collected by the field offices are used as input to the water allocation model.
ASSESSMENT OF RESULTS ACHIEVED
The overall percentage of potential effective rainfall has been computed to be about 73% in the Kerian Scheme. Assuming an average application efficiency of 75%, the estimated actual effective rainfall is 54%. The actual overall contribution of effective rainfall to total supply was found to be 25%, which is higher than the 15% assumed in the design of the scheme. By adopting the water management system which is more responsive to effective rainfall and actual field water demands, the percentage of contribution of effective rainfall is expected to increase from the present 25% to about 30%.
The improved water management system adopted by the Kerian scheme has so far proved to be helpful. Data collected subsequent to the development of the water management system are now being effectively utilized by the system in its decision making process. The involvement and interaction of all parties involved in the development of the water management system provides the irrigation personnel with greater understanding of the scheme characteristics. Farmers have also responded positively towards improving the overall scheme performance.
A kind of team work has evolved from this programme. Quality of data and services have improved since the implementation of the water management system. The people involved in data collection are responding positively to the accuracy and timeliness of the information required. The whole process has brought about a new sense of responsibility and awareness to the scheme operators hence better quality of information and decision.
IMPACT OF IMPROVEMENT ON FARMERS’ FIELDS
Good water management is essential from the land preparation stage until the harvesting stage so that appropriate agronomic practices and technologies could be effectively applied. Adequate water depth will retard weed growth and facilitate the effective application of weedicides. The most critical period is 10 to 30 days after transplanting or 0 to 30 days after direct seeding. Good water management is also needed from nursery stage to harvesting stage to enable an effective pests and disease control programme to be carried out.
Due to labour shortage, farmers prefer the direct seeding method of cultivation but due to drainage problem, difficulty in water distribution and reverse land slope make it quite hard to practise. However, farmers are now more concerned and sensitive to on-farm water management. Though the scheme area is designed for transplanting, direct seeding is already being practised in 40% of the area and it is getting more popular. Where mechanization of farm activities is made possible from improved water management especially drainage, farmers would convert to direct seeding.
FINANCIAL IMPLICATIONS OF THE MODERNIZATION ACTIVITIES
The water allocation system model was developed in-house by the Kerian Irrigation personnel. Apart from the telecommunication systems, the real-time water level and rainfall stations and the computers at the control centres utilizes all the existing infrastructure. The total amount spent on the development of the system is small (less than 1%) as compared to the RM293 million spent on the infrastructure development.
However, under the current seventh Malaysia Plan, some RM5.0 million has been allocated towards modernization of the scheme. This includes improvements to the collection and management of real-time data, improvement of the decision support system and automation of some critical structures to enable on-demand system delivery.
OTHER RELEVANT INFORMATION
The current development is still far from complete. For efficient water scheduling in the Kerian Scheme integrated efforts of the following components are necessary:
1. Management information system - For irrigation managers to manage the Kerian Scheme effectively, they must be able to access all information required for decision making and easy management, preferably on line. The types of information are the real time data which includes the hydrological data as well as data on scheme infrastructure; and secondly the relational database to be maintained at the main server. Some of these data are still manually obtained but have to be upgraded to suit the current need.Improvement of drainage infrastructure and farm road system is unavoidable. This will improve the use of farm mechanization in the area. The government has allocated a substantial amount of money in the Malaysian Seventh Plan to bring about good drainage and farm road facilities to the scheme. The area of improvement includes the construction of more farm roads, major drains, more drainage channels along the farm road and the introduction of a drainage polder system in specific areas. A drainage polder pilot project is going to start soon.2. Decision support system - The current model will be improved to ensure its capability of providing seasonal planning based on projection of water balance, daily water allocation based on actual field water requirements and also performance assessment to assist the irrigation manager. The outputs deemed necessary to help the irrigation manager in his daily decision making would be as follows:
- Real-time reporting of rainfall distribution and strategic water levels.
- Interpolated rainfall data to produce isohyet maps for any specific period.
- Computed daily water demand for each irrigation block and the discharges required at selected structures. Gate settings for regulators computed.
- Computed theoretical demand and actual supply at each level for continuous performance monitoring.
- Various types of report for daily, monthly and yearly performance monitoring and evaluation.
3. Enforcement of the decision - The main task is to ensure that farmers take only the amount of water needed and follow the set planting schedule. Institutional reform backed by legislation and policies have to be implemented. The farmers have to work together as a group and be trained to meet these requirements.
With good irrigation and other system facilities, reformation on irrigation management could be more readily introduced. Well organized farming cooperatives will be in a better position to manage the scheme professionally resulting in the increase of yield and reducing the operation cost.
CONCLUSIONS
The development objective of the Kerian Irrigation scheme is to enable an increase in production from 2.55 tonne/ha to 4.5 tonne/ha by year 2010 and an increase in the cropping intensity from 157% to 180%. These objectives have to be achieved with reduced water consumption and at lower financial cost and resource utilization.
The improved water management system adopted by the Kerian scheme has so far proved to be helpful. The development process itself provides the irrigation personnel with greater understanding of the scheme characteristics. Farmers have also responded positively towards improving the overall scheme performance.
However, the current development is still far from complete. The future development would be to improve further the collection and management of real-time data, improve the decision support system and automate some critical structures to enable on-demand system delivery.
ACKNOWLEDGEMENTS
The author is grateful to Ir. Mohd Azhari bin Ghazalli and Ir. Fauzi bin Abdullah, engineers of the Irrigation Division of the Department of Irrigation and Drainage Malaysia, for their assistance in the preparation of this paper.
REFERENCES
Ahmad bin Abdullah, 1995, Kajian semula Program Kerja Rancangan Malaysia ke Tujuh (RM 7) Subprojeck Kerian.
Economic Planning Unit, 1996, Seventh Malaysia Plan 1996 - 2000.
Ministry of Agriculture, 1993, The National Agricultural Policy (1992-2010).
Shahrizailla bin Abdullah, 1991, Irrigated Agriculture in Malaysia - Future Trends and Challenge. Keynote Address at the National Conference on Irrigated Agriculture, Johore Bahru, Malaysia, 1991.
Teh Siew Keat, 1989, Irrigation Management in Kerion Irrigation Scheme, Seventh Afro-Asian Regional Conference in Tokyo, 1989.
Teoh Boon Pin, 1996, Malaysia: Kerian Scheme.
Muhammad Yasin, Senior Scientific Officer,
and Shahid Ahmad, Director,
Water Ressources Research Institute, National Agricultural
Research Centre, Islamabad,Pakistan
LAND AND WATER RESOURCES OF PAKISTAN
Rainfall
Most of the land area of Pakistan is classified as arid to semi-arid because rainfall is not sufficient to grow agricultural crops, forests, fruit plants and pastures. The average annual rainfall distribution based on% of the geographical area is presented in Table 1. About 68% of the geographical area lies under annual rainfall of 250 mm, and about 24% under annual rainfall of 500 mm. This leaves only 8% of the geographical area where the annual rainfall exceeds 500 mm. Supplemental water for profitable agricultural production is therefore required either from irrigation or through rainwater harvesting. Thus water is one of the most limiting constraint for agricultural production in Pakistan.
TABLE 1
Average annual rainfall distribution based on% of
geographical area.
|
Rainfall (mm) |
Percent geographical area |
|
<125 |
20 |
|
125-250 |
48 |
|
251-375 |
14.5 |
|
376-500 |
9.5 |
|
501-750 |
3.2 |
|
751-1000 |
2.6 |
|
1001-1250 |
1 |
|
1251-1500 |
0.6 |
|
1501-1750 |
0.6 |
Pakistan is divided into three hydrological regions. The Indus basin, covering more than 556 000 km2 is the major source of Pakistan's water; the Kharan desert in West Balochistan with inland drainage; and the arid Makran Coast along the Arabian Sea in the southern part of Balochistan. The deserts in the south (Thar and Cholistan) have no water resources. The flows to the Indus are from glacier and snow melt, as well as from rainfall outside the Indus plain.
The Indus river system is the prime source of Pakistan's water resources. It commands over 14 million ha area and encompasses the Indus river and its major tributaries, three reservoirs (Tarbela, Mangla and Chashma), 19 barrages or headworks, 12 link canals, 43 canal commands and over 107 000 watercourses. The length of the canals is about 61 000 km with communal watercourses, farm channels and field ditches, covering another 1 600 000 km.
Groundwater resources
In addition to a large canal network, there are about 325 400 tubewells including 309 100 private and 16 300 public tubewells, in Pakistan.
FIGURE 1. Water budget of Indus basin irrigation system
The average capacity of a private tubewell is about 30 litres per second and the designed capacity of public tubewells ranges from 60 to 120 litres per second. According to agricultural statistics of Pakistan, 1990-91, an area of about 4.60 million hectares is being irrigated by these tubewells in Pakistan.
Water budget
The average annual flow available in the Indus river is approximately 175 km3. The average annual river diversions to the canal system are about 125 km3. The estimated losses in the canal system are assumed to be 25% which leaves 94 km3 of water available to the watercourses of the command areas. However, within the watercourses commands, public and private tubewells provide an output of approximately 41 km3, making 135 km3 water available at the head of the watercourses. The water budget of the Indus basin is shown in Figure 1.
In the Indus basin irrigation system, river water is diverted by barrages and headworks into main canals and subsequently into branch canals, distributaries and minors. The flow to the farm is delivered by the watercourses which are supplied through outlets (Moghas) from the distributaries and minors. Within the watercourse command (an area ranging from 80 to 285 hectares) farmers receive water proportional to their land holdings. The entire discharge is given to one farm for a specified period on a seven day rotation.
Land utilization
The cultivated area is classified as canal command, tubewell command, sailaba and barani (Table 2).
Irrigation plays a central role in Pakistan's economy. Irrigation supplies more than 90% of agricultural production (by value) and most of the country's food, which accounts for 26% of GDP and 54% of the employed labour force. It is also the source of raw materials for major domestic industries, particularly, cotton products which accounts for 80% of the value of exports.
PAST EXPERIENCES
Fixed rotation continuous flow irrigation system
The Indus basin irrigation system in Pakistan is the world's largest contiguous system. The system is designed in such a way that it flows continuously. The storage capacity is limited. The farmers get water after a fixed rotation regardless of the requirements of the crops. The farmers receive water proportional to their land holdings. The entire discharge of the watercourse is given to one farm for a specified period on a seven day rotation. There is no flexibility in the system. If a crop needs water after nine or ten days, it will get water after seven days or fourteen days. The farmer decides which field at the farm is to be irrigated according to economic benefits. He or she has to prioritize for irrigation application due to shortage of water, but during the rainy season even though the requirements of irrigation water are very small, the farmer gets water on his or her turn.
TABLE 2
Land utilization in Pakistan
|
Type of Irrigation |
Area (mha) |
% age |
|
|
1. Canal Irrigation |
|
||
|
|
Perennial |
8.19 |
10.3 |
|
Non-perennial |
5.8 |
7.3 |
|
|
Culturable waste inside CCA |
(-)2.25 |
(-)2.9 |
|
|
|
|
|
|
|
Total: |
11.74 |
14.7 |
|
|
2. Wells, Streams, karezes, etc. |
5.22 |
6.6 |
|
|
3. Sailaba (riverain) |
1.25 |
1.6 |
|
|
4. Sailaba (torrent) |
0.97 |
1.2 |
|
|
5. Barani (rainfed) |
4.15 |
5.2 |
|
|
|
|
|
|
|
Sub-total: |
11.59 |
14.6 |
|
|
|
|
|
|
|
6. Total cultivable area |
23.33 |
29.3 |
|
|
7. Other land uses |
|
||
|
|
Rangelands |
8.62 |
10.9 |
|
Forests |
3.44 |
4.3 |
|
|
8. Total suitable area for agriculture & forestry |
35.39 |
44.5 |
|
|
9. Total unsuitable for agriculture forestry |
44.22 |
55.5 |
|
|
10. Total area of Pakistan |
79.61 |
100 |
|
The main issue is how to provide flexibility and dependability in the irrigation system under the prevailing conditions. The collection of water in farm reservoirs or community reservoirs during the rainy season and when water is not required by crops may bring some reliability into the system. Another option may be to collect water in farm reservoirs during the irrigation turn and use it by means of by pressurized irrigation systems according to the requirements of the crop.
Salinity control and reclamation projects
In order to tackle the waterlogging and salinity problems, an extensive programme of investigations was initiated in the 1950s which covered soil and salinity surveys, determination of sub-surface hydrologic conditions and the properties of the aquifer as well as the other hydrologic factors effecting the groundwater regime. Based on the results of these investigations projects were formulated for the control of waterlogging and salinity.
Under the Salinity Control and Reclamation Projects (SCARPs) drainage projects have been planned and implemented in the canal-irrigated areas. In some areas only surface drainage has been provided, whereas in most of the areas sub-surface drainage has been provided by means of tubewells. These tubewell projects were initially planned for areas underlain by fresh groundwater so that the pumped water could supplement canal supplies for intensive agriculture. SCARP projects have also been planned for areas where groundwater is saline, and both the vertical and horizontal methods of drainage have been used.
Investigation findings
The extensive investigations indicated that geologically the entire Indus Plain is an alluvial deposit with a thickness is over 1500 m. This feature permits the installation of tubewells of large capacity at almost any desired location.
The quality of the groundwater in the aquifer is quite variable. There is a substantial area of 10.12 million ha within the gross canal commanded area where the groundwater up to a depth of 100 m has total dissolved salts of less than 3000 ppm and a tolerable sodium content. These conditions have led to the adoption of tubewells or the vertical method of sub-surface drainage.
So far, about 35 small and large projects have been implemented for draining a total area of 5.71 million ha. In the fresh groundwater areas the projects involve the installation of 12,875 tubewells with an installed capacity of 998 m3/s and cover an area of 3.09 million ha. Drainage in saline groundwater areas by means of 2016 tubewells (installed capacity 102 m3/s) has been provided in projects having an area of 0.77 million ha. Surface drainage is included in projects covering an area of 1.85 million ha.
Sub-surface drainage
Sub-surface drainage was the primary objective of the SCARP projects, and this in turn was expected to provide a check on secondary soil salinization.
In planning these projects, the 'drainable surplus' has been estimated and equivalent quantity of groundwater has to be pumped over the year in order to stabilize the water at a depth of 3 to 4.5 m. This implies the concept of 'balanced recharge pumping' whereby no mining of ground water takes place. In the initial stages of project operation, characterized by a high water table, groundwater in storage has to be evacuated to lower the water table.
The concept of balanced recharge pumping has also been applied over long-term periods in some SCARPs where it is proposed to intensify cropping in subsequent phases by increasing the canal supplies by canal remodelling. This is exemplified by the SCARP North Rohri in which the cropping intensity is projected to increase to 150% from the existing level of 102% in a period of 30 years. The projected levels of development would require an increase in the capacity of distributary canals of 70%.
Basically, sub-surface drainage requirements determine the quantum of groundwater that can be pumped in any SCARP project. However, this pumpage can be distributed over the year and, in conjunction with the available canal supplies, can be made to match crop water requirements with the total irrigation supplies.
The drainable surplus in the fresh groundwater areas of the canal commands in the Indus Plains is quite substantial; expressed as an annual depth of water over the area it varies from 0.12 to 0.18 ha m, compared with canal supplies of 0.18 to 0.25 ha m. Thus a considerable increase in irrigation supply is possible.
Water use in SCARP projects
The basic principle followed in the SCARP projects is to meet peak water requirements by the conjunctive use of surface and groundwater, or entirely by the groundwater if no canal supplies are available. The maximum pumpage requirement in any period, determines the capacity of the tubewells to be provided, after allowing for an efficiency factor.
The tubewells in SCARPs are so sized and located that the pumped water can completely serve one or more outlet commands. The tubewell water is led into the main watercourse just below the outlet so that it is mixed with the canal water. The augmented supply is then equitably distributed to the farms according to the fixed turns utilizing the existing water distribution system.
The canal outlets flow continuously but the tubewell pumpage in the SCARPs has to be controlled. With the capacity of the tubewells determined by the peak water requirements, the annual tubewell utilization has to be 55 to 60% in order to pump out the drainable surplus. Thus, in the SCARP projects it is possible to distribute the additional tubewell water equitably and fairly to the farmers according to crop water requirements, if the operating schedules are properly drawn up.
Water quality
In the SCARP projects, where the tubewell water has to be used for irrigation, the boundaries of the projects were so determined that the expected quality of water would not pose any hazards for the soils or crops. The results of groundwater investigations were used for this purpose. In the case of perennially irrigated areas, there is instantaneous mixing of the tubewell water with the canal water but in the areas served by non-perennial canals mixing is possible only in one season, and groundwater alone has to be used for irrigation in the dry season. Since canal water has a very low salinity (TDS ranging from 200 to 300 ppm), the quality of groundwater is considerably improved by mixing. TDS of tubewell waters in SCARPs I to IV, indicate that more than 90% of the tubewells have a TDS below 1500 ppm and only about 5% are in excess of 2000 ppm. The corresponding values of SAR are generally less than 7.5. After mixing with canal water in almost equal quantities, the quality of irrigation water remains satisfactory. In non-perennial areas unmixed groundwater is used mostly for wheat, which is a salt-tolerant crop, and larger canal-water allowances in the following season permit a ready means for leaching any seasonal salt build-up. Thus, quality of irrigation water does not pose any problems as far as water use at the farm level is concerned. In some cases, however, proper management of the water is required.
Operational procedures
In the operation of the SCARPs no sophisticated procedures have been developed, but an attempt is made to maximize the use of supplementary groundwater supplies and to meet the crop water requirements to the best possible extent. Operating schedules for the tubewells are determined by months for full rotational turns so that all the farmers get the benefit of the supplemental irrigation supplies. During the periods when the canal supplies are short and natural precipitation is deficient, fullest use is made of the tubewells to meet the demand of irrigation water. On the other hand, if there is an excessive rainfall the tubewells are promptly stopped to avoid waterlogging. Thus, the flexibility inherent in the use of the tubewells permits the matching of the irrigation demand to the irrigation supplies. The combined effect of increased crop areas and crop yields has brought about very substantial increases in productivity in the SCARP areas.
The operation and maintenance of SCARP tubewells is becoming impossible due to shortage of funds. The issue is how to operate and maintain these tubewell for sustainable agricultural development.
On-farm water management
The Government of Pakistan with the assistance of the US Agency for International Development (USAID) launched an “On-Farm Water Management Development Pilot Project in selected irrigated areas during 1976-77 with the following objectives:
The results of the pilot project were very encouraging. The targets laid down were achieved one year ahead of their schedule. The scope of the On-farm Water Management Technology was extended to other major irrigated areas in Pakistan with the technical and financial assistance of foreign agencies such as World Bank, Asian Development Bank, International Fund for Agricultural Development (IFAD) and USAID.
The components of the On-farm Water Management (OFWM) Programme are as follow:
Watercourse improvement
Watercourse improvement is the most important component of the OFWM Programme. Improvement has been made according to engineering designs based upon topographic and profile surveys of the command area. An existing watercourse is completely demolished, a pad is constructed for earthen reconstruction and a proper slope is given to the watercourse. After earthen improvement, water control structures such as concrete nakkas, culverts, drop structures and buffalo walows are installed at appropriate places. The water users provide all the unskilled and semi-skilled labour for the earthen reconstruction as well as the masons, required for construction purposes. However, 25% of cost of the material is recovered from the water users in 10 instalments over five year with a two-year grace period. Brick lining up to 15% of the total improved length of the watercourse in fresh groundwater zones and 30% in saline areas is intended to minimize water losses.
Accelerated watercourse improvement
For providing rapid benefits to the farming community, the accelerated watercourse improvement programme was started. Under this component, the watercourses were heavily cleaned, straightened, watercourse banks were strengthened and nakkas and culverts were provided at the junction places. Although a substantial amount of water has been saved through this accelerated programme, yet the farmers prefer to have their watercourses improved under the regular programme. Therefore, this programme has been discontinued by the Government since 1985-86.
Watercourse improvement crash programme
On the directive of the President of Pakistan, a crash programme involving heavy cleaning and maintenance of watercourses on self-help basis was launched by the Punjab Government during the year 1979-80. The main objective of this programme was to rehabilitate/renovate all the 54 000 watercourses in the Punjab with the active participation of farmers and officials of the nation-building departments under the overall supervision of the Deputy Commissioners. The renovation of all the 54 000 watercourses (250 000 km in length) was completed in four years. The crash programme was discontinued in 1985-86. The implementation of the watercourse improvement crash programme in the Punjab created awareness, motivation and interest amongst the water users to adopt the OFWM technology.
Precision land levelling
Land levelling is the technique of moving soil between high and low points to bring them to the same elevation. This results in the elimination of unwanted ditches, field watercourses and dikes/bunds. Proper precision land levelling (PLL) not only allows the irrigation water to spread evenly but also results in uniform seed germination and control of the loss of plant nutrients. Under the PLL programme, farmers' fields are surveyed, staked and designed at the appropriate elevation. The volume of earth work is calculated, based upon cut and fill ratio. PLL equipments such as bucket/wheel type scraper, land leveller, chisel plough, border disc, ditcher, etc, are made available by the project to the farmers on a very nominal rent. Free technical assistance is also given. Now, laser technology has been introduced to reduce time and labour and to achieve greater accuracy but it is cost-effective only on plots of a larger size.
Irrigation agronomy
Irrigation agronomy is an integral component of the OFWM Project. The techniques for efficient farm irrigation are being demonstrated to the farmers on plot and demonstration farms focussing on when, how much and how to apply irrigation water along with other agronomic inputs to obtain the best results. It has been shown that with the same amount of water at his disposal, the farmer was in a position to irrigate about 30% more land in the same length of time on account of better irrigation methods and improved water management practices.
For the training of project personnel, extension workers and water users, a training institute has been established at Lahore. This institute meets the training demands from all over the country as well as from adjacent countries.
Water users' associations
The effective involvement and participation of farmers is a must for the successful implementation of any community development project. The WUAs, organized under the pilot project, could not meet the desired goals, particularly operation, maintenance and recovery of costs. Therefore, a Water Users Association Ordinance was promulgated during 1981 for the effective implementation of subsequent OFWM projects. The WUAs were assigned responsibility prior, during and post-watercourse improvement periods. These organization have played a vital role in proper cleaning and maintenance of the improved watercourses. The farmers’ participation has reduced the administrative and logistic burden at the farm level. It has promoted local leadership for better utilization of saved water through watercourse improvement.
Economic and social impact
Different impact evaluation studies have been carried out by WAPDA, Punjab Economic Research Institute, Economic Studies Cell and OFWM Training and Research Institute which indicate the benefits obtained as follows:
|
Increase in water delivery efficiency |
30% |
|
Water savings to irrigate an area (Reduction in
losses) |
24% |
|
Increase in cropped area |
7.5% |
|
Increase in cropping intensity |
14% |
|
Increase in crop yield |
14% |
|
Salinity control |
4.9% |
The issue is how to sustain water users' associations. When the watercourse is improved, the water management staff moves to the next location. The water users' associations have to be mobilized to maintain the watercourses, the land levelling, the water control structures to get optimum quantities of water at the farm level.
Demand based system
The Chashma barrage was constructed on the Indus river in 1971 as a barrage-cum-reservoir. This diversion capacity of the reservoir is 849.5 m3/sec with a storage capacity of 61.7million m3.
The Chashma right bank canal has been built to supply water to the water users on demand basis. The reservoir has created dependability on the system and can store water and increase or decrease quantities of irrigation water depending upon requirement of the crops.
The main issues in this system are how to meet the individual farmer's irrigation requirement and how a farmer can get water when it is needed.
Participatory irrigation management pilot projects
From the early 1990s, participatory approaches were introduced into the irrigation management programmes at the minor and distributory level of existing schemes or during the development of new schemes.
In some of these projects both the OFWM and WAPDA/Provincial Irrigation Departments (PIDs) are involved in implementation. This helped both the organizations to understand the limitations of the component projects and the benefits of implementing integrated projects. The experiences of the PATA project are worth mentioning, although they primarily relate to the new small-scale schemes, as this was the first project which ended-up in formulation of a scheme development process which is participatory and based on a stepwise approach. Entry and exit points for water users, OFWM and Agriculture Extension were clearly spelled out. The experiences of the PATA Project are summarized as follows:
Issues
The issues based on the experiences of some of the PIM pilot projects and irrigated agricultural development projects are:
FUTURE OPTIONS
Rationale for participatory irrigation management
Based upon a review of literature, increased farmer involvement through participatory irrigation management addresses the need to improve productivity and incomes for farmers through processes that enhance the accountability of agencies that deliver water and those that provide other inputs and services. There are many strategies that can accomplish these goals, but turning over management decision-making, if not ownership of the facilities, to the farmers is a key strategy. Another key need addressed is to reduce the financial drain on countries and donors that supporting irrigated agriculture in the traditional manner causes. Countries face impending bankruptcy with the continuing investments in rehabilitation, and the returns to government are not commensurate with the financial support. Thus, the costs of supporting irrigated agriculture must be directly born by the farmers or funds must be returned to government in proportion to the input. This conclusion further supports the concept that productivity and increased income must accompany the changes in irrigated agriculture to ensure that farmers can pay. Part of the financial implications of PIM are a reduction in costs for management of the part of the irrigation system that farmers manage. Costs are inflated by a large bureaucracy, the extra-material costs of obtaining services, and the inordinate costs associated with bureaucratic control and implementation of a program. Thus, reducing costs is an important component of PIM.
The increased accountability of system management that accompanies farmer management of the system commonly increases cropping intensity and increases yields. These improvements in performance result from increased equity of water distribution, increased adequacy of equitably distributed supplies, and especially the increased dependability of supplies. The increased dependability of water supplies, in studies around-the-world, have shown that farmers improve their seed and consequently their potential yield, increase fertilizer applications, and improve their management such as weed and insect control, and water applications. Thus, the potential yield is greater and the productivity achieved often increases by magnitudes. These magnitude increases have occurred in field demonstrations in Pakistan two decades ago.
Geijer (1995) suggest that continuing population increases (Pakistan's population increase is among the highest), land scarcity due to urban encroachment, little expansion of the irrigated area and costs to develop new land, water scarcity, limited technologies for increasing yields, and poor system performance in Asia create a serious concern about the future of food security in Asia. All of these conditions are of concern to Pakistan and many are of particular concern.
Irrigation management transfer had come to mean the expansion of the role of farmers and the private sector and the reduction of the role of government in irrigation management (FAO, 1995).
Because of approaches to irrigation management transfer in India, Pakistan and Sri Lanka, a reviseddefinition (FAO, 1995) was suggested as follows:
The replacement of government agencies with farmer organizations or other private sector entities in managing irrigation systems, either at subsystem or system wide levels.
A revised definition of Participatory Irrigation Management would then be:
The involvement of farmer organization as full partners with government agencies in managing irrigation systems.
The regional Asian expert consultation on transferring management responsibility in irrigation (FAO, 1995) identified the following reasons for irrigation management transfer:
These reasons seem especially relevant to Pakistan. There should be opportunities to reduce the costs of O&M. The opportunities for productivity increases through increased equity and dependability of the water supply are as previously discussed. Because of Pakistan's financial conditions, donor concern about expenditures in irrigated agriculture is especially high. Democratization and privatization efforts extend into several sectors in Pakistan. The sustainability of irrigated agriculture from an economic and productivity perspective is in doubt and the negative environmental impacts of irrigation continue to grow.
The above conclusions support a policy emphasis on the turnover of system management to farmers to achieve improved performance of irrigated agriculture. This management turnover effort needs policy and legislative support for farmers to appropriately take on the new roles. They must have legal status as entities with rights and responsibilities, and the turnover must include all appropriate management decision making with the consequent authority. Agencies must be reconstituted to be responsive to the new roles of farmers. Thus, agencies, especially the Irrigation Department, must take on drastically new roles. These new roles for farmers and agencies must be supported by a systematic change process that ensures definition of new roles and responsibilities, common understanding of goals and strategies, and plans for who and how they will participate in the changes needed.
Management of irrigated agriculture may tend to focus on the provision of water service and this is an important area. Equally important are the effective provision of inputs and services, and the integration through collaboration and coordination of the various agencies and the services provided to agriculture. The principle that the end users are the most knowledgeable and the most capable of achieving effective, integrated services contradicts agency perceptions of the role of farmers because of the agency's often paternalistic or directive role.
Options for existing irrigation schemes
The interactive participation is the preferred kind of participation to obtain sustainable development for the participatory management of the existing irrigation schemes. It places emphasis on joint (Government and Farmers Groups) diagnostic analysis of the existing situation, joint development of action plans and formation or strengthening of local institutions. It should stimulate the process of self-mobilization so that the farmers groups in the end are taking initiatives independently of external institutions to change systems.
A gradual process of transfer is required in order to prepare the users for participatory management of the irrigation schemes. From the start the users should be involved in this step-wise process. The phases and stages are effective guidelines for the effective implementation of the transfer process. It is expected that the time period for Phase I (built up of Farmers Organizations, transfer of O&M responsibilities) will take 3 to 5 years.
The built-up of Farmers' Organizations at the level of Watercourses (Khal Committee), Minors (Minor Canal Committee) and Distributories (Canal Committee) will create the sustainable institutions required for the participatory management of the users. Supportive legal framework is required allowing these Farmers Organizations to exist.
The process towards participatory management will involve three departments (PID, OFWM and DOA/E). For the success of the process, coordination is important. Proper project coordination can be achieved by the set-up of an Institutional Development Unit with the Executive Engineer PID, Project Director OFWM and Deputy Director DoA/E as the main actors.
The combined field team of PID-OFWM-DoA/E should be strengthened with Social Organizers of a consultants team in order to start up the social activities of the transfer process in pilot areas. PID and OFWM should also start establishing these posts within their own structures. The OFWM also streamlines the position of water management engineer and water management extensionist as per job requirement.
Staff training in technical and social matters of the process towards participatory management should become an integrated part of the (first) projects of these kind.
The proposed process leading towards participatory management (including the Collaborative Arrangements, the Initial Organization Stage, the Joint Management Agreement Stage and the Joint Implementation Stage) is an example of a participatory transfer process. It could work within the Pakistani context and should therefore be implemented very soon in different pilot areas.
Options for new irrigation schemes
The interactive participation from inception of the project is the preferred kind of participation for the sustainable development of new irrigation schemes. It places emphasis on joint (Farmers Organizations and Government Agencies) diagnostic analysis of the existing situation, joint development of action plans and formation or strengthening of local institutions. It should stimulate the process of self-mobilization so that the farmers groups in the end are taking initiatives independently of external institutions to change systems. It should also be properly monitored and evaluated.
To implement this interactive participatory concept, a participatory step-wise development process is required where the farmer community is seen as counterpart in development. The proposed process based on PATA Project experience is an example of a participatory irrigation development process. It could work within the Pakistani context and should therefore be implemented very soon in different pilot areas. Major characteristics of this step-wise process are: a) involvement in all the decision making processes; b) group building; and c) training of the farmers organizations. Projects must be planned from the outset, participatory, with the development process in mind and the project preparation document (PC1) must be prepared accordingly.
Continued appraisal, of objectives and targets during the project life is important. Physical targets may be required but must be realistic given that programmes will be increasingly farmers driven. Donors and Government would have to be more realistic and flexible on such targets especially for the first year. Alternative targets to physical output need to be incorporated; balancing of social and physical targets is required.
Sharing of responsibilities will be important from the start of the project (even in its conceptual phase). Farmers organizations should be allowed to indicate themselves what role they want to play but cost sharing will be an integrated part of it. Government and donor guidelines may need to be adapted to allow farmers to be involved in the whole project cycle including procurement and construction activities.
Existing departments such as the Provincial Irrigation Department (PIDs), On-Farm Water Management (OFWM) and Directorate of Agriculture Extension (DoA/E), will gradually change their role in the development process. They will be assigned to facilitate, to provide knowledge and to assists the communities. The focus will be on institution building by setting up farmers' organizations, village organizations or interest groups as counterpart in development.
For participation and social organization to become a more important component, social organizers will also need to become an integral component of the field teams in addition to the Water Management Engineer and Water Management Extensionist. At present, the role of engineers and extension specialists are not clearly defined. Training and re-orientation of departmental staff of PID, OFWM and DoA/E (management level and field teams) in the participatory approach would have to be included in new projects. This training should enhance a positive attitude towards participation.
The option of a joint Field Team from various line agencies such as PID and OFWM is at the moment more appropriate considering the nature of the participatory irrigation projects and the existing organizational structure of both the PID and the OFWM. Such joint field team should have a clear line of command, clear mandate and be developed for each project according to the specific requirements.
REFERENCES
FAO. 1995. Irrigation Management Transfer in Asia. RAP Publication 1995:31. FAO, Bangkok.
Rodolfo Undan
Administrator, National Irrigation Administration
(NIA), Philippines
PART I: NATIONAL POLICIES REGARDING MODERNIZATION OF IRRIGATION SCHEMES
WATER RESOURCES AND WATER DEMANDS
In the Philippines mean annual rainfall is about 2 360 mm. Rainfall varies widely from less than 1 000 mm to more than 4 000 mm. The rainfall pattern is more or less seasonal with wet and dry seasons.
The land area of 297 000 km2 is drained by 421 rivers and a large number of small streams flowing directly to the sea. There are ten major river systems with drainage basin areas greater than 3 000 km2. The aggregate area of these basins is only about 28% of the total land area of the country.
The mean monthly discharges of some major rivers are given in Table 1. Low flows occur during the month of March to May. Mean monthly discharge varies from 9 million m3 to 3 127 million m3. The estimated annual runoff by water resource region is given in Table 2. The total estimated flows at 50% and 90% probability are 479 and 257 thousand million m3, respectively. The monthly flow patterns indicate extreme variability of flow in any month from year to year. These have considerable implications in the design and cost of irrigation projects. High capacity flows necessitate putting up large capacity diversion works while low flows in the dry season cause inability of the irrigation systems to irrigate its command areas. High flows cause erosion in the catchment areas resulting in siltation problems in the headworks, canals, and irrigated service areas. These in turn require higher operation and maintenance costs.
The Philippines’ major groundwater reservoirs total about 50 000 km3. The aquifer thickness and water bearing characteristics vary considerably. The safe yield is estimated to be 22 km3/year.
The irrigation sector remains the major consumer of surface water although water demands for domestic, industrial uses and power generation have increased in the recent years. The evident competing demand for water between sectors and the continuing decline in water yields due to poor management of the watersheds require a more efficient use of water especially by the agricultural sector. There is a need for improved conveyance and on-farm water management practices, use of more efficient irrigation methods, and re-use of drainage water. Increased yield in fully irrigated paddy fields must be attained so that other areas can be cultivated with diversified high value crops requiring less water.
TABLE 1
Mean monthly discharges for selected catchments
|
Water Resource Region/Basin
|
Basin Area km2
|
Jan |
Feb |
Mar |
Apr |
May |
Jun |
Jul |
Aug |
Sep |
Oct |
Nov |
Dec |
|
(million cubic metres) |
|||||||||||||
|
I. Ilocos |
|
|
|
|
|
|
|
|
|
|
|
|
|
|
Abra River |
4,183 |
464 |
275 |
258 |
244 |
432 |
1,045 |
2,030 |
2,242 |
2,114 |
1,676 |
850 |
610 |
|
II. Cagayan Valley |
|
|
|
|
|
|
|
|
|
|
|
|
|
|
Upper Cagayan R. |
6,266 |
566 |
385 |
420 |
332 |
530 |
546 |
729 |
829 |
958 |
1,615 |
2,300 |
1,426 |
|
Chico R. Subbasin |
3,349 |
318 |
266 |
221 |
181 |
233 |
433 |
756 |
881 |
1,029 |
983 |
973 |
666 |
|
Abulog R. Subbasin |
1,432 |
657 |
391 |
295 |
185 |
160 |
311 |
514 |
641 |
628 |
983 |
1,515 |
1,068 |
|
III. Central Luzon |
|
|
|
|
|
|
|
|
|
|
|
|
|
|
Upper Pamapanga |
845 |
30 |
14 |
11 |
9 |
24 |
80 |
187 |
335 |
305 |
213 |
116 |
64 |
|
IV. Southern Tagalog |
|
|
|
|
|
|
|
|
|
|
|
|
|
|
Pansipit R. |
644 |
39 |
26 |
24 |
20 |
19 |
23 |
33 |
43 |
56 |
61 |
52 |
47 |
|
V. Bicol |
|
|
|
|
|
|
|
|
|
|
|
|
|
|
Bicol River |
905 |
93 |
50 |
38 |
30 |
35 |
57 |
114 |
143 |
134 |
178 |
143 |
126 |
|
VI. Western Visayas |
|
|
|
|
|
|
|
|
|
|
|
|
|
|
Jalaur R., Panay |
1,499 |
135 |
84 |
34 |
71 |
105 |
157 |
273 |
205 |
196 |
384 |
297 |
193 |
|
Ilog R., Negros |
1,453 |
86 |
53 |
49 |
52 |
106 |
209 |
377 |
368 |
310 |
382 |
239 |
137 |
|
VII. Central Visayas |
|
|
|
|
|
|
|
|
|
|
|
|
|
|
Loboc R., Bohol |
618 |
58 |
41 |
36 |
29 |
36 |
46 |
67 |
53 |
48 |
69 |
65 |
55 |
|
VIII. Eastern Visayas |
|
|
|
|
|
|
|
|
|
|
|
|
|
|
Catarman R., San |
472 |
175 |
56 |
49 |
29 |
42 |
55 |
51 |
51 |
38 |
93 |
180 |
192 |
|
IX. SW. Mindanao |
|
|
|
|
|
|
|
|
|
|
|
|
|
|
Labangan R. |
430 |
40 |
30 |
26 |
35 |
82 |
103 |
135 |
162 |
159 |
136 |
121 |
89 |
|
X. Northern Mindanao |
|
|
|
|
|
|
|
|
|
|
|
|
|
|
Agusan R. |
7,390 |
2,734 |
3,127 |
2,087 |
1,163 |
1,063 |
1,107 |
1,070 |
1,067 |
1,075 |
1,145 |
1,037 |
2,235 |
|
XI. SE. Mindanao |
|
|
|
|
|
|
|
|
|
|
|
|
|
|
Tagum R. |
2,326 |
443 |
305 |
231 |
178 |
327 |
421 |
346 |
282 |
348 |
320 |
256 |
321 |
|
XII. Southern Mindanao |
|
|
|
|
|
|
|
|
|
|
|
|
|
|
Cotabato R. |
17,744 |
1,308 |
1,309 |
1,113 |
957 |
1,229 |
1,712 |
2,205 |
2,147 |
2,104 |
2,250 |
1,720 |
2,174 |
Source: NWRC Basin Studies, 1978-83.
TABLE 2
Estimated annual runoff by water resource
region
|
Water Resource Region |
Area (km2) |
Annual Runoff |
|||
|
60% probability |
90% probability |
||||
|
(thousand million m3) |
(mm depth) |
(thousand million m3) |
(mm depth) |
||
|
I. Ilocos |
14,400 |
27 |
1,875 |
12.1 |
840 |
|
II. Cagayan Valley |
34,500 |
65.5 |
1,900 |
39.3 |
1,140 |
|
III. Central Luzon |
23,600 |
32.5 |
1,380 |
14.9 |
630 |
|
IV. Tagalog |
46,500 |
91.5 |
1,970 |
39.9 |
860 |
|
V. Biool |
17,600 |
29.1 |
1,650 |
14.7 |
835 |
|
VI. Visayas |
20,200 |
17 |
840 |
11.6 |
575 |
|
VII. Central Visayas |
14,900 |
16.6 |
1,115 |
8.7 |
585 |
|
VIII. Visayas |
20,400 |
59 |
2,890 |
33.9 |
1,660 |
|
IX. SW. Mindanao |
20,600 |
27 |
1,310 |
17.1 |
830 |
|
X. Mindanao |
24,300 |
37.9 |
1,560 |
24 |
990 |
|
XI. SE. Mindanao |
24,900 |
39 |
1,565 |
18.7 |
750 |
|
XII. Mindanao |
31,900 |
37.2 |
1,165 |
22 |
690 |
|
Total |
293,800 |
479.3 |
|
256.9 |
|
|
Average |
|
|
1,630 |
|
875 |
|
Region/ Province
|
Estimated potential irrigable areaa
|
Service area |
Irrig. devel. |
|||||||
|
National |
Communal |
Private |
Total |
|
||||||
|
No. |
Area |
No.b |
Area |
No. |
Area |
No. |
Area |
% |
||
|
Car |
99,650 |
1 |
11,444 |
682 |
16,361 |
1,551 |
28,655 |
2,134 |
66,460 |
56.66 |
|
1 |
277,180 |
21 |
42,498 |
763 |
79,512 |
820 |
31,663 |
1,604 |
153,673 |
55.44 |
|
2 |
472,640 |
19 |
143,060 |
220 |
30,000 |
344 |
23,095 |
583 |
196,155 |
41.5 |
|
3 |
482,230 |
16 |
172,889 |
371 |
58,242 |
129 |
16,296 |
516 |
247,427 |
51.31 |
|
4 |
263,590 |
32 |
52,228 |
445 |
43,871 |
350 |
23,782 |
827 |
119,881 |
45.48 |
|
5 |
239,660 |
14 |
23,412 |
632 |
54,441 |
269 |
19,329 |
915 |
97,182 |
40.55 |
|
6 |
197,250 |
13 |
52,235 |
194 |
19,147 |
139 |
5,499 |
346 |
76,881 |
38.98 |
|
7 |
50,740 |
0 |
0 |
227 |
16,457 |
121 |
2,599 |
348 |
19,056 |
37.56 |
|
8 |
84,380 |
16 |
15,842 |
301 |
28,215 |
93 |
4,921 |
410 |
48,978 |
58.04 |
|
9 |
76,500 |
4 |
14,282 |
146 |
15,213 |
29 |
1,852 |
179 |
31,347 |
40.98 |
|
10 |
230,150 |
9 |
29,640 |
289 |
28,229 |
60 |
2,657 |
358 |
60,426 |
26.26 |
|
11 |
290,280 |
17 |
46,983 |
170 |
28,531 |
55 |
10,531 |
242 |
86,045 |
29.64 |
|
12 |
362,090 |
9 |
47,399 |
180 |
32,570 |
38 |
3,731 |
227 |
83,700 |
23.12 |
|
Total |
3,126,340 |
171 |
651,812 |
4,520 |
450,789 |
3,998 |
174,610 |
8,689 |
1,277,211 |
40.86 |
IRRIGATION SUBSECTOR CONTEXT
Out of the Philippines’ total land area, some 9.5 million ha are arable and 3.13 million ha are potentially irrigable. As of 1995, the total land area served by irrigation facilities is 1.277 milion. ha., or 41% of the irrigable area (Table 3). This figure was higher than the figure three years ago but a recent tally showed that irrigated areas are reduced due to land conversion from agricultural to residential/commercial/industrial uses. Of the irrigated areas, 51% are served by 171 national irrigation systems (NIS), 35% by 4 520 communal irrigation systems (CIS), and 14% by 3 995 private irrigation systems (PIS).
There is a need for putting up more irrigation systems to accelerate generation of new irrigated areas. It is noted that although only 41% of the potentially irrigable areas are irrigated, the irrigated areas contribute between 60 to 70% of the total harvested paddy of the country. Any calamity that could arise in the irrigated areas therefore could significantly reduce the harvested paddy and affect the domestic needs. Bringing the level of irrigation development to 60% will more or less ensure rice self-sufficiency for the country.
GOVERNMENT POLICIES FOR MODERNIZATION PROGRAMMES
In the last 25 years, Philippines’ agriculture has experienced a very slow growth rate compared to other Asian countries. Its sluggish performance has been attributed to such factors as: inadequate public investment, low level of technology development, limited infrastructures, and occurrence of natural calamities.
To enable the Philippines’ agriculture to meet the demands of globalization and increasing need for food security, the tenth congress adopted in December 1995 a Joint Resolution No. 1, creating a Congressional Commission on Agricultural Modernization (AGRICOM) to review and assess the state of the Philippines’ agriculture as well as its agricultural policies, strategies and programs. The Standing Committee on Public Investment in Infrastructure has a major function of ensuring that the basic hard physical infrastructure (transportation, irrigation, power and telecommunications) as well as the soft infrastructure systems (market, storage, drying facilities and processing plants) are in place to support modern agriculture. Specifically, the Committee has the following tasks:
In terms of irrigation infrastructure, due to limited investment in the last decade, priority has to be given to (1) rehabilitation of existing systems to prevent its further deterioration and (2) putting up new systems to generate additional irrigated areas instead of investing on modernization schemes. The capital expenditure level on irrigation ranged from Pesos 1 135 million in 1986 to Pesos 2 797 million in 1995.
The limitation in budget allotted to irrigation development in the last decade caused the decline in new irrigation areas generated from an average of 25 000 ha per annum in the 1980s to less than 10 000 ha in recent years. There is a current attempt to reverse the situation. An annual target of around 25 000 ha of new irrigated areas generated is considered realistic and affordable. It is estimated that an annual budget of no less than Pesos 6 thousand million sustained in the next five years could respond to the current effort of making up with the lost ground. The infusion of modernization of irrigation schemes would then require an additional amount on top of the Pesos 6 thousand million estimate.
So far, there is no known formal modernization plan developed by the National Irrigation Administration (NIA) for its irrigation systems. It is only in the recent years that proposals for systems modernization are starting to come in.
Modernization may be done in phases in order not to put too much burden on the budget requirement for irrigation development. In the past, modernization attempt had only been incidental or combined with rehabilitation works. These are in the form of canal linings, manual to mechanized opening of check gates, combined use of surface and subsurface irrigation water, providing post production facilities and infrastructure as part of the irrigation facility upgrading, application of the Teruvian-type intake to prevent siltation of irrigation canals, use of buried pipes and pressurized irrigation systems.
The concept modernization recently proposed by the NIA would cover the following aspects:
It is estimated that modernization effected in at least 50% of the existing national systems in the next 10 years would be a reasonable target.
AGRICULTURAL SUPPORT SERVICE
In the Philippines, it is highly recognized that improved productivity with irrigation development cannot be fully attained without the complement of agricultural support services such as research and extension, extension of credit facilities, marketing information and services, farm-to-market roads, post harvest facilities, and strengthening of cooperatives and other rural organizations. These services will continue to be provided when modernization of the irrigation systems is carried out.
FARMERS’ PARTICIPATION
The normal conduct of these services are done through the Irrigators Associations (IAs) which are organized as part of the irrigation development effort. As of 1995, the NIA had already organized some 4 500 IAs comprising 645 000 members. The IA members were trained in the participatory approach and were involved in the decision making as well as in the activities during the irrigation project planning and construction as well as in operation and management of the systems.
IMPACT OF MODERNIZATION PROGRAMMES
Considering that irrigation modernization efforts in the public sector are still limited, the impact of modernization at present is only commensurate to the level of modernization in the existing systems.
FUTURE TRENDS
The current estimated population of close to 70 million is expected to grow at the current rate of a little more than 2%, hence, there will be increased pressure to meet food needs and on production resources, especially water. Agricultural production has to double and has to intensify. There will be a continuing demand for diversified cropping and new arable land with rolling terrains will be opened up for non-rice and fruit tree cultivation. Irrigation development even using the conventional gravity irrigation system is getting costly and will continue to be expensive considering that water sources have to be found further away from the prospective service areas. Watershed denudation is manifesting the decrease in water yields both in quantity and quality.
This can be solved largely by infusing modern technologies in the development as well as in the operation and maintenance of the systems. Modernization of irrigation schemes has to be applied to keep up with future demands in agriculture.
INTERNATIONAL SUPPORT
The infusion of modernization in irrigation schemes in the Philippines can be enhanced with international support in the form of technical assistance in the preparation of a comprehensive modernization plan, on human resource development like providing short term on-the-job training and observation courses, applied research as well as in installing modern management information systems. Consequently, financial assistance, preferably in the form of grants and very low interest loans, will be needed from international organizations.
PART II: CASE STUDY: TERUVIAN TYPE INTAKE IN SMALL SCALE OR COMMUNAL IRRIGATION PROJECT
FEATURES
The hydraulic principles of operation of the Teruvian intakes are similar to those used in urban drainage designs for grill-covered storm drains. In the Philippine design, a rectangular grill fabricated from steel bars with spacings of 25 mm is placed securely across the river (see Figures 1 and 2). The steel grill acts as a trash rack. Before water enters the main irrigation canal, it passes through a gated silt ejector which can be operated periodically to sluice off sediments.
FIGURE 1. Schematic drawing of a Teruvian intake structure
FIGURE 2. Teruvian intake of Hibob-Hibob irrigation scheme
A Teruvian structure should have a concrete wearing surface at river bed level, a concrete barrel covered with a trash rack grill and connected to the main canal, a silt ejector and a spillway. The design is location-specific, and further modifications and improvements are being done as necessary.
The details of the design of the Teruvian type intakes are shown in Figures 1 and 2.
ADVANTAGES
PERFORMANCE
There are about 17 units of Teruvian intakes constructed by NIA from 1980’s to present. It originated in Bohol and Southern Leyte and was later replicated in Central and Northern Luzon, and in Mindanao.
Based on the initial observations and the encouraging results in the use of this type of intake structure especially in the prevention of silt entry in the irrigation canals, the NIA feels that this system will be adopted nationwide especially for small-scale irrigation systems with problems in sediment deposition and with an adequate grade in the site of the headwork to allow silt ejection.
Ranjith Ratnayake
Director, Water Resources Development,
Ministry of Irrigation, Power & Energy, Colombo, Sri
Lanka
PART I: NATIONAL POLICIES ON MODERNIZATION OF IRRIGATION
WATER RESOURCES AND DEMAND
Sri Lanka, situated between 6o and 10o North of the equator, has a land area of about 6.5 million ha and a population of 18.0 million with over 70% living outside urban centres and earning their livelihood from agriculture. Agriculture constitutes about 25% of the national product.
Annual rainfall ranges between 900 mm and 6 000 mm with an average of about 2 000 mm. Total average volume of rainfall is estimated at about 132.000 million m3 with streamflow from the 103 river basins estimated at about 47.000 million m3. Surface runoff is therefore about one-third of the total rainfall and actual runoff to the sea is reduced by about a further third due to diversion for irrigation. Annual evapotranspiration ranges between 1 000 mm/yr (wet zone) to 2 100 mm/yr (dry zone). Groundwater recharge is estimated to be between 10% and 30% of rainfall or 200/600 mm/yr. Several aquifers in a limestone belt in the north and west have fair amounts of groundwater resources with sustainable pumping rates of up to 35 l/s. Of the 50 km3 of surface water available, a considerable amount is utilized for hydropower generation which meets 13% of energy requirements and about 85% of electricity demand. This results in the base load coming through hydropower and being drought sensitive and sometimes in conflict with irrigation demands.
Most river basins including the largest, (Mahaweli - drainage area 10 500 km2) with irrigation potential, have been developed. A few in the wet zone have potential for hydropower as well as for transbasin diversion to supplement irrigation in the drier basins, as well as to mitigate floods and to provide water for industrial uses.
A study of irrigation demand in 1977 forecasts water deficits for the year 2000 at 200 million m3 in the Mahaweli area, 920 million m3 in the SE dry zone and 1 400 million m3 in the NW dry zone; only the western wetzone was projected to have a surplus of water. Domestic water consumption levels are moderate at around 130 litres/cap/day along with 50% greater demand in urban piped supply areas in relation to rural areas. It is likely that industry, domestic and tourism demands will increase in the future with emphasis on an open economy and a threshold limit to irrigation expansion almost being reached.
IRRIGATION SUB SECTOR CONTEXT
In Sri Lanka investments in irrigation progressively increased and during the period 1984-93 the share of irrigation in the total resources allocated to the agriculture sector rose to over 66%.
More than 85% of the irrigation systems developed are based on reservoir storage with some of the larger or multipurpose systems reinforced by supplies from river diversions to storage reservoirs. The storage systems are consistent with the bimodal rainfall patterns prevailing and are able to sustain a regularity of supply during the drier periods. In general, earth dams across water sources create reservoirs of sizes varying from less than 0.005 million m3 to over 620 million m3. Rockfill and concrete dams impounding larger storages have featured in the development of large irrigation/hydropower reservoirs supplemented in some instances by transbasin diversions.
Irrigation Systems are essentially of three types, small, medium and large with the latter two normally being grouped together for management. The large systems include the multipurpose projects interlinked in some cases through transbasin canals or a cascade arrangement. Most small systems within a single watershed also form part of a cascade to optimize runoff in a given catchment. Table 1 gives the area covered with different irrigation works.
In some cases division boxes allocate water within the distributory system, but in most cases gated distributory canals control water for irrigation. Field canal outlets may have division boxes too while individual pipe outlets for continuous flow (3” outlets) or for rotational distribution (6” outlets). Turnouts of 0.5 m3/s are also utilized in most tertiary networks.
There has been a tendency to adhere to paddy cultivation (mono crop) while in the more enterprising cases where greater investment capacity is available a movement to subsidiary food crops is observed. Vulnerability of smallholders to the vagaries and manipulations of market forces and lack of price support mechanisms or assured markets has limited diversification to crops that may bring greater financial benefits.
POLICY ON MODERNIZATION
While rehabilitation/improvements per se have been carried out as part of regular programmes the concept of modernization and an attempt to restructure the systems to suit new demands was for the first time addressed in the first foreign funded (IDA) programme called the Tank Improvement and Modernization Project (TIMP) implemented during 1976-82. It covered five major systems in the North Central Province with a command of 12 750 ha.
Modernization of systems as part of system improvement have been pursued actively from the mid 1970's to date covering main, medium and minor systems. Table 2 shows the major programmes that have been undertaken after 1975 with foreign aid as the main source of funding. Institutional reforms including participatory approaches have concurrently been developed based on experiences gathered within and outside the country. Donor priorities and policies have to a greater or lesser extent been reflected in the rehabilitation projects. From an entirely hardware approach there have been projects where up to 50% of the investments have focused on institutional aspects (software) with varied results.
TABLE 1
Classification of Irrigation Works
|
Type |
Size |
No. of Systems |
Extent (Ha) |
Features |
|
Minor |
Village Irrigation Works <80ha |
8,000 working tanks |
200 000 |
irrigated by a single canal and plot to plot; maintained by
farmers; predominantly private land; designed mainly for 1 season (Maha)
cultivation; crop invariably rice - for subsistence. |
|
Medium |
80-400 ha |
282 |
61 000 |
managed and maintained by Irrigation Dept.; a mix of private
and State Land with permit; designed for Maha and partly Yala
cultivation. |
|
Major |
400 and above |
106 |
208 000 |
a complete distribution system with branch distributory and
field channels; predominantly State Land with permit plus a limited extent of
private land; fairly uniform holdings designed for a Maha and a substantial Yala
cultivation; rice plus other crops; non-farm activities important. |
|
Major |
(River Basin) |
9 |
101 000 |
similar to above, but most management decisions and
allocations decided from a central point |
|
Subtotal |
568 000 |
|
||
|
Flood protection, salt water exclusions, drainage
works |
43 |
33 000 |
support irrigated agriculture/rice cult. |
|
|
Total |
601 000 |
|
||
However, the returns on investment have not been commensurate with expectations and the assured productivity has not been realized to the projected extent. Implementation snags have resulted from competing projects in the face of reduced capacity to implement during the project periods with the result that costs in terms of consultancies etc. have gone up in relation to actual physical outputs.
TABLE 2
Recent rehabilitation projects
|
Project |
Extent |
Amount US$M |
Donor |
Period |
Hardware/Software |
Implementing Agency |
|
Tank Irrigation & Modernization Project (TIMP) |
12 750 ha (5 major systems) |
30.0 |
IDA |
1976-82 |
100%/- |
Irrigation Dept. |
|
Gal Oya Water Mgt. Project (GOWMP) |
23 000 ha (1 major system) |
18.3 |
USAID |
1979-85 |
90/10 |
Irrigation Dept. |
|
Major Irrigation Rehab. Project (MIRP) |
24 000 ha (Original 7 major systems reduced to 4 during
implementation) |
43.2 |
IDA/CIDA/SDC |
1985-92 |
95/5 |
Irrigation Mgt. Division of Ministry |
|
Uda Walawe Rehab. Project (UWRP) |
17 000 ha (1 major scheme) |
22.1 |
ADB |
1985-90 |
99/1 |
Mahaweli Authority |
|
Irrigation Systems Mgt. Project (ISMP) |
76 000 ha (6 major systems in Gal Oya) |
28.3 |
USAID |
1986/96 |
60/40 |
Irrigation Mgt. Division of Ministry |
|
Village Irrigation Rehab. Project (VIRP) |
1 700 minor systems 45 000 ha |
43.6 |
IDA |
1981-90 |
95/5 |
Irrigation Dept. Agrarian Services Dept. |
|
National Irrigation Rehab. Project (NIRP) |
35 (major/medium) covering 13 000 ha. 800 minor 25 000
ha |
40.0 GOSL 5.5 |
IDA/EC |
1992-97 |
80/20 |
Irrigation Dept. Agrarian Services Dept. Provincial
Councils |
The introduction of the coordination mechanism (a Project Manager working through the Project Management Committee for major systems now given legal recognition as the forum where line agency staff at system level and farmer representatives discuss plan and implement the agricultural programme) has been quite effective. Seed of good quality (registered/certified) is secured from the Department of Agriculture or authorized/certified suppliers. Fertilizer and agro-chemicals are available at outlets run by both the state and the private sector. Research on new varieties and crops by the research arm is propagated through the extension services. In some instances the private sector provides seed and know-how especially where buyback arrangements are in place.
PARTICIPATORY MANAGEMENT
The processes in developing farmer organizations are based on a tiered representative system approach with informal user groups (approx. 25 ha - 25 farmers) organized on the basis of Field Canals (FCO) - tertiary system - whose representative comes into the Distributory Canal (DCO) - (Secondary System) - grouping, which is the formal organization registered under the provisions of the law and whose representative in turn sits on the apex level Farmer Organization at the System level (SLFO) and also in the Project Management Committee, comprised of line agency staff and farmer representatives (farmers in majority) which is the planning and management forum for implementing the seasonal agriculture programme.
IMPACT OF MODERNIZATION
Pure technological advances in system rehabilitation have not resulted ub acguevubg tge envisaged increase in productivity unless they have been coupled with institutional development programmes that provided for beneficiary involvement in all stages of the project. However, greater system operational flexibility, response time, irrigation to match crop water requirements, less head-tail tensions are beneficial outcomes as have been the introduction of regulating/measuring structures to determine efficiency/equity in water supply. The original mono crop (paddy) designed systems have been easily adapted to meet irrigation requirements of other crops and improvements to drainage has also become necessary. Beneficiary contribution to rehabilitation (10% of civil work costs) has necessarily required their active involvement, though contributions have been mostly through direct labour or earth work on canals.
FUTURE TRENDS
Rehabilitation of systems would eventually be demand driven with contributions by beneficiaries and the state, and some cost recovery mechanisms in place. The trend to have an “after care” programme at the end of the project to keep the momentum and help sustain the project for some time after rehabilitation is also a recent feature.
PART II: CASE STUDY TANK IRRIGATION MODERNIZATION PROJECT (TIMP)
INTRODUCTION
The Tank Irrigation Modernization Project (TIMP) funded by the World Bank was the first large-scale irrigation rehabilitation undertaken in Sri Lanka. The Project covered a total area of about 12,735 ha of irrigable land in five major irrigation schemes located in the North Central Dry Zone. The project was implemented during 1976-82.
PROJECT SELECTION
The choice of these schemes has been influenced largely by issues such as poverty and regional equity with better income distribution.
MAJOR PROJECT OBJECTIVES
The basic goal of TIMP was to increase agricultural production in the irrigable lands in the project area through increased land-use intensity and the adoption of a package of irrigation and agricultural innovations. The project was aimed at conserving irrigation water stored in the reservoirs and maximizing the use of maha (main wet season) rainfall, thereby increasing the agricultural potential. Along with this increase in cultivated land, large increases in crop yields were also anticipated. Rice yields during the maha season were expected to double, from 1.7 tons per ha to 3.4 tons per ha. The area under non-rice crops, mainly pulses, was projected to increase sevenfold in a five-year period. The goals of TIMP were based on radical transformation of the agricultural patterns in the area through which significant increases in farm incomes were anticipated. Net farm income was expected to rise from the existing level of Rs. 2 850 to a post-project level of Rs. 7 650.
MAJOR PROBLEMS AND IMPROVEMENT STRATEGIES ADOPTED
The main problems identified in the project were:
1. Inefficient use of maha (main season) rainfall and wasteful use of irrigation water by farmers.The basic strategy underlying the TIMP development plan involved two major components:
2. Poor agricultural extension facilities.
3. Unsatisfactory farm roads, causing problems in marketing.
1. The development of agricultural production in the area.The agricultural component recommended a package of practices to be followed by the farmers. This included:
2. The improvement of the irrigation water use and management.
1. Preparation of rice lands under dry soil conditions (dry tillage) without waiting for the maha rains.These recommendations, therefore, constituted a package requiring a high level of tractor use, timely availability of water supplies, better water control and the availability of short-duration rice varieties.2. Advancing the sowing time of rice to benefit from initial maha season rains that would otherwise be unutilized.
3. Dry sowing of ungerminated seed paddy as a substitute for the conventional system of sowing germinated seed paddy under wet conditions (to reduce high levels of water use in land preparation under wet conditions).
4. Cultivation of short-duration (3 to 3 1/2 month rice varieties during the maha season to reduce the irrigation period.
The irrigation improvement strategy of TIMP, on the other hand, involved the adoption of several innovations that basically require major structural changes in the water conveyance system to allow better water control and delivery. Such changes were aimed at introducing a rotational (intermittent) system of irrigation water distribution at the farm (tertiary-canal level). In order to introduce the system of rotations, the channel system was redesigned and new controls and measurement devices were installed along the channels.
The major irrigation-related innovations in TIMP were:
1. Introduction of rectangular channels of one cusec (28.3 litres per second) capacity.These changes necessitated a great deal of construction work, and provided a heavy engineering orientation to TIMP.
2. Construction of a lined channel system to reduce seepage losses.
3. Installation of larger (15 cm) farm pipe outlets.
4. Construction of control and measuring structures.
5. Implementation of strict 12 hour rotational system of water supply.
PROJECT COSTS AND COMPONENTS
The project was funded by the World Bank. The total estimated cost was about US$30.0 million including about US$7.0 million in import taxes and duties (1976 prices).
The cost data (Table 3) show that civil works and equipment and machinery imports accounted for nearly 85 percent of TIMP's total project expenditure. The irrigation improvement component, in particular, was highly capital-intensive and accounted for 29 percent of the total cost.
TABLE 3
Major cost components of TIMP (in 1976
currency)
|
Item
|
|
Cost |
|
(US$M) |
(%) |
|
|
Civil Works |
8.7 |
29.0 |
|
Construction equipment and vehicles |
5.6 |
18.7 |
|
Agricultural equipment and vehicles |
5.6 |
18.7 |
|
Technical assistance |
0.3 |
1.0 |
|
Engineering and administration |
1.3 |
4.2 |
|
Contingencies |
1.7 |
5.7 |
|
Price contingencies |
6.8 |
22.7 |
|
Total |
30.0 |
100.0 |
In order to implement the rehabilitation program, a three-tiered organizational structure was outlined in the project proposal. At the highest level, there was a Central Coordination Committee in the Ministry.
At the middle level, the project activities were handled by the District Coordination Committee, chaired by the Chief Project Engineer (CPE). The CPE was responsible for the coordination of routine activities. At the lowest level, the project work was expected to be supervised by the Tank Committee, chaired by the Project Engineer. It was expected that this committee would include both government officials engaged in agricultural activities in the scheme and elected members of farmers. Of the three levels of the organization, the least effective was that at the tank level (the Tank Committee).
PROJECT ACHIEVEMENTS
Post-evaluation studies indicate that, for many reasons, farmers did not accept the improvement package and were reluctant to change their traditional cultivation practices. In fact, practices such as dry sowing and early sowing were completely rejected by farmers. As regards rice, they continued to show their traditional preference to ensure one good maha season rice crop using long-duration (4-4 1/2 months) varieties, planted rather late in the season when the tank was full. Despite the formation of many committees, the project administration also showed major weaknesses. As a result, virtually all activities and responsibilities of undertaking the project work were in the hands of the project engineers in the respective schemes. This led to a perception of the project as an engineering activity with a strong construction orientation. This perception led to the neglect of other complementary aspects of the problem (such as the multidisciplinary aspect) and beneficiary participation.
CONCLUSIONS/LESSONS
Although the specific lessons emerging from TIMP do not provide very positive results, the experiences have contributed significantly to a deeper understanding of the implementation and operation of rehabilitation projects in Sri Lanka. The project clearly demonstrated that a construction activity alone, devoid of a management orientation, would not be a success. Similarly, TIMP also demonstrated that the technical feasibility of a development strategy alone is insufficient to guarantee success. This lesson, therefore, highlights the need for economic feasibility of the operational plans viewed from the farmers' perspective.
REFERENCES
Comprehensive Water Resources Management in Sri Lanka - (ADB
1994).
Irrigation Investment Trends in Sri Lanka -
Kukuchi/Aluvihare.
Rehabilitation of Irrigation Systems in Sri Lanka -
Abeysekera.
Feasibility of Rehabilitation of Irrigation/Drainage Systems
in Southern Sri Lanka-JICA Study.
Siripong Hungspreug
Director, Project Planning Division, Royal Irrigation
Department, Bangkok, Thailand
INTRODUCTION
Thailand is a country with 512 000 km2 of area and with a population of 60 million. The climate of the country is tropical and monsoonal, characterized by a markedly seasonal distribution of rainfall. The northern, central and northeast regions are subject to the southwest monsoon starting in late April to June providing an average annual rainfall ranging from 1 000 mm in the lowlands on the leeward side to 1 500 mm on the windward side. About 85% of this rainfall occurs between mid-May to October. The southern region is subject to both the southwest and the northeast monsoons which results in an average annual rainfall ranging from 1 800 to 3 500 mm. Such a total amount of rainfall during the major rice growing period is sufficient to meet the requirements during a normal year but shortages occur during years of subnormal or irregular rainfall. Also during the five to six months dry season, it is impossible to grow a second crop without irrigation.
Regarding hydrology, the Thai National Committee on the International Hydrological Programme classified all watersheds in the country into 25 river basins (Figure 1) and in 1993 the National Water Resources Council assessed the average annual natural flow to be 198 791 million m3 and later revised in 1994 by the National Economic and Social Development Board to be 211 465 million m3. The average drainage coefficient of the country is 29.22%.
The unpredictability of rainfall in 1990 and 1991 left the two major reservoirs of the country (Bhumibhol and Sirikit dams) with 7 706 and 4 361 million m3 usable volume of water to supply about 1 million ha of paddy rice cultivation areas in the central plain and for domestic consumption of 10 million people of Bangkok inhabitants and its vicinity. Various measures for prioritizing the water allocation were proposed to be for domestic use, agriculture, salinity prevention, etc. At almost the end of the dry season of 1991, Thailand was just lucky enough to receive some rainfall that saved Bangkok from chaos since there was only water left for 1 month consumption.
In 1992, the Royal Forestry Department received the endorsement from the cabinet to declare 140 800 km2 of area (28% of the country) as conservation forest. This, together with the pressure from growing demands from the increasing number of population, the demand for various activities as a result of economic boom as well as from the concern over the environmental resources, sparked the Government to prepare a national master plan for water resources in 1993-1994.
FIGURE 1. Boundaries and areal distribution of 25 main river basins of Thailand
NATIONAL WATER BUDGET ANALYSIS
In order to respond to the water shortage crisis in 1991-1992, the National Water Resources Council (NWRC) together with the Office of the Economic and Social Development Board (NESDB), the Royal Irrigation Department (RID) and concerned agencies started in 1993 to undertake a study on the potential development of water resources in the 25 basins in Thailand. The study was aimed to investigate the total and unexploited water resources potential against the expected water demands for short-term development (target year 1996) and long-term development (target year 2006). The availability and the demand situations for both scenarios were assessed in order to propose future water resources development. The study emphasized meteo-hydrology, water resources and water use schemes. HEC-3 computer software was used to simulate the project configuration by dividing the 25 basins into 242 sub-basins. The simulation model was driven by monthly flow data and rainfall (for crop demand calculation). The minimum flow in the major river in each river basin was maintained and input as a constraint in the model. The study showed that in 1993 the demands for agriculture, domestic use and for industry and tourism were 92.11%, 5.97% and 1.92%, respectively. In 2006, it was predicted that the demands for the corresponding sectors would be 88.15%, 9.43% and 2.43%, respectively (Table 1).
TABLE 1
Demands for water use
|
Sectors
|
Demands |
|||
|
1993 |
2006 |
|||
|
MCM |
% |
MCM |
% |
|
|
1. Agriculture |
48,111 |
92.11 |
61,685 |
88.15 |
|
2. Domestic |
3,118 |
5.97 |
6,593 |
9.42 |
|
3. Industrial & Tourism |
1,001 |
1.92 |
1,701 |
2.43 |
Such the study enables the NWRC and related agencies to compile useful statistical data related to water resources development and provides a very important information on relative critical areas of the country under threat of water shortage in the near future. Problems faced in each basin were also identified and recommendations to cope with these problems were provided.
NATIONAL POLICY ON WATER RESOURCES MANAGEMENT
The eighth National Economic and Social Development Plan (8th NESDP), effective 1 October 1996, has emphasized the management of water resources as follows:
1. There must be a mechanism with legal support to supervise and coordinate the development of water resources at the national and basin levels in order to provide a direction and for a continuity in the development.
2. There must be an appropriate water allocation among users for various activities based on necessity, priority and equity. Concerned agencies shall be mutually responsible for the management.
3. Water charges shall be imposed on water used for industry, agriculture and domestic purposes. The structure for water charges shall reflect the investment cost, production cost, distribution cost and treatment cost.
4. Transportation and distribution of water for irrigation and for domestic uses shall be improved so as to reduce losses.
5. The public awareness programmes on water conservation and improved efficiency of water uses shall be promoted. Water saving devices shall be promoted in the community. The cooling water and the water released from the treatment plants shall be recycled for some industries.
MAINTENANCE AND MODERNIZATION PROGRAMMES
The Royal Irrigation Department (RID) is responsible for most of the irrigation projects in Thailand. Latest figures show that the RID's budget is 44,000 million baht which is equivalent to 4.4% of the national budget. From this amount, the RID allocates 2,845 million baht for maintenance and modernization costs which can be broken down as shown in Table 2. It is estimated that in the next ten years not less than 15,000 million baht would be invested in the modernization programme of large and medium scale projects with a targeted area of approximately 3.5 million rai (0.56 million hectare).
The modernization programme includes:
TABLE 2
Repair, maintenance and modernization budget
|
Item
|
No. of projects |
Budget (million baht) |
||
|
1995 |
1996 |
1995 |
1996 |
|
|
1. Repairs & Routine Maintenance |
146 |
146 |
1068 |
1258 |
|
2. Rehabilitation and Modernization |
123 |
125 |
1526 |
1587 |
Activities to support the project
In nearly all of the projects the aim is to increase crop yields and thus to increase farmers' income. This is done by various means such as:
Crop types and cultivation methods
The cultivation method as well as the use of varieties of plants in the Mae Klong Irrigation Project in Thailand were immediately changed from transplanting to broadcasting and from local rice varieties to a high yielding variety as soon as the first irrigation and drainage works were completed. The farmers preferred and were expected to continue to use some 20% of the total rice area to produce traditional local or special local improved rice varieties. The reasons for farmers to keep growing a local variety are: firstly, they preferred the local rice for their own consumption; secondly, the local variety fetched relatively higher prices and finally farmers had to grow a local variety in some areas where proper water management was not possible especially in floodprone areas.
The choices of a particular cultivation method also depended on:
Because of the increase in labour cost and the short duration of the irrigation season, the trend is to increase the broadcasting method and to decrease the transplanting method. However, an important disadvantage in broadcasting is that weed control is more difficult and only possible by the application of herbicides which are costly agro-chemicals. In the Mae Klong Project it was estimated that up to 65-70% of the rice area would be brodcasted and the remaining transplanted although lower yields would be derived from the broadcasted areas due to weed problems.
In Thailand which is a predominantly rice growing country, it is normally the case that growers who change from rice to other crops will need to help themselves regarding water requirements. However, in future the operators will also need to adjust themselves to cope with the changing situation. This is where a modernization programme might be required.
Farm inputs
Labour
Human labour in rice cultivation was approximately 40 work-days/ha in the non-irrigated areas but 90 work-days/ha in the irrigated areas. The increase was a results of more labour required to maintain the irrigation and drainage systems, more weeding and pest control, more harvesting, threshing and transportation.
Seed
Farmers normally retain part of their crop as seed for the next season. If new or extra seed is required they are used to buy it from neighbours or from the rice mills. Seed is rarely obtained from the Extension Service. High quality certified seed is considered too expensive.
Fertilizers
Before project implementation farmers normally did not use fertilizers for the wet season crop except for a few kilogrammes on their seedbeds (HYV rice). During the dry season almost all farmers used fertilizers for their rice, in general high yielding RD varieties.
Marketing
Marketing arrangements for paddy, rice and sugarcane are not very complicated and farmers in general do not complain about the existing situation. Rice growers normally sell their paddy to traders. Farmers normally do not have to take care of transportation as most of the paddy is collected at the farms by the buyers.
Marketing of almost all crop inputs and of agricultural produce is primarily handled by the private sector. Co-operatives offer no or very few services. Farmers are complaining mainly about the annual price fluctuations, and try to compensate these low prices by reducing the application of agro-chemicals and by minimizing the use of hired labour. Both measures contribute to lower yields.
Credit
The majority of the farmers are making use of agricultural production credit from official credit sources as well as from the private sector. A general complaint from the farmers was and still is that official credit i.e. from the Bank of Agriculture and Agriculture Co-operatives (BAAC) although cheaper, is too difficult to obtain. They also consider the average loan available per hectare too low. Consequently most of the farmers have to obtain additional loans from rice mill owners, land owners, shopkeepers or from the quotamen at very high interest rates. Also these high interest rates made farmers use less crop inputs.
FARMERS' PARTICIPATION
Farmers play very important roles in various stages of project implementation. During planning, farmers could help in providing opinions in laying out of an efficient irrigation and drainage system including locating suitable sites for structures to fit needs and to avoid land procurement problems. During construction, labour could be obtained locally and adjustment in the field works could be conveniently carried out. After construction, the farmers would have to share water and take part in maintaining common infrastructures. Normally water users contribute labour to participate in the operation and maintenance of the irrigation system, water allocation and other concerned activities. The water user groups (WUG) are supported by relevant agencies. Many water user groups can be formed into water user cooperatives (WUC) to be legalized under the Cooperatives Act B.E. 2511 (1964). The WUCs will facilitate the WUG to manage the business and marketing, to obtain assistance such as revolving funds, technical support and other inputs from related agencies.
In most irrigation projects in Thailand, the design of the tertiary system is based on rotational irrigation. Check structures in the irrigation ditches located at intervals of about 300-400 m divide the ditch into service units. The distribution of irrigation water within one service unit is the responsibility of all the farmers within that unit so called “Water User Group”.
Field studies at service unit level in the Phitsanulok Project indicated that farmers rarely followed a rotation schedule, and that farmers at the head of a ditch use more water than required. By recovering the return flow from the on-farm drains the majority of the farmers in land consolidation areas manage to get an adequate water-supply onto their fields. However, in areas where the water management programme was undertaken, a marked improvement in water distribution at ditch sector level was achieved. Maintenance of the ditch and the drain is only done incidentally. At some places it is done as mutual help, at other places the farmers collect money (Baht 100-200 per ha per season) and hire people for ditch cleaning.
The experiences and lessons learned from various irrigation projects suggest the following:
IMPACT OF MODERNIZATION PROGRAMMES
Engineering aspect
The resulting impact of modernization programmes in engineering terms are:
Agricultural aspect
The modernization programme should provide a margin of additional capacity to allow for flexibility in cropping intensity and cropping patterns.
Economic aspect
The modernization programme should result in low operating and maintenance costs of the project. Feasibility studies of many modernization projects showed a very good economic return as a result of improved efficiency of water use which is utilized to expand the irrigated areas or increase cropping intensity.
Staffing aspect
The introduction of new technology would require better trained operators to be familiar with more sophisticated equipment.
FUTURE TRENDS
Based on the projection of water demand and implementation of water storage in the next 10 years, it is obvious that storage of water will likely occur in many areas of the country. The modernization programme to improve efficiency of water is a supplement to the augmentation of new water storages. Both hardware and software approaches are to be implemented in the modernization programme to suit particular requirements of each project. Presently, the Royal Irrigation Department is preparing a master plan for improvement of existing irrigation and drainage projects in the country. The high prioritized projects would then be selected for further studies at the feasibility and the design levels. It is expected that modernization programmes would be implemented accordingly. It is recommended that training of staff would be included in the course of the study or design to be provided by qualified experts.
INTERNATIONAL COOPERATION
Since modernization of irrigation schemes is relatively new to Thailand, there are many areas of interest to the staff who work in this field including:
The support for technical advice or exchange of experience in the above and related areas would be beneficial to the planners, designers and operators of such facilities. Networking for exchange of information is also a means to keep the interest group in close cooperation.
REFERENCES
Royal Irrigation Department, 1995. The Master plan for Water Resources Development. Volumes 1 and 2, (In Thai).
Royal Irrigation Department, 1998. Mae Klong Irrigation Project - Malaiman Phase I Project Completion Report.
The World Bank, 1989. Project Performance Audit Report on Phisanulok Irrigation Project and Chao Phya Irrigation Improvement II Project.
O&M Division, Royal Irrigation Department, 1994. Final Report on Water Allocation Programme.
Pierre Rousset, 1991. Infrastructure Improvement of Lam Nam Oon Irrigation Project. ICID 8th Afro-Asian Regional Conference, Bangkok.
|
1 It could alsobe argued that Bangladesh belongs inthe first group. 21a = 100 m². |
![]()
![]()
![]()
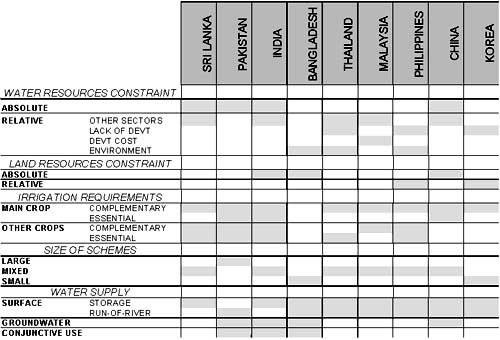
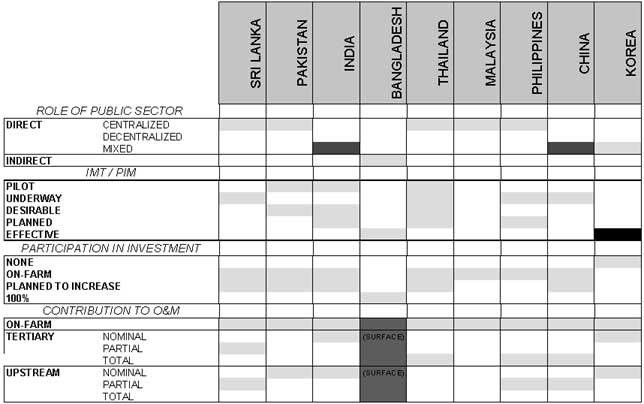
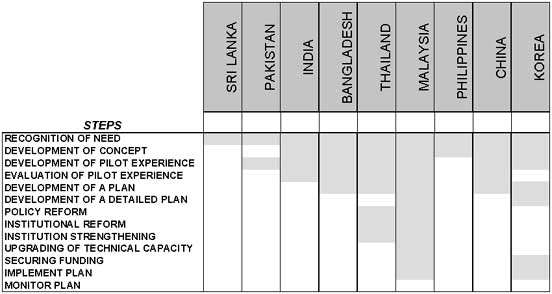
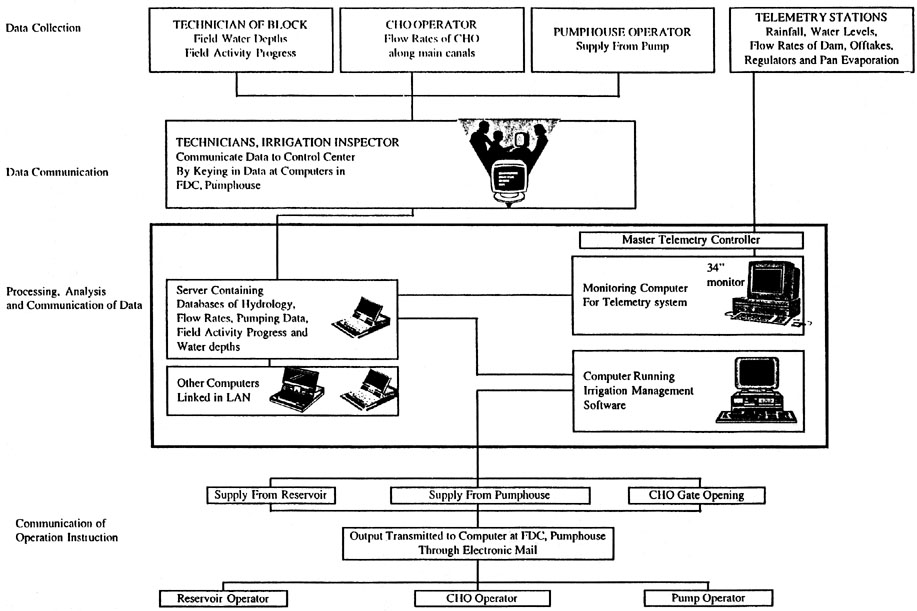