![]()
![]()
![]()
The Gansu Integrated Desert Control and Sustainable Agriculture Project (UNDP/FAO project CPR/91/111) was implemented between 1993 and late 1997. Its main objectives were:
This case study presents an analysis of the pastoral resources, integrating long-term grassland resource field monitoring, GIS and system modelling techniques. The integrated approach was designed to take into account the complexity, spatial diversity and dynamics of the pastoral system, and synthesize an understanding of the magnitude, relationships and levels of utilization of the current pastoral resource components. The approach also facilitated the establishment of a benchmark for later evaluation of the impact of development and revised management options on forage resources and livestock support capacity. The analyses demonstrate the use of pastoral resource assessment and monitoring as tools for the formulation of resource-led policies for livestock production. Complete details are given in the final report of the International Range Management Consultant (FAO, 1997).
The analyses relate to Minqin County in central-eastern Gansu Province, on the Alashan Plateau between the Badanjilin and Tenggeri deserts (at about 38_N and 103_E). Its area is 1 600 000 ha and the topography is generally a shallow basin with some low-lying hills and large areas of mobile and semi-mobile dunes and Gobi desert. Altitudes range from 1 000 to 1 936 m, with most land at about 1 300 m. The climate is arid continental, with hot summers, severe winters and low modal rainfall. The main physical features of the county are large areas of sparsely vegetated natural grazing and desert, with a central zone of irrigated cropland, known as the oasis.
Sheep, goats, donkeys, mules, horses, cattle and camels are the main livestock raised. The total winter livestock population is over 340 000 head, the majority of which are sheep. The central oasis covers about 132 000 ha and mainly produces wheat, maize and seed melon. Special-purpose fodder production is minimal. Water availability and desert encroachment are major constraints to agriculture, forestry and livestock production in Minqin County and a significant lowering of the water table is of major environmental concern.
The land and forage resources and their integration with livestock production were analysed using a modelling technique for pastoral systems (RAPS) in combination with GIS (ESRI ArcView/Info software) for mapping and spatial data analysis and field monitoring for establishing a benchmark and identifying resource trends. The general relationship of the three components is shown in Figure 18.
Figure 18. Input parameters and the general relationship between the GIS analysis, pastoral system modelling and grassland resource monitoring components of the pastoral resource assessment programme.
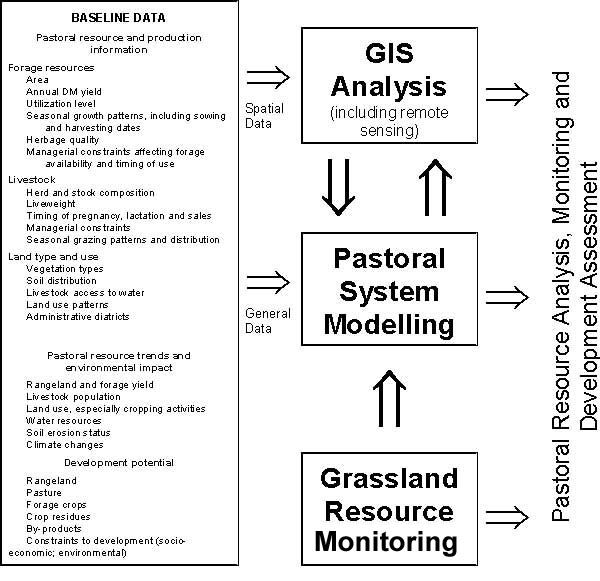
Pastoral system modelling was used to avoid limitations of the traditional techniques of assessing carrying capacity, and to bring the methodology in line with the advanced GIS and remote sensing technology available in the project. The RAPS model primarily uses ME as the forage-livestock integrator. For each land and forage unit, the main parameters incorporated in the land-forage database were: area, annual DM yield, utilization level, seasonal patterns of growth and herbage quality (including depreciation), and managerial constraints affecting forage availability and timing of use. For the livestock component, estimations of forage requirements for each livestock class were based on livestock type, herd or flock composition; profiles of liveweight change (annual and seasonal); changing physiological condition, relating particularly to pregnancy and lactation; allowances for environmental conditions peculiar to the site; and managerial policies and constraints.
Formulae for determining the energy requirements for varying body weights and physiological condition were based on published standards (e.g. Agricultural Research Council, 1980; National Agricultural Research Council, 1981; Standing Committee on Agriculture, 1990) adapted to local grazing conditions and climate. Forage quality, as indicated by ME content, was inferred from local and published data (e.g. Cottle, 1991; Drew and Fennessy, 1980).
The baseline databases, representing the current land and forage resources and the livestock production regime of the county, were derived from specialist opinion, research results, county statistics, survey results and maps. The baseline databases did not incorporate assumptions of optimized or sustainable use. The baseline forage resource database reflected productivity and utilization levels for a "normal" year at current levels of development. Similarly, the livestock database reflected current productivity and levels of feeding as constrained by forage availability and quality, and present livestock types and herd and flock compositions.
Forage production characteristics for each grassland type were based on surveys carried out prior to the project and adjusted according to field observation and local specialist opinion. None of the grassland types or other forage sources were aggregated during the modelling process and, unless management constraints or other use patterns were imposed, were prioritized for use on the basis of livestock forage quality requirements and minimized forage quality "loss." As far as practicable, the unique characteristics of the vegetation of each land type were defined.
Spatial data, including land unit areas, were derived from earlier land type, vegetation and other resource maps of Minqin County. These were digitized and analysed using the GIS. The basic land types were spatially separated into 350 units. This enabled patterns of livestock use of the land types to be spatially represented and any management constraints relating to the use of particular areas to be defined independent of other areas of the same land type. A further improvement to the resolution of the land and forage database was achieved by the inclusion of estimates of zones of differing forage production and grazing intensity, associated with proximity to livestock watering points. The utilization zones were generated from a digitized and updated watering point map originally produced by the Minqin County Animal Husbandry Bureau. The utilization zones represented 0 to 2.5 km, 2.5 to 7.5 km and more than 7.5 km from watering points (mainly shallow wells). The livestock database was derived from mean livestock numbers reported in county statistics between 1994 to 1996, adjusted to account for the widely acknowledged understatement of sheep numbers.
Once all databases had been compiled and subject to cycles of review, the characteristics of the current regime were assessed by integrating the forage supply with livestock intake. The baseline databases permitted the evaluation of:
The grassland resource monitoring programme was designed as an integral part of the pastoral analysis procedures so as to provide quantitative information on the current condition of the grazing resources and to monitor them over a period of years to identify trends. The resultant information could then be used to prioritize rangeland types according to urgency for modified grazing management, protection or rehabilitation.
The technique known as height-frequency analysis (Dickinson et al., 1992; Scott, 1965) was adopted for the programme. This technique incorporates the height distribution of plants, and therefore is a sensitive indicator of varying grazing pressures and other factors affecting plant growth. The technique can be used in both grasslands and shrub lands, so a standardized methodology can be applied over the whole survey area. Additionally, the technique is faster than traditional point analysis and does not suffer from the same difficulties as point analysis in wind-prone grasslands.
Information produced using the technique includes: height-frequency profiles for individual plant species or grouped grasses, forbs, shrubs and trees; and site resource indicators, such as plant species count, botanical composition, annual species component, biomass indices, site variability, vegetative cover and mean plant height. Plant biomass indices can be used to estimate standing DM and so are useful for setting up the RAPS land and forage databases and for checking model output.
The pastoral resources of Minqin County are characterized by two contrasting forage sources: arid grazing and irrigated cropland. The spatial heterogeneity of the rangeland land types and the central location of the irrigated oasis cropland are shown in Figure 19.
Figure 19. Distribution of range- and cropland types in Minqin County, China.
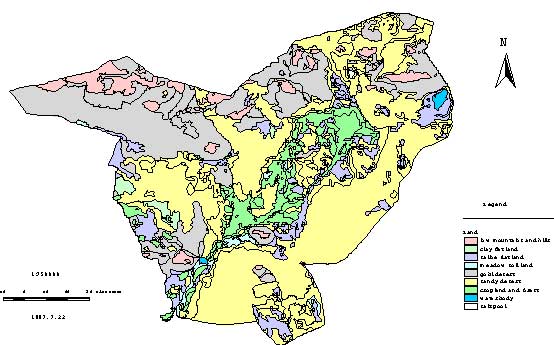
A summary of the yield estimates and areas for all forage sources grouped according to a range of criteria is presented in Table 7. The yield estimates are bimodally distributed, representing the contrasting arid and irrigated growth conditions. For the rangeland, average yield is estimated to be about 200 kg DM/ha, while in the irrigated oasis the average is 6 000 kg DM/ha for cereal crops, 3 000 kg DM/ha for fodder crops and 1 200 kg DM/ha for pastures. For the grazing land, the highest yielding land types were the clay, saline and meadow soils (350-450 kg DM/ha) while the predominant land type, the sandy desert, yields about 150 kg DM/ha. The spatial distribution of rangeland yields is shown in Figure 20.
Table 7. Summary of grouped land units | ||||
GROUP |
AREA |
YIELD |
PROPORTIONAL | |
ha |
% |
kg DM/ha |
DM% of Total | |
RANGELAND TYPES | ||||
Low mountains and hills |
78 254 |
4.9 |
151 |
1.5 |
Rangelands TOTAL |
1 474 663 |
91.8 |
202 |
38.1 |
CROPLAND OASIS SUB-TYPES | ||||
Irrigated |
77 166 |
4.8 |
4 854 |
48.0 |
Oasis TOTAL |
132 016 |
8.2 |
3 121 |
52.8 |
PASTURE GRAZED (perennial) | ||||
Improved legume |
2 085 |
0.1 |
6 501 |
1.7 |
Pasture TOTAL |
34 131 |
2.1 |
1 204 |
5.3 |
FORAGE CROPS | ||||
Legume |
406 |
0.0 |
1 992 |
0.1 |
Forage Crop TOTAL |
7 577 |
0.5 |
3 086 |
3.0 |
CONSERVED FEED | ||||
Silage |
- |
- |
- |
- |
Hay and silage TOTAL |
223 |
0.0 |
3 470 |
0.1 |
CROP RESIDUES | ||||
Wheat straw |
36 358 |
2.3 |
5 828 |
27.1 |
Crop Residue TOTAL |
67 280 |
4.2 |
6 027 |
51.9 |
PURCHASED FEEDS | ||||
Grain |
2 625 664 kg |
0.3 | ||
Purchased feed TOTAL |
2 835 496 kg |
0.3 | ||
PROXIMITY TO LIVESTOCK WATER | ||||
Well <2.5km |
474 553 |
29.5 |
119 |
7.2 |
Well Zone TOTAL |
1 474 663 |
91.8 |
202 |
38.1 | REVEGETATION |
Oasis protection |
61 906 |
3.9 |
242 |
1.9 |
Revegetation TOTAL |
61 906 |
3.9 |
242 |
1.9 |
Figure 20. Estimated rangeland yields for Minqin County, China.
|
The analyses indicate that the mid-winter livestock support capacity for a "normal" year is 421 000 head. Over the whole county, about 81% of livestock are sheep, 11% donkeys and 4% cattle. Goats, horses and mules, and camels together account for the remaining 4%. Table 8 summarizes the livestock data, including estimates of composition and liveweight.
Table 8. Livestock summary showing class and type composition and mean liveweights (mid winter) | CLASS |
Number |
% |
Av. liveweight |
Sheep | |||
lambs |
0 |
0.0% |
19 |
Total - sheep |
339 683 |
81.0% |
40 |
Goats | |||
kids |
0 |
0.0% |
13 |
Total - goats |
6 062 |
1.4% |
31 |
Cattle | |||
1st yr. |
0 |
0.0% |
69 |
Total - cattle |
16 901 |
4.0% |
311 |
Horses and mules (total) |
8 022 |
1.9% |
299 |
Donkeys (total) |
47 322 |
11.3% |
200 |
Camels (total) |
3 132 |
0.7% |
490 |
Total |
421 121 |
||
Most livestock are owned by farmers of the irrigated oasis and are on the grazing land mainly during the summer. The timing and degree of movement to and from the grazing areas is primarily governed by the seasonal pattern of cropping and according to seasonal forage availability, which is, in turn, influenced by the highly variable rainfall.
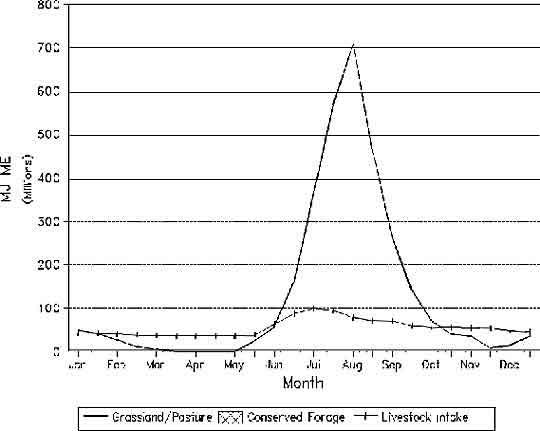
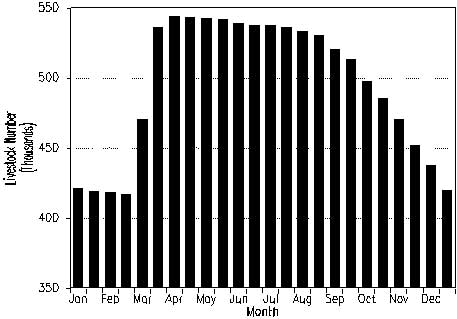
The pattern of forage supply relative to livestock intake is shown in Figure 21. The seasonal pattern of rangeland, pasture and forage growth represents an integration of the individual growth profiles of all the different land types and utilization zones, plus some irrigated residue sources used in situ. In a "normal" year, growth begins in April or early May and the growth rate increases towards the peak of the wet season. Maximum production occurs in late July to August. The vertical bars in Figure 21 represent timing of the harvest and storage of crop residues, feed grain, hay and the purchase of some feeds.
Figure 21. Pattern of forage production and livestock forage intake (units are MJ ME × 106)
As is typical in such an environment, there is a high degree of incompatibility between the short seasonal pattern of fresh forage production and the year-round pattern of livestock forage requirements. With current patterns of grazing, maximum energy intake occurs during May to August, when there is an increasing abundance of high quality fresh herbage. During those times of the year when pasture production falls below livestock intake (September to April), herbage carried over in situ from the previous growing season is grazed and all forms of conserved and purchased fodder are fed. Figures 22a to 22e illustrates other general features of the pastoral resources. Figure 22c shows the pattern of conserved forage use relative to livestock intake. Overall, conserved forage accounts for 57% of supply and provides almost all of livestock feed from late October to late April.
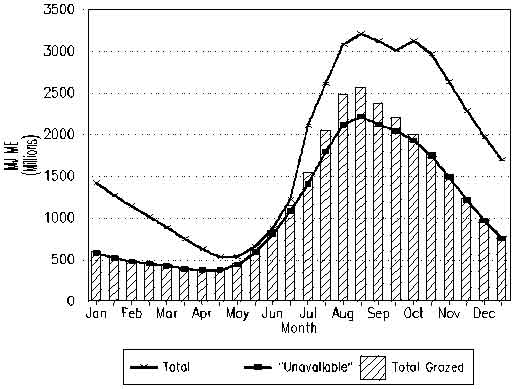
The analysis indicates that about 30% of the gross annual ME produced is actually consumed by livestock. The utilization limit coefficients applied to each land unit mean that, overall, 67% of total production is unavailable for intake. Carry-over losses of standing forage from the time of growth to the time of consumption account for the balance. The proportion of carry-over loss is very low in this particular pastoral system because the forage is almost exclusively consumed during its period of growth.
Variability in livestock forage requirement and forage production are two major factors influencing the productive capacity of the pastoral resource and must be taken into account when interpreting analysis results, especially for development planning.
Historically, forage requirements have varied considerably, reflecting the high degree of flux of livestock type and numbers. Since 1949, two major events significantly influenced livestock numbers. A decline in sheep, donkey and cattle numbers in the late 1950s until the early 1960s is attributed to a major drought. The adoption of the household responsibility system in 1982 led to rapid increases in the numbers of sheep and donkeys, and a decade-long decline in cattle numbers. Since the early 1980s, sheep numbers have increased at about 5% per annum. Overall, the annual increment of stock units for the same period is about 3%.
Figure 22a. Seasonal profile of available DM over all grazed lands.
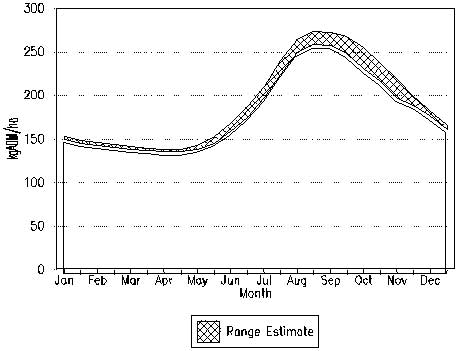
Figure 22b. Pattern of forage balance
A high level of variability of forage production and therefore of uncertainty in livestock feeding, occurs despite the relative reliability of irrigated cropland feed sources. Inter-year fluctuations in natural grazing are so extreme that most herders interviewed were unable to define a "normal" growth period for the vegetation.
The influence of inter-year variability of forage production on livestock support capacity was estimated, by inference, from monthly rainfall records, 1960 to 1994. Different coefficients of variability were used for irrigated and rainfed forage sources (the latter being greater). The analysis assessed forage production variation over a random sequence of 100 years and assumed a neutral long-term trend in forage yield, and that forage utilization limits and livestock intake levels were as for the main analyses. The results are presented in Figure 23. The coefficient of variation (CV) of livestock support capacity is 25%, and during one in five years forage production falls below the lower standard deviation. This result is consistent with herders' comments on the occurrence of years of serious forage shortages. If a trend of declining grazing land productivity is assumed, such as that linked with lowering of the water table, then the frequency of years of serious forage shortages will increase dramatically unless stocking loads are decreased (Figure 24).
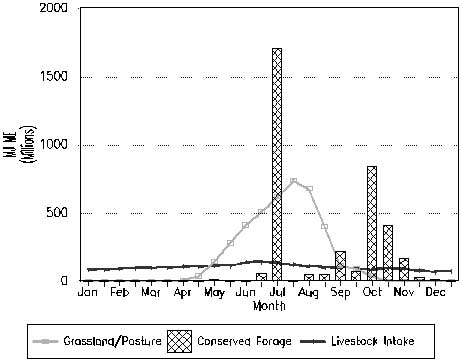
Figure 22c. Pattern of conserved forage use relative to livestock forage intake.
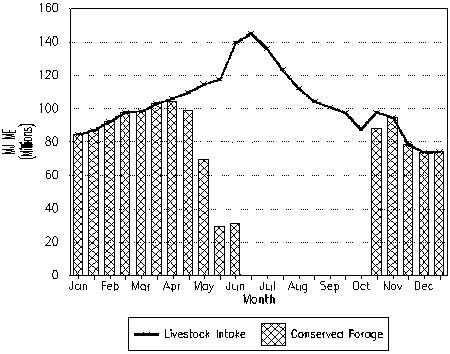
Figure 22d. Proportions of total DM contributed by grazed and conserved forage sources.
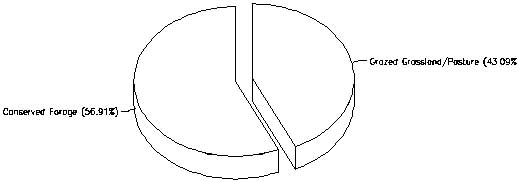
Figure 22e. Seasonal pattern of livestock numbers
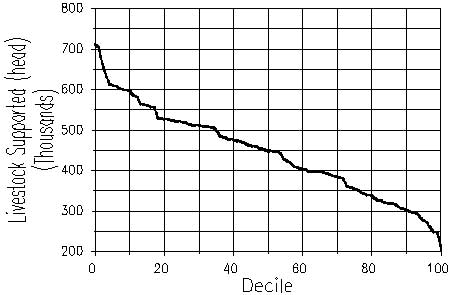
Estimates of livestock support capacity for deciles of years are shown in Figure 25. The figure indicates that, in the extreme, a total winter population of 600 000 head could be supported in one year in ten, whereas a winter population of 300 000 head could be supported in nine years in ten.
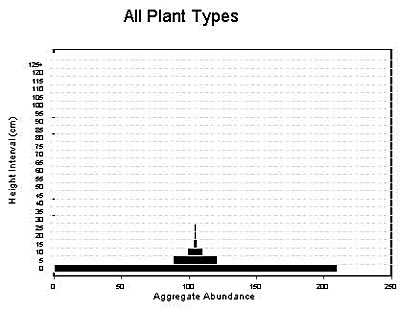
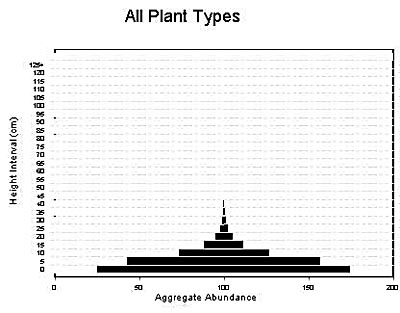
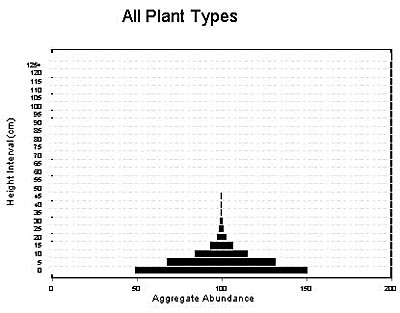
The long-term grassland resource monitoring programme was initiated in 1996 with the establishment of 60 permanently-located 250-m transects in three of the major land and vegetation types of Minqin County. The results of initial field measurements made in June-July and October 1996 are presented in Table 9 and Figure 26. A comparison of height-frequency profiles between the dates illustrates the usefulness of the technique in detecting vegetation changes.
Figure 23. Estimate of the impact of inter-year variability of forage production on livestock support capacity assuming a neutral long-term trend in forage yield.
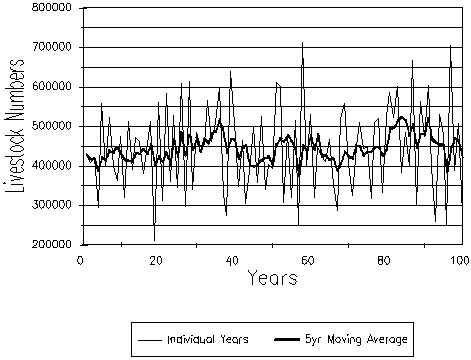
Figure 24. Estimate of the impact of inter-year variability of forage production on livestock support capacity with long-term decline in rangeland yield (1% per year).
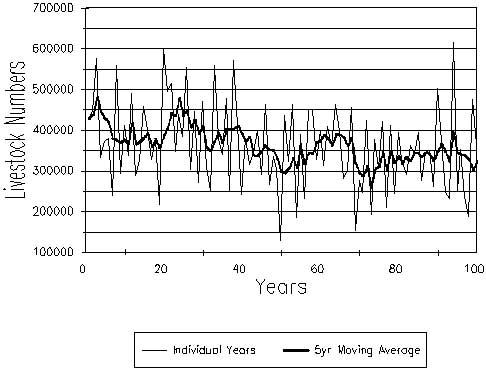
Figure 25. Estimates of livestock supported at deciles of years (mid-winter numbers)
The final stage of the analysis of Minqin County involved the identification and assessment of practicable development opportunities. A critical analysis of a wide range of development possibilities led to the conclusion that increased fodder growing within the oasis, crop residue treatment and the implementation of a livestock exclusion and land rehabilitation zone around the oasis, were the most promising options (FAO, 1997).
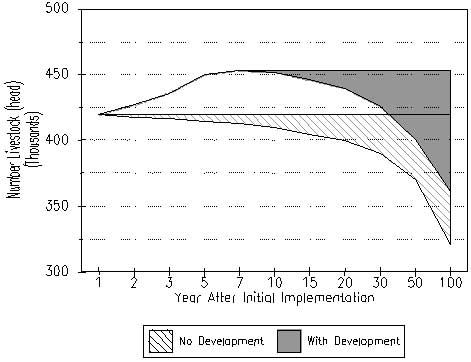
A series of RAPS analyses quantified the impact of the proposed development options. The "dynamic" effect of development, taking into account changes in livestock support capacity over time, was assessed by incorporating differing rates of implementation of the options and estimates of a concurrent decline in rangeland productivity. For fodder crop development, an additional 5 000 ha of Medicago sativa (or sativa×falcata hybrids) producing 7 500 kg DM/ha was assumed, with a moderate rate of implementation. By the fifth year, 75% of the proposed area would be producing fodder crops and by about the tenth year 90% of the proposed area would be under fodder. For the 267 000 ha livestock exclusion buffer zone, it was assumed that 90% of the area would be established by about the eighth year and full implementation achieved by the fifteenth year. Thereafter increasing amounts of forage would be available, within the exclusion zone, for controlled livestock use.
The forecast impact of fodder crop development and livestock exclusion from the oasis buffer zone is shown in Figure 27, together with the "no development" option. The shaded areas represent estimates for with and without an overall decline in grazing land productivity of 1% per year.
The analyses of the land, forage and livestock resources, using GIS and modelling techniques, provided an understanding of the magnitude, relationships and levels of utilization of the present pastoral resource components. They also provided a benchmark for appraising the impact of development and revised management options on forage resources and livestock support capacity. The benchmark analyses, in combination with the grassland resource monitoring programme, will be used as a reference for the long-term monitoring of the resources.
The analyses have highlighted the high level of complexity and dynamics of the pastoral system. These characteristics generally mean that there is no single simple solution to the development of livestock production and protection of the environment. While development opportunities were identified and evaluated, their implementation is conditional on their thorough and critical assessment within the context of: national production targets; social and cultural customs; compatibility with the desires and future plans of target groups; market opportunities; economic viability over the short to medium term; local skills; flexibility to be able to respond to changing conditions; and the degree of environmental impact and the practicability of any measures required to mitigate any negative impact.
Analysis results and observations suggest that the grazing lands are currently undervalued and therefore overexploited as a forage resource. Farmers who own livestock must be encouraged to take responsibility for feeding their livestock from irrigated land and not to expect that grazing will continue to be a free and limitless resource.
The resource analyses dealt with the pilot county of a programme with a regional focus. The next step was the extension of pastoral resource analysis and monitoring to other counties of the Hexi Corridor. The counties would have differing mixes of land resources so as to ensure that examples of all major land types of the Hexi Corridor were analysed and monitored. This should facilitate expansion of the programme throughout the Hexi Corridor. As results of the grassland resource monitoring programme and other research activities become available, databases will be updated to increase the scope and integrity of the analyses.
Pastoral resource assessment and monitoring techniques, of the type described above, are invaluable tools for the formulation of resource-led policies of livestock production, rather than the less sustainable, production-target-led approach. Poverty alleviation can only be achieved if the capacity of the land is not continually exceeded, and if negative environmental impact is minimized. This is especially relevant to pastoral systems such as Minqin County, where the grazing land is subject to continual increases in livestock numbers and its productivity and stability is threatened by a falling watertable caused by large-scale and intensive irrigation within the oasis.
Table 9. Summary of results of the
Project Grassland Resource Monitoring Programme, | |||||||||||
PARAMETER |
JUNE/JULY 1996 |
OCTOBER 1996 |
Biomass Index (BI) change | ||||||||
Grass |
Forb |
Shrub |
Other |
BI Total |
Grass |
Forb |
Shrub |
Other |
BI Total |
||
Minqin County - Desert grassland | |||||||||||
Species |
9 |
17 |
|||||||||
Composition (%) |
0.29 |
0.06 |
99.65 |
0 |
0.66 |
13.58 |
85.76 |
0 |
|||
Annual species (%) |
0.06 |
12.83 |
|||||||||
Biomass |
0.25 |
0.05 |
85.45 |
0 |
85.75 |
0.75 |
15.45 |
97.60 |
0 |
113.80 |
33% |
Site Variability (CV) |
64.17 |
72.73 |
|||||||||
Vegetative cover (%) |
1.93 |
0.99 |
|||||||||
Mean height (mm) |
153.86 |
141.63 |
|||||||||
Minqin County - Gravel grassland | |||||||||||
Species |
33 |
35 |
|||||||||
Composition (%) |
25.36 |
19.11 |
55.53 |
0 |
46.55 |
31.93 |
21.52 |
0 |
|||
Annual species (%) |
8.37 |
64.06 |
|||||||||
Biomass |
31.05 |
23.40 |
68.00 |
0 |
122.45 |
118.9 |
81.55 |
54.95 |
0 |
255.4 |
109% |
Site Variability (CV) |
49.55 |
60.14 |
|||||||||
Vegetative cover (%) |
2.64 |
1.95 |
|||||||||
Mean height (mm) |
49.77 |
37.87 |
|||||||||
Minqin County - Salt meadow | |||||||||||
Species |
7 |
10 |
|||||||||
Composition (%) |
50.79 |
0.75 |
48.46 |
0 |
42.22 |
0.89 |
56.89 |
0 |
|||
Annual species (%) |
0.04 |
0.24 |
|||||||||
Biomass |
182.75 |
2.70 |
174.40 |
0 |
359.85 |
94.80 |
2.00 |
127.75 |
0 |
224.55 |
-38% |
Site variability (CV) |
56.76 |
62.54 |
|||||||||
Vegetative Cover (%) |
3.95 |
2.63 |
|||||||||
Mean height (mm) |
78.58 |
78.76 |
|||||||||
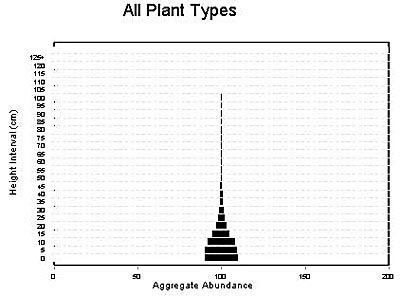
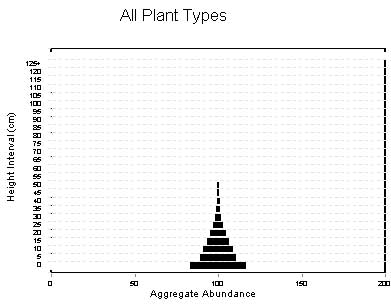
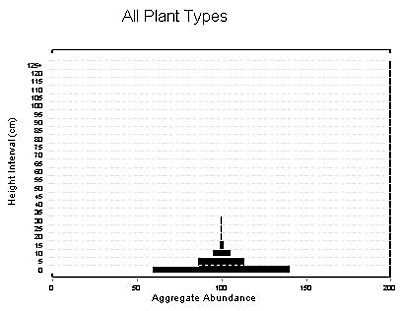
Figure 26. Aggregate height/frequency profiles of plant species within each land type | |
|
June/July 1996 |
October 1996 |
|
Desert grassland | |
|
|
|
Gravel grassland | |
|
|
|
Saline meadow | |
|
|
Figure 27. Forecast livestock support capacity with fodder crop and livestock exclusion buffer development options compared to no development, with and without long-term decline in rangeland productivity |
|
Note: Assumes current winter livestock support capacity of 421 000 head. |
The Forestry Development Project (GCP/SUD/047/NET) was implemented in 1993 to address issues of sustainable forestry production at the national level. The Dali and Mazmum forests (Sennar State) and the Wad Kabo and Rawashda forests (Gedaref State), in central and eastern Sudan respectively, are typical of the forests that were targeted for integrated multipurpose management by the Sudanese Forests National Corporation (FNC).
The forest resources have been subject to increasing pressures from people and livestock, particularly in recent decades. Much of the increased pressure is attributable to the reduction of grazing lands in the vicinity of the forests as a result of expansion of cropping. Livestock increasingly depend on forage within the forested areas as they migrate between the northern (wet season) and southern (dry season) grazing lands. This has resulted in conflict with other uses, such as timber and gum arabic production.
While accepting that livestock production is an essential and traditional use of forested areas, the Project recognized that, to achieve sustainable multiple use, livestock production had to be formally integrated and managed.
Within this context, a grassland, forage and livestock resource analysis of the forests and environs was carried out to address the following project components:
Full details of the assessment are presented in the Consultancy Report (FAO, 1994a).
The Dali-Mazmum and Rawashda-Wad Kabo forests both lie within the inter-zone between the northern "wet-season" and southern "dry-season" grazing lands, and, as such, have been traditionally used by livestock (sheep, goats, cattle and camels) during the twice-yearly migrations.
The seasonal patterns of livestock movement associated with both forests are similar. At the onset of the wet season (Figures 28 and 29), livestock are herded from the wetter areas (more than 500 to 600 mm/yr rainfall) south of the forests to drier areas (more than 300 to 500 mm/yr) north of the forests. The northward movement exploits the ephemeral forage supply of northern areas and also avoids insect and disease problems of the south.
Figure 28. Seasonality and variability of rainfall, Gedaref, 1941 to 1993.
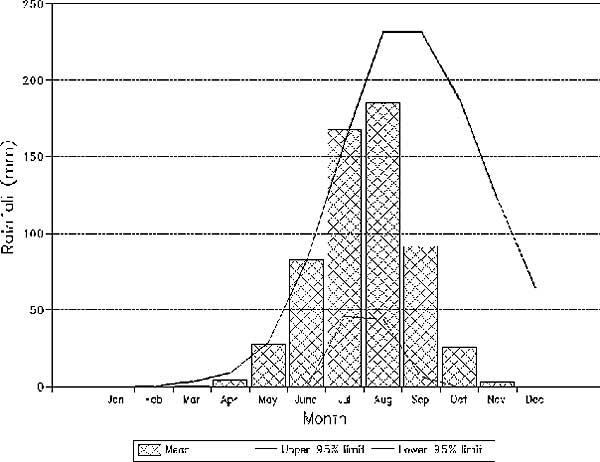
Figure 29. Annual rainfall and 5-year moving average, Gedaref, 1941 to 1993
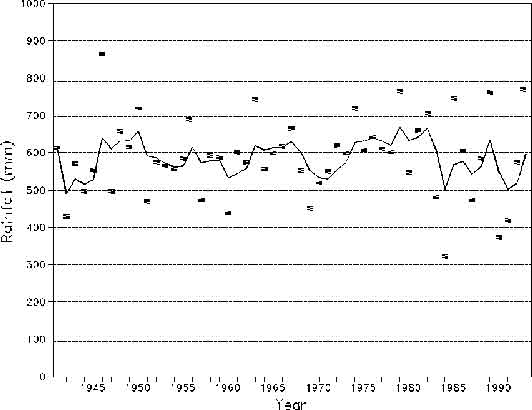
Since the 1960s, with the exception of the impact of the 1984 drought, human and livestock pressures on the forests have increased exponentially, and the traditional patterns of livestock migrations have been distorted. These changes are due to increases in both human and livestock populations, following national trends (between 1917 and 1977, human, goat, sheep, camel and cattle populations increased by about 6, 8, 12, 15 and 21 times, respectively (Olsson and Rapp, 1991)), and the reduction in grazing land through the large-scale expansion of mechanized cropping. The extent of the reduction in available grazing area is illustrated for the Rawashda-Wad Kabo area in Table 10: between 1941 and 1991, the area of forest and woodland (interpreted as grazing land) was reduced by approximately 75%, to occupy 19% of the total area. Extensive grazing lands of the inter-zone in the vicinity of the Rawashda-Wad Kabo forests have all but disappeared. Those that do remain are inherently of lower production potential.
|
Table 10. Land type/use change in the Rawashda-Wad Kabo area, 1941 to 1991 | LAND TYPE |
1941 |
1991 |
|||
km2 |
feddan |
% |
km2 |
feddan |
% | |
Farm lands |
3 150 |
778 050 |
8.8% |
26 000 |
6 422 000 |
72.2% |
Forest and woodland |
28 250 |
6 977 750 |
78.5% |
6 700 |
1 654 900 |
18.6% |
Kerrib |
1 300 |
321 100 |
3.6% |
1 300 |
321 100 |
3.6% |
Jebels, Khors, Rivers, etc. |
3 300 |
815 100 |
9.2% |
2 000 |
494 000 |
5.6% |
TOTAL |
36 000 |
8 892 000 |
36 000 |
8 892 000 |
||
Notes: 1 Sudanese feddan = 0.42 ha. | ||||||
Livestock owned by nomads are increasingly dependant on forage resources within the forested enclaves as they migrate between the northern and southern grazing lands. The once-expansive livestock migration routes, which provided some forage, have often been reduced to narrow barren pathways. Pressure on forage resources within the forests is accentuated by livestock owned by local cropping farmers. Generally, the migrations span about 200 to 350 km. The timing and extent of movement to and from the northern grazing areas varies considerably between years, reflecting the highly variable and unpredictable rainfall.
Northward movement depends on sufficient rainfall to promote a flush of herbage to the north and also to ensure sufficient surface water for livestock drinking. Southward movement is primarily determined by the persistence of watering points in the northern grazing lands. While the timing of departure from the southern grazing lands appears to be more set (due to onset of disease risk and insect pests), if the wet season is delayed then livestock tend to remain longer within the forested areas, and if there is less than "normal" rainfall then the return south begins earlier and the period of use of the forests tends to be extended.
It has become common for herders to delay the southward movement of some of their livestock from the forests, and instead these animals feed on crop residues in the vicinity of the forest. This appears to be more prevalent at Rawashda-Wad Kabo.
The following are generalizations of the timing of migrations associated with each of the forests, compiled from the observations of local FNC staff and from herder interviews:
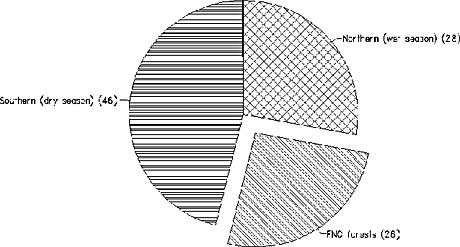
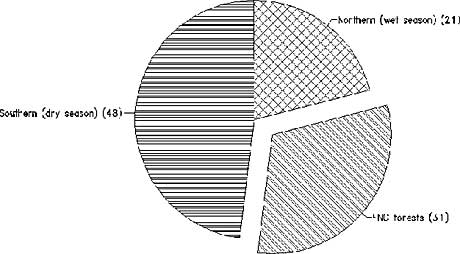
Total annual use of the Dali-Mazmum forests is about 30 to 60 days. Modelling of forage and livestock components of the pastoral system indicated that this represented as much as 26% of annual forage intake (Figure30). For Rawashda-Wad Kabo, the total period of use of the forest is 45 to 90 days per year, corresponding to up to 31% of annual intake (Figure 31). This assessment was based on ME intake. Modelling accounted for gross herd and flock composition differences between the two areas, and the consequent differences in the seasonal pattern of forage and energy intake. Other differences were due to the duration of use of the forest. The high proportions of annual livestock forage intake (as ME) derived from the Dali-Mazmum and Rawashda-Wad Kabo forests illustrates the significance of the forests as forage sources, and also the level of dependence the livestock have on them.
Figures 30 and 31. Relative contribution to forage intake (ME) of each major seasonal forage source, (upper estimates relative to the forested area) | Figure 30. Dali Mazmum
|
Figure 31. Rawashda Wad Kabo
|
The Dali-Mazmum and Rawashda-Wad Kabo forests are dominated by various mixes of Acacia senegal, A. seyal, A. mellifera, A. nubica and Balanites aegyptica. Despite a similar mix of tree species, the character of the forage resources of each forest pair is quite different. Dali-Mazmum forest is composed of heterogeneous and convoluted patches of forest separated by cropland, whereas the Rawashda-Wad Kabo forests form a single and well-defined area. Tree age range is also much less within the Rawashda-Wad Kabo forests and so the tree canopy is more uniform.
The ground vegetation of the Dali-Mazmum forest is dominated by the grasses Cymbopogon sp., Aristida sp., Heteropogon sp. and Setaria sp., whereas Rawashda-Wad Kabo is dominated by: the annual grasses Pennisetum cenchroides, Sorghum arundinaceum, Sporobolus sp. and Aristida sp.; the annual forbs Corchorus olitorius, Hibiscus esculentus, Chenopodium sp., Monechma bracteatum and Cassia tora; and the perennial forbs Abutilon glaucum and Solanum dubium. The differences in species composition between the sites reflect significant differences in rainfall and therefore species adaptation, and also differences in historical grazing use.
In most areas of Dali-Mazmum, the ground cover remains high throughout the main grazing periods, whereas the Rawashda-Wad Kabo forest has large areas that are close grazed and of low plant density. This reflects lower grazing pressures and the low "growing season" palatability of Cymbopogon sp., which dominates the Dali-Mazmum forests.
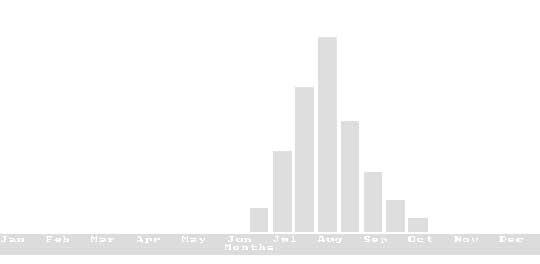
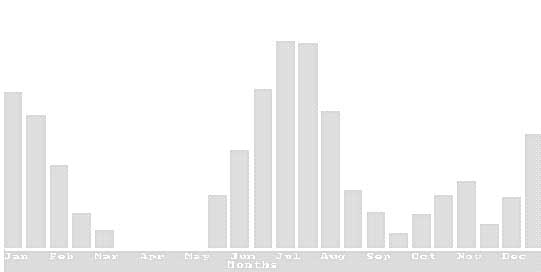
Because of the highly unimodal rainfall, the growth season of the grasses and forbs is confined to a few months and its onset is irregular. Figures 32 and 33 illustrate typical patterns of growth for the grass-forb and shrub-tree components, based on descriptions by nomads and observations of local professionals. For grasses and forbs, growth begins during June and ceases in early October, with peak growth about the beginning of August. Browse production begins in late May and continues through to November in a bimodal pattern. The first peak, shown in Figure 33, represents foliage and twig production, and the second, pod production. A third peak, after December, shown in the figure represents the fall of pods and leaves and therefore their increased availability to livestock.
Forage grown in the few months of the wet season has to supply livestock year-round. Seasonal patterns of forage supply, represented as an integration of all forage sources, and livestock forage intake, are illustrated in Figure 34. Forage carried over as standing hay for dry season consumption accounts for a large proportion of annual production, and depreciates significantly in quality to the point where it provides sub-maintenance nutrition for livestock.
Figure 32. Subjective interpretation of the "typical" seasonal pattern of grass and forb growth (bars represent relative production)
|
Figure 33. Subjective interpretation of the "typical" seasonal pattern of growth and availability of tree- and shrub-derived forage (bars represent relative production)
|
Figure 34. Seasonal pattern of forage production (all sources aggregated) and livestock forage intake in the "Rawashda-Wad Kabo" grazing system
|
There is a paucity of both quantitative and qualitative information of the forage of Dali-Mazmum and Rawashda-Wad Kabo forests. Rough field estimates of average annual production were approximately 2 000 kg DM/ha (large range) for the grass and forb component, and 300 to 700 kg DM/ha for shrub and tree forage component (within browse height). The former estimate compares well with "ungrazed" biomass harvests from within the Rawashda forest during the mid-1980s (FAO, 1986a). Examples of the forage resource estimates for Rawashda-Wad Kabo forest are presented in Table A2.1 (Appendix 2).
The high inter-year variability of forage production is the primary determinant of the character of livestock production in the area and constrains the relevance and practicability of management plans. An estimate of the level of inter-year variability in grass and forb forage production was derived using a simple rainfall-forage production regression (FAO, 1991b). The results, from 50 years data at Gedaref (near Rawashda-Wad Kabo) and for 30 years near Singa (closest to Dali-Mazmum) indicate that the upper and lower 95% coefficient of variation of production from the grass-forb component varies by a factor of two or more - the coefficients of variation of yield at the Gedaref and Singa sites were estimated to be 17% and 22% respectively.
The nomads are probably justified in their complaints of a declining forage resource. Most of their argument is directly related to the reduction of grazing land because of the expansion of mechanized cropping. However, it should not be inferred that the 75% decrease in forest and grazing land in the Rawashda-Wad Kabo area over recent decades (Table 10) led to a similar reduction in forage supply. The actual impact of change in primary land use on total forage resource is dependant on:
There are currently too many unquantified, complex and interrelated factors to be able to draw conclusions on the overall trends in forage resource over the last few decades.
The areas that were not converted to crop land, i.e. the remaining forested or open grazing lands, may have declined in forage productivity because of excessive grazing pressure. Specifically, the contribution from palatable species is reported to have declined. For example Ipomoea cardosepala, I. cordofanum, Blepharis edulis and Crotalaria senegalensis were repeatedly reported by nomads to have disappeared from the Rawashda-Wad Kabo forests and the northern (wet season) grazing lands of the Butana, while Blepharis sp. and Hibiscus sp. were reported to have disappeared from the southern (dry season) grazing lands. There was insufficient information to draw firm conclusions about the relative "decline" between the northern, southern and forest grazing zones.
The slight decline in rainfall recorded near Dali-Mazmum over the last 30 years, which is consistent with the marked decrease in rainfall for Kordofan Province (Olsson and Rapp, 1991), may have led to a fall in potential productivity. However, for Rawashda-Wad Kabo there is no indication of a rainfall-related change. It is probable that the dominant annual grass and forb component of the Dali-Mazmum and Rawashda-Wad Kabo forests is resilient to extremes of use and it would take a serious environmental event to induce a major change. During droughts, which are a normal feature of such a "non-equilibrium" environment, livestock deaths are likely to occur well before the vegetation is forced past an ecological threshold.
Indicators of the occurrence of forage resource limitations (not necessarily of recent origin) are presented in Table 11. Poor nutritive quality of both standing herbage (low energy and protein content typical of tropical grasses) and crop residues that are relied on during the seven- to eight-month dry season leads to large annual losses in liveweight, particularly during April and May. These losses are replaced during a phase of compensatory growth, which coincides with the flush of highest quality herbage growth after the onset of the wet season.
Table 11. Occurrence of indicators of forage resource limitations | ||||||||||||
EVENT |
Jan. |
Feb. |
Mar. |
Apr. |
May. |
Jun. |
Jul. |
Aug. |
Sep. |
Oct. |
Nov. |
Dec. |
Forage shortages |
** |
**** |
**** |
|||||||||
Supplementary feeding |
||||||||||||
Crop residue use |
**** |
**** |
**** |
**** |
**** |
**** |
**** | |||||
Poor livestock condition |
**** |
**** |
**** |
|||||||||
Livestock deaths |
(**) |
(**) |
||||||||||
Source: Derived from eight interviews with nomads | ||||||||||||
The main problems facing the nomads were reported as (roughly in decreasing priority):
Opportunities for development of the forage resources and improvement of livestock production associated with the Dali-Mazmum and Rawashda-Wad Kabo forests are inextricably linked to the multiple uses of the forests and its relationship, as a forage source, to other seasonal grazing lands and the arable lands that supply crop residues.
Potential development options include: improved grazing management, artificial re-seeding, fodder crop cultivation, forage shrub cultivation, better use of crop residues, supplementary feeding, water resource development, control or use of fire, restriction of inappropriate concurrent uses and improved efficiency of livestock conversion of forage to livestock products. The relevance and practicability of the options depends on a wide range of socio-economic, technical and environmental factors. The following key factors were taken into account when identifying valid options (Vallentine, 1971; White, 1988):
Practicable grazing management programmes for the project areas are difficult to formulate and implement because of complex intra-year seasonal patterns of forage supply, high inter-year variability of production and complex socio-economic factors.
Within the context of improved grazing management of the forests, the "optimization" of livestock numbers relative to the overall forage resource is considered fundamental to sustainable production. However, the level of priority depends on the vulnerability of the vegetation (i.e. its resilience) to inappropriate stocking and, from the practical sense, the ease with which livestock can be managed under stringent constraints. Indications are that the grass-forb component of the forest is fairly resilient to "misuse" and that the chance of successfully controlling livestock numbers over the whole forest is low - an opinion supported by local FNC and Range and Pasture Administration (RPA) staff.
In order to determine appropriate stocking loads for each of the forests, it is essential to obtain comprehensive, objective information on the forage resources, including their condition, productivity and dynamics, plus data on livestock populations and patterns of use. Little of this information is currently available. Therefore, from the technical point of view, it is currently possible to neither formulate nor implement comprehensive forest-wide grazing management programmes.
Even if such programmes were formulated they would invariably result in conflict with the nomads' values and be contrary to their traditional management systems. It is unreasonable to expect nomads to have additional large-scale restrictions and controls imposed on resource use after decades of suffering the confiscation of large tracts of grazing lands for cropping.
The best opportunity lies with small-scale and localized grazing management programmes, especially directed at critical or key areas within the forests. Such programmes have the advantage of minimizing the short-term impact of removal of land from the normal grazing resource. In reality these will also be very difficult to implement successfully as there are many local examples where grazing control and protection of relatively small areas has been unsuccessful, such as the fenced and re-seeded site at El Magata, the forage variety trials at El Gadambalia and the re-seeding trial within Rawashda forest. Imposition of restricted access to areas results in a confrontational situation between FNC or RPA staff and the nomads. Nomad agreement and participation will require a programme of dialogue and extension, and the convincing demonstration of the benefits of modified grazing management, either alone or in combination with a re-seeding programme.
For the above reasons, it was recommended that a programme of forage resource improvement involving only modified grazing management within "ordinary" or "normal" forest areas be deferred until the proposed extension programmes and pilot demonstrations involving forage development and livestock management had been established.
Low and erratic rainfall and extremely high evapotranspiration rates typical of the Dali-Mazmum and Rawashda-Wad Kabo forests exert an overriding effect on the success or failure of revegetation or re-seeding programmes, regardless of the intensity of treatments used to prepare seed beds and control undesirable plants. With a unimodal rainfall of 450 to 600 mm annually, the Dali-Mazmum and Rawashda-Wad Kabo forested areas are within minimum rainfall limits considered practicable for re-seeding. This is confirmed by local experience at five sites within the Eastern Region, including Rawashda-Wad Kabo and El Gadambalia.
Research conducted by RPA involved the testing of buffelgrass (Cenchrus ciliaris - a perennial grass), Cenchrus setigerus (a perennial grass), siratro (Macroptilum atropurpureum - a perennial legume), Stylosanthes spp. (annual and perennial legumes) and Clitoria ternatea (legume) with a range of sowing techniques. Broadcasting onto a seedbed prepared by disc harrowing, with a further harrowing after sowing, proved to be the best technique for all species. Clitoria ternatea also proved suitable for establishment using pitting and transplanting, in addition to broadcasting. The use of Macroptilium and Stylosanthes depends on imported seed and is therefore not considered a practical option. Of local species, the following were recommended by RPA for re-seeding programmes: Clitoria ternatea, Phaseolus trilobus, Cenchrus ciliaris, C. setigerus and Blepharis linariifolia.
Under circumstances where adequate seedbed preparation, weeding and site protection can be implemented, artificial re-seeding offers adequate potential to justify small-scale special purpose application. The technique is not recommended for large-scale grazing land improvement programmes as cost and problems of grazing control increase exponentially with scale.
Regardless of scale, the frequency of occurrence of favourable establishment conditions must be accounted for in development planning and the factors that led to the need for re-seeding have to be rectified.
The inclusion of cultivated fodder as a component of cropping rotation within the extensive crop lands adjacent to the Dali-Mazmum and Rawashda-Wad Kabo forests seems an attractive option and is often promoted. The theoretical benefits to the yields of present crops and also to forage supply are well known. The integration of fodder into cropping rotations, particularly at irrigated sites, was the focus of an FAO/UNO/EOA Project (UNO/SUD/009/EOA) that began in 1986. RPA reports that the project was considered successful and that its widespread application is constrained by the availability and cost of good quality forage seed.
Within the context of the Forestry Project, it has been suggested that support for fodder production on arable land (and the issues of seed availability) would lead to a relief of the livestock pressures on the forested areas through the provision of alternative forage sources. There is no evidence to support this expectation. To the contrary, the development of alternative forage sources almost always results in increased pressure on the grazing lands because livestock numbers, owned either by the nomads or farmers, are increased to consume any extra forage. Additionally, fodder grown on the arable area will not necessarily be readily available to the nomads. The farmers are likely to increase their own livestock numbers or, if the fodder is sold to the nomads (as is increasingly the case with crop residues), it will only be used under situations of extraordinary need. It was therefore recommended that project support for fodder crop production within crop rotations be given low priority relative to other opportunities.
Trees and shrubs are traditional and important forage sources, particularly during the normal dry season and for emergency feed during serious droughts. Estimates of its significance to forage intake range from 5% at the beginning of the dry season to 45% at the end (FAO, 1986b). The most common tree species - Acacia senegal, A. seyal, A. mellifera, A. nubica and Balanites aegyptica - all contribute to forage supply either through ad lib browsing or by lopping. With the re-emergence of gum arabic as an economic crop (obtained from Acacia senegal and A. seyal), seasonal protection of the trees during the gum tapping season will lead to a change in the seasonal pattern of browse availability. Cadaba farinosa and C. glandulosa are examples of shrubs whose potential as forage sources has not been fully exploited. C. glandulosa, which was observed growing successfully within rehabilitated A. senegal stands in Dali-Mazmum, is more palatable and is the preferred of the two species. However, problems with its propagation have not been resolved. To this end, a project in western Sudan is currently studying the propagation of this genus.
A controversial aspect of the use of trees and shrubs for browse is the impact of the associated lopping activities. This is frequently a source of complaints and is criticized by forestry staff. However the real impact of the activity on forestry production has not been measured. A simulated lopping trial site installed by CARE within Rawashda-Wad Kabo showed vigorous re-growth of A. seyal trees after being coppiced at 30 cm or 150 cm. When suitable propagation techniques have been identified, there will be an opportunity for the project to test the integration of forage shrubs with the grass- and forb-based re-seeding programmes. Issues regarding the real impact and management opportunities of lopping have to be clarified.
Crop residues are a major, and regularly used, forage resource during the dry season. The potential use of industrial by-products (e.g. from cotton seed or groundnut) for supplementary feeding has long been recognized. The level of use of these resources and the adoption of methods to improve their nutritive value is constrained by economics rather than technology or managerial skills. Therefore the potential for a contribution by the project was limited.
While the availability of water was mentioned as a problem facing the nomads, particularly in the northern grazing lands (Butana), there is no evidence to suggest that it is necessary to provide more watering points within the forested areas. More specifically, the nomads' requests for more water points was more for their convenience rather than necessity. If poorly distributed water points regularly cause serious forage shortages by limiting access to grazing areas, this would have been mentioned by the nomads, but was not the case. Any consideration of the provision of extra water points should be very carefully assessed because the risk of negative environmental impact is high.
Natural or intentional fires are claimed to regularly destroy up to 30 to 35% of annual grazing land or forest forage production. As a consequence, the construction of fire lines is a regular component of development activities. Any livestock management or forage development programme supported by the project should incorporate fire control measures.
The unrestricted conversion of unsuitable lands from grazing to cropping is likely to have led to an economic loss from those areas. This is particularly so considering the high market values of livestock.
If grazing rights to such lands were re-established, including the scheduled expansion and delineation of the livestock routes, then the project would have the opportunity to contribute to their rehabilitation for both forestry and forage production.
A common suggestion for increasing the efficiency of livestock production was to re-structure the herd or flock so that the proportion of unproductive or redundant animals was reduced and performance per animal increased. Various models were produced to illustrate the benefits of these options, but none had been successfully implemented within "non-equilibrium" semi-arid nomadic systems. Apart from social opposition to such policies, irregular severe droughts would precipitate the regular collapse of "efficient" herd and flock structures and therefore negate the theoretical advantages. Similarly, disease control potentially increases the efficiency of conversion of forage to livestock products. Disease control programmes have long been in place and further inputs were likely to have only a marginal impact. Both "efficient" herd and flock structures and disease control carry the risk of increasing pressure on the pastoral resources, including the forested areas, and might, therefore, have a negative environmental impact.
Detailed discussions with nomads and specialists in forestry management, rangeland ecology and livestock production, plus field inspections, enabled the identification of opportunities that would allow the Project to begin the process of integration and development of forested areas and forage resources within an overall forest management programme. While components had been identified, they represented what were considered to be best opportunities considering the socio-economic, land use and organizational constraints. The relevance of each activity was evaluated according to local evidence and the scale of each activity was set according to the resources available for its implementation and management beyond the duration of the current project. The proposed project components were divided into priority and conditional activities. The priority components were relatively small scale and designed to set in place the conditions whereby nomad responsibility and participation was encouraged, field techniques proven, and the expertise of the Range and Pasture Administration and Forests National Corporation integrated.
The components were:
Unless there were compelling reasons to the contrary, the conditional project components would not be initiated until the priority components had been completed and the constraints that those priority components addressed had been properly resolved. It was therefore likely that the conditional components would not be implemented within the term of the project.
![]()
![]()
![]()