![]()
![]()
![]()
The analysis of the pastoral resources and development opportunities of the central highland awraja (provinces) of Menagesha and Haikoch and Butajira was part of Phase III of a long-term Assistance to Land Use Planning Project (ETH/87/006) (FAO, 1989).
Livestock production based on sheep, goats, cattle, horses and donkeys was a major activity of the two provinces and therefore was an important consideration in land use planning. The interrelationships between livestock and cropping were complex and involved factors such as land availability, use of oxen for traction and the use of crop residues as fodder. Livestock production and cropping were increasingly competing for land resources. Grazing land was reduced, the proportion of low quality crop residues had increased in the diet, and the capacity of the livestock to buffer against naturally extreme fluctuations in forage supplies was lessened. These interactions had far-reaching effects on the land resource.
The primary objective of the study was to assess and characterize the forage resources of each province, taking into account the heterogeneous patterns of vegetation cover and land use, and to relate the resources to livestock forage requirements.
Analyses of the botanical and forage production characteristics of the survey areas were designed to complement the extensive descriptions, of both the grassland and the cropping areas, previously completed by the agro-ecological section of the project. Emphasis was therefore placed on the major characteristics of the grassland, an investigation of plant associations, estimation of forage productivity and herbage quality, and description of the seasonal pattern of grassland growth.
Analyses of the forage and livestock resources were carried out using a computer-based model that integrated the complex grassland and fodder supply regimes with livestock forage requirements. The resultant information covered the following aspects of the pastoral system: livestock carrying capacity; identification of periods and extent of forage deficits; quantification of the pastoral and fodder resource; appraisal of options for development; and indications of over- or under-stocking.
Livestock carrying capacities were assessed relative to optimized energy requirements of the livestock and used estimates of the current forage resources. Forage deficits and estimations of over- or under-stocking were assessed by using "optimized" livestock regimes and current forage supplies, with livestock numbers set to current levels. Assessments of the effects of pastoral development were made by incorporating "improved forage" production scenarios into the databases representing the current regime.
The planning zone was used as the basic unit of analysis, and area information was derived from the integration of land use and cover classes and agro-ecological zone (AEZ) data (Tables 12 and 15). Livestock forage requirements were derived from the integration of basal metabolism constants, environmental adjustment factors, seasonal patterns of liveweight, the physiological state of the animal, and relative livestock numbers per breed and class. Final output of the model was converted to tropical livestock units (TLUs) to maintain compatibility with the procedures used by the Land Use Planning and Regulatory Department.
The major pasture and fodder parameters used in the model were annual DM production, monthly profiles of forage growth and quality, and management constraints. Estimates of forage production and herbage quality were made by assessing plant density and height, along with the general growing environment. The seasonal patterns of growth of the grassland forage were mainly determined from farmer and herder interviews. Forage utilization levels were generally set at estimated current levels because under the prevailing conditions it was unreasonable to expect the major changes in grazing management that would be necessary to achieve "optimized" utilization levels.
Calibration of the model primarily involved the adjustment of the overall forage resource so that it equalled the total forage intake of the livestock fed at the prevailing "non-optimized" levels. The net effect of this adjustment was to correct any errors in estimation of forage supply at the macro-level and therefore reduce errors in representation of the pastoral system. The livestock carrying capacity of a particular area was assumed to be that level of stocking at which each animal was adequately fed to meet realistic production requirements.
The Menagesha Awraja was located in the central highlands, surrounding Addis Ababa, covered an area of approximately 886 000 ha, and consisted of a heterogeneous mix of undulating plains, complex hill systems and gorges. Climates of the area varied from sub-tropical to upper temperate, reflecting an altitude range of over 2 000 m. Most of the Awraja fell within the sub-temperate zone and annual rainfall varied from less than 800 mm to approximately 1 300 mm. Cereal cropping and livestock production were the major land uses, with fuelwood forestry rapidly increasing in importance. Teff (Eragrostis tef), wheat, barley, maize and sorghum were the principal crops, and livestock comprised mainly cattle, sheep, goats, donkeys and horses.
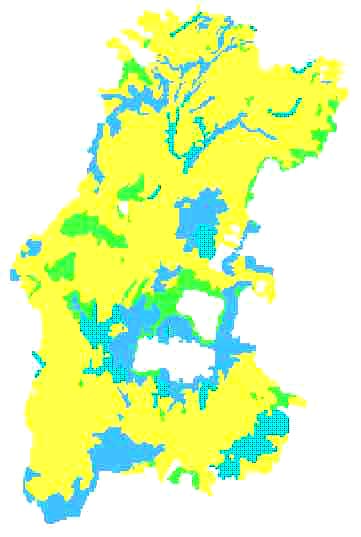
Figure 35. Distribution of predominant forage types in Menagesha (886 155 ha) |
|
Key: dark green-blue = forest |
The distribution of the predominant forage and land types is illustrated in Figure 35. Menagesha was dominated by cropland, which was evenly distributed, except in the northwestern environs of Addis Ababa and some northern-central areas. Open grasslands tended to be confined to the northern sectors, with a higher prevalence in parts of the Fuel Wood Project and in the Chancho-Holetta, Sululta, Inchini and Jida Plains. Shrub and grasslands tended to be more prevalent, relative to open grasslands, in the central and southern areas of Menagesha, whereas forests, both natural and planted, occurred in a northeastern-to southwestern distribution about Addis Ababa.
The grazing lands of Menagesha Awraja supported a diverse range of grasses, forbs, shrubs and trees. Despite having more than 200 species, a relatively small number dominated the grazing lands physiognomically. Grasses were the most abundant, accounting for approximately 52% of the total.
Analysis of the inter-AEZ distribution of plant groups indicated that grasses were more dominant in the mid-altitude zones between 2 000 m and 2 800 m. The most common grass species were Digitaria spp., Pennisetum spp. and Andropogon spp., which, overall, accounted for 22% of total species abundance. The relative abundance of forbs averaged about 20% overall, with no discernible trends in distribution between the Upper, Lower and Woina Dega zones. Trifolium spp., Thymus schimperi, Alchemilla spp. and Parochetus communis were the most abundant forbs. Shrubs and trees had an overall abundance of slightly less than 30%, with generally a higher proportional abundance in the lower-altitude Woina Dega zone (1 150 to 2 450 m) and in the highest altitude zone, the Upper Dega (2 800 to 3 391 m). The bimodal distribution of trees was characterized by a higher physiognomic occurrence of Acacia spp. in the lower zones and Juniperus spp. in the higher areas.
Analysis of the distribution of palatable species indicated a possible trend of increasing abundance in the mid-altitude zones, except within the plains. Legumes averaged 9% of total abundance, with the majority being forbs, predominantly of the genera Trifolium and Medicago. Leguminous shrubs and trees were typically acacias. The leguminous forbs were more common in the Upper and Lower Dega (2 000 to 3 400 m), whereas leguminous shrubs were more abundant in the upper Woina Dega (1 700 to 2 450 m).
An investigation of grouping of land use and cover classes according to plant species composition failed to reveal any clear pattern, while analyses of plant species associations showed that 80% of the species analysed form a single association. In contrast, the three most common grasses (Andropogon sp., Digitaria abyssinica and Pennisetum schimperi) appeared outside the main association and were not necessarily closely related to each other in occurrence.
The forage resource of Menagesha was dominated by grasses and forbs (with a minor browse component) in the grazing lands, and by residues, of many types, from the arable. Forage supply was characterized by a wide range in productivity, generally poorer herbage quality, and irregular, unpredictable growing seasons.
In the open grasslands, average production per land use and cover class ranged from 900 to 4 750 kg DM/ha, with forage of poor to medium quality (except in some of the moister open grasslands). Yields tended to be slightly higher in the Lower Dega zone (2 000 to 2 800 m), probably reflecting better temperature and rainfall regimes (Table 13).
Grazing areas within the cropped lands tended to have lower productivity and quality than the more remote grasslands because of high and continuous grazing pressures, despite higher soil fertility. Estimated average yields for those areas ranged from 1 750 to 3 000 kg DM/ha.
Hay was generally made at sites of better forage productivity and higher herbage quality, such as in the wide valley floors and low lying plains subject to seasonal flooding. Estimated yields in the hay lands ranged from 3 250 to 6 000 kg DM/ha.
Within the forested areas, primarily of the introduced Eucalyptus globulus, forage yields ranged from 50 to 2 750 kg DM/ha. Forage from the shrub component of the grazing lands was also highly variable, reflecting the species and plant densities. Yields of browse were estimated to be in the vicinity of 50 kg/ha and were, therefore a minor forage component compared to the inter-shrub grasses and forbs.
Of the major crops, sorghum gave the highest forage yields, ranging from 3 750 to 8 000 kg DM/ha. Oats, barley and wheat had similar productivity, with average yields ranging between 3 400 and 3 800 kg DM/ha, while teff averaged from 900 to 3 750 kg DM/ha. All crop residues were of low quality.
Table 12. Total area and percentage area composition of forage land types per Planning Zone, Menagesha | |||||||
Planning Zone |
Total area (ha) |
Area (percentage basis) | |||||
Cropping |
Fallow |
Inter crop grazing(1) |
Grassland grazing |
Shrub & forest |
Hay land | ||
PZ1 |
43 926 |
(45)(2) |
3 |
44 |
4 |
1 |
3 |
Menagesha total |
882 702 |
39 |
2 |
37 |
7 |
12 |
3 |
Notes: (1) Those areas between or adjacent to active cropland, excluding fallow, and classified in the "Cx" Land Use/Cover Class. (2) The proportions of cropland in parenthesis may be over-estimated | |||||||
Table 13. Estimated yields of each forage type per Planning Zone, Menagesha | |||||||
Planning Zone |
Yield (kg DM/ha) |
Conserved fodder(2) | |||||
Crop residues |
Fallow |
Inter crop grazing(1) |
Grassland grazing |
Shrub & forest |
Hay land |
||
PZ1 |
2596 |
934 |
1680 |
2800 |
1845 |
3543 |
43 |
Menagesha average |
2391 |
934 |
1594 |
2369 |
1053 |
3542 |
40 |
Notes: (1) Those areas between or adjacent to active cropland, excluding fallow, and classified under the "Cx" Land Use/Cover Class. (2) The proportion of total livestock requirements supplied from crop residues and hay. | |||||||
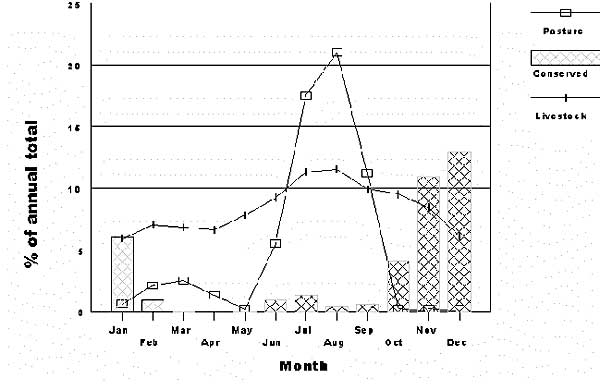
Analysis of the seasonal patterns of grassland growth in Menagesha revealed an asymmetric bimodal pattern directly related to rainfall (Figure 36). The growing season varied between five and nine months with the majority of production occurring between June and October. Forage production in the four months preceding June was generally uncertain and minor.
The majority of crop residues became available after the main harvests, which occurred between October and January. Some residues were available between June and August, but their significance depended on the belg rains.
Table 14. Herd and flock composition and average liveweight per class at current and "preferred" levels of feeding. Menagesha | |||
Livestock class |
Composition (%) |
Liveweights | |
Current |
"Preferred" | ||
Sheep | |||
lambs |
3.0 |
3 |
3 |
1 yr |
3.9 |
15 |
17 |
2 yr |
2.6 |
21 |
25 |
ewes |
3.0 |
30 |
37 |
ewes(dry) |
2.6 |
34 |
43 |
rams |
0.8 |
34 |
43 |
wethers |
0.3 |
36 |
46 |
Goats | |||
kids |
2.0 |
2 |
2 |
1 yr |
1.8 |
11 |
13 |
2 yr |
1.2 |
18 |
22 |
doe |
2.0 |
22 |
28 |
buck |
0.6 |
25 |
32 |
Cattle | |||
calves |
11.5 |
17 |
20 |
1 yr |
8.6 |
67 |
80 |
2 yr |
5.7 |
115 |
136 |
3 yr |
2.9 |
157 |
186 |
cows |
11.5 |
203 |
257 |
cows (dry) |
1.6 |
219 |
278 |
bulls |
0.5 |
287 |
364 |
oxen |
15.9 |
287 |
364 |
old |
1.0 |
287 |
364 |
Donkeys | |||
foals |
1.6 |
17 |
19 |
1 yr |
1.5 |
61 |
72 |
2 yr |
1.4 |
86 |
102 |
3 yr |
1.4 |
118 |
140 |
hinnies |
1.6 |
126 |
161 |
asses |
2.0 |
126 |
161 |
Mules | |||
foals |
0.2 |
27 |
32 |
1 yr |
0.2 |
128 |
151 |
2 yr |
0.2 |
230 |
271 |
3 yr |
0.2 |
354 |
419 |
mares |
0.2 |
380 |
482 |
stallions |
0.2 |
380 |
482 |
Horses | |||
foals |
0.9 |
27 |
32 |
1 yr |
0.7 |
128 |
151 |
2 yr |
0.5 |
229 |
272 |
3 yr |
0.5 |
354 |
419 |
mares |
0.9 |
380 |
482 |
stallions |
0.7 |
380 |
482 |
Source: Based on field estimates, livestock census data and modified Socio-Economic Section (LUPRD) livestock composition data. | |||
All livestock suffered significant liveweight losses during the dry season. Most losses occurred between October and May, with far-reaching effects on all aspects of livestock productivity. The potential period of liveweight gains was restricted to a few months of the year, during the main herbage growth season. Average liveweights of livestock were estimated to be 80% of that considered optima (Table 14).
The overall percentage herd composition was sheep - 18.2%; goats - 7.6%; cattle - 59.2%; donkeys - 9.5%; mules - 1.2%; and horses - 4.3%. Cattle occurred in densities up to about 2.4 head/ha, with the higher concentrations in western Menagesha, in a central-northeastern belt extending from Addis Ababa, and on the Sendafa Plain. Sheep occurred at densities up to 2.2 head/ha and were prevalent in the Chancho-Holetta Plain and, especially, in northeastern Menagesha. In contrast, goats were more populous in northwestern and southern Menagesha, with densities reaching 0.45 head/ha. Distribution of horses, mules and donkeys, as a group, was heterogeneous, with higher concentrations, up to 0.62 head/ha, in southern Menagesha, especially the Tefki plain, and in the northeast, including the Sululta and Jida Plains.
The outstanding feature of livestock management in Menagesha was its sedentary nature and focus on the use of the croplands and their immediate environs. Mixed livestock grazed the inter-cropland grazing areas continuously, which led to a depression of forage production. In most areas, livestock management focused on the year-round use of the lower valley slopes and some inter-cropland areas. Flooding between July and September, and the often concurrent closing of hay lands, forced grazing up-slope. Arable was generally available for grazing from October to January. In Menagesha, the location of watering points did not affect management practices significantly.
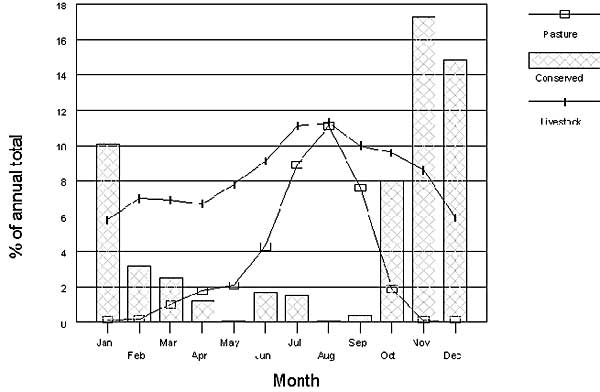
Figure 36. Forage supply and demand, Menagesha
|
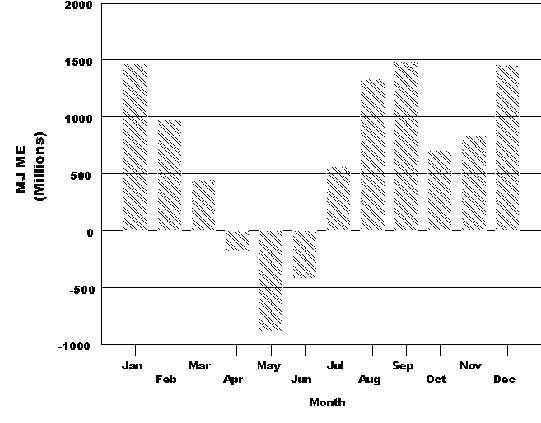
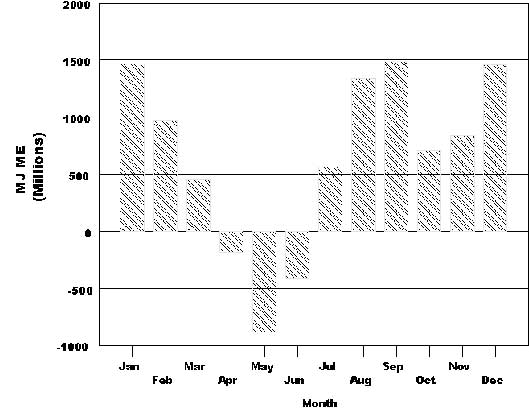
Figure 37. Monthly forage balance relative to optimal livestock feeding levels, Menagesha
|
The forage supply of Menagesha was classified into six distinctive groups according to forage type and agro-ecology. The groups were inter-cropland grazing, open grazing, shrub and forest grazing, hay land, cropland and fallow land. The inter-cropland and open grazing areas marginally predominated, accounting for approximately 44% of the total area of Menagesha. Croplands occupied about 38%; shrub and forest grazing areas, 12%; and the fodder land and fallow areas, 3% and 2% respectively. Generally, the areas of more intensive cropping - and therefore prevalence of crop residues - were found in the Inchini, Tefki and Sendafa Plains, plus the City Extension. Higher proportions of grassland, shrub land and hay land were found in the Jida and Sululta Plains.
Aggregation of the components of the adjusted forage supply showed that highest yields of forage DM were from the hay lands, which averaged 3 500 kg/ha. Production from the croplands (residues of low quality) and grazing lands averaged about 2 400 kg/ha; inter-cropland grazing, 1 600 kg/ha; shrub and forest area, 1 100 kg/ha; and fallow lands, 900 kg/ha. The analysis showed that crop residues and, to a much lesser extent, hay together accounted for 40% of the total livestock energy requirements. The relationship between forage supply (both grazed in situ and conserved) and livestock forage intake is illustrated in Figure 36. In a normal rainfall year, grazeable forage growth exceeded livestock requirements for about three months of the year. During the rest of the year the supply was made up of carry-over of the kremt surplus and large supplies of crop residues and hay.
Forage deficits were a regular feature of livestock production in Menagesha Awraja. The main causes were an irregular and often restricted growing season, chronic reductions in grazing land, predominance of grazing lands with poor quality species, and a reliance on low quality crop residues during the dry season. Forage deficits normally occurred during seven to nine months of the year, beginning in January, reaching a peak around May, and ending during September. Extension of the deficit into the main forage growth season was brought about by the depletion of crop residues; exclusion of livestock from some cropland and inter-cropland grazing areas; and the seasonal flooding of the more productive, low lying, grazing lands.
From a forage energy supply viewpoint (ignoring serious forage quality limitations), deficits occurred during April, May and June, with a pronounced peak, amounting to 9% of total requirement, in May (Figure 37). During a normal forage growth year, the overall deficit was between 15 and 20%, with considerable local variations in the patterns of forage balance, reflecting the variability in forage resource and livestock densities.
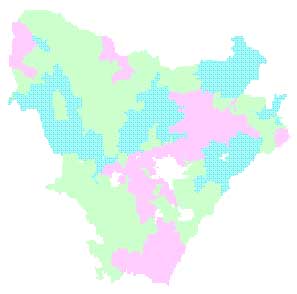
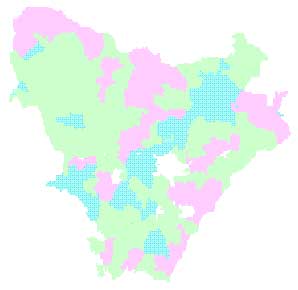
Analyses indicated that the livestock carrying capacity of Menagesha, during a "normal" year of forage production would be in the order of 740 000 TLU, or 0.85 TLU/ha. Accepting current estimates of livestock population, the results indicated that under-feeding of livestock averaged about 18%. This highlighted the serious circumstances of the livestock industry in Menagesha, a condition that was worsening as afforestation programmes were implemented and cropping encroached on the grazing land. The highest carrying capacities (Figure 38) were recorded in the Shino Upland, and the Jida, Sendafa and Sululta Plains, reflecting high productivity of both crops and grazing; the lowest were recorded in the Lemen Upland, Gorges and Fuel Wood Project Area. The highest grazing pressures (ratio of livestock to available forage, Figure 39), indicating overstocking, occurred in a southwest to northeast belt crossing the northern Tefki Plain and Fuel Wood Projects Area.
Figure 38. Livestock carrying capacity, Mengesha
|
Key: Dark green = >0.75 TLU/ha; pink = 0.75 - 0.92 TLU/ha; light green = <0.75 TLU/ha |
Figure 39. Livestock grazing pressure, Mengesha
|
Key: Dark green = high grazing pressure; pink = moderate; light green = low grazing pressure |
The Haikoch and Butajira Awraja was a gently sloping escarpment of the Rift Valley, located on the edge of the central highlands, and covering an area of approximately 1 177 000 ha. Topography varied from steep mountains and hills, mainly in the northwestern and southeastern sectors, to flat or undulating plains, particularly in the east and southwest. The climate varied from sub-tropical to temperate. Major land uses were cereal growing and livestock rearing. Maize, teff, wheat, barley, oats and sorghum were the main crops, although ensete (Ensete ventricosum) was common in the western hills. Livestock were mainly cattle, sheep, goats, donkeys and horses, with a seasonal influx of camels.
Haikoch and Butajira was dominated by arable land, comprising a mix of open cropland and crop enclaves in association with bush and woodland. The crop-lands were fairly evenly distributed throughout the Awraja, except for the Haikoch Plain in the vicinity of the lakes in the central eastern sector. Open grasslands were confined to localized areas, particularly in the western sector, including the Koshe Plain and Wilbareg Upland. Minor areas were located north and west of Lake Abiata on the Haikoch Plain. Forests occurred immediately west of Lake Shalla, at the interface of the Haikoch Plain, Alaba Plain and Koshe Plain, and in the steeper hills and mountain range of the southeast, the Negele foot slopes. Some localized riverine forest was found in the northern central sector of the Koshe Plain.
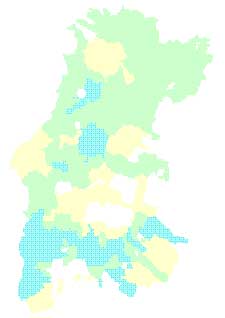
The distribution of the predominant forage and land types is illustrated in Figure 40.
Figure 40. Distribution of predominant vegetation types in Haikoch and Butajira (1 177 248 ha)
|
Key: dark blue-green = forest; medium dark blue = predominantly open grassland; medium light green = predominantly shrub/grassland; light yellow = predominantly cropping |
While the grazing lands of Haikoch and Butajira were relatively diverse in their range of grasses, forbs, shrubs and trees, they were generally characterized by the physiognomic dominance of trees and shrubs, particularly species of Acacia, Balanites and Carissa. Thirty six species accounted for 74% of all plants. Of these species, 61% were trees and shrubs, 31% grasses and 8% forbs.
Grasses were found to be most abundant in the Woina Dega zones (1 700 to 2 800 m altitude and 600 to 1 200 mm annual rainfall), compared to the other major group of zones, the Moist Kolla (1 600 to 2 250 m and 600 to 1 100 mm). The average percentage abundance of grasses in these zones was about 42% and 25%, consisting mainly of Cynodon dactylon, Pennisetum schimperi, Digitaria abyssinica, Hyparrhenia hirta and Eragrostis sp. Forbs were more dominant in the Moist Kolla and Semi-arid Kolla zones than other areas, with an average of 17% and 6% respectively. The three commonest forbs were Euphorbia abyssinica, Hypoestes verticilaris and Solanum sp.
Trends in the occurrence of shrubs and trees appeared to be the reciprocal of grasses. Trees tended to be more abundant in the higher altitude and moister areas comprising the Dega Mountain and Lower Dega (2 200 to 3 600 m and 800 to 1 300 mm) and in the lowest zones, comprising the Moist Kolla and Semi-arid Kolla (1 600 to 2 250 m and 500 to 1 100 mm). The higher zones were typically forests or forest remnants of Podocarpus gracilior and Juniperus spp. In the lower zones, Acacia spp., Carissa edulis and Balanites aegiptica were common species of the woods and shrub lands.
Palatable plants averaged between 60 and 80% of the total plant species and showed no distinct trends between AEZs. The legume component of the Haikoch and Butajira grazing lands averaged about 13% relative abundance, with almost all of that being accounted for by leguminous trees and shrubs, particularly acacias. Leguminous forbs were only recorded in the higher altitude undulating areas and steep lands, and were solely Trifolium spp. The low occurrence of leguminous forbs may be a reflection of the timing of the botanical survey.
An investigation of grouping of land use and cover classes according to plant species composition revealed two tentative groupings of sites of similar botanical composition. These were the grassland and forest land use and cover classes located on plains of some of the Woina Dega and Moist Kolla AEZs, and the same classes covering a range of upland and plains of the Woina Dega and Moist Kolla AEZs. The analysis confirmed the heterogeneous nature of the vegetation and hence the lack of a clear delineation between AEZs. An analysis of the most abundant plants showed that, as for Menagesha, most species formed a single, large plant association. Furthermore, the "independent" species Cynodon dactylon, Pennisetum schimperi, Acacia etbaica, Carissa edulis and Acacia tortilis were also among the most abundant.
Forage supply in Haikoch and Butajira comprised grasses and forbs, with a variable browse component in the grazing lands, and residues, mainly of maize and teff, from the croplands. As in Menagesha, the overall forage supply ranged widely in productivity, was generally of poor dietary quality, and had irregular, unpredictable growing seasons. While the croplands appeared to be of relatively high productivity, the grazing lands were in poor condition and with decreasing plant cover.
Crop residue production ranged between approximately 3 300 and 4 800 kg DM/ha, with highest production in the Lower Dega (2 200 to 3 200 m altitude and 800 to 1 200 mm annual rainfall) and least in the semi-arid Kolla (1 600 to 2 200 m and 500 to 1 000 mm), reflecting rainfall and temperature influences. Crop residue production in Haikoch and Butajira was significantly higher than for Menagesha because of the higher proportion of high-yielding maize. Inter-cropland grazing areas were estimated to produce between 1 400 and 2 000 kg DM/ha and the grasslands, including the grass-forb components of bush and wood lands, yielded between 1 400 and 1 800 kg DM/ha. The productivity of these areas was relatively low because those areas remaining as grazing lands were often sites of more severely limiting fertility and soil moisture. Under those conditions, and with increasing grazing pressures, plant cover was low, forage productivity limited, and herbage quality was poor.
Table 15. Total area and percentage area composition of forage land types by Planning Zone in Haikoch and Butajira | ||||||
Planning Zone |
Total area (ha) |
Area (%) | ||||
Cropping |
Fallow |
Inter-crop grazing(1) |
Grassland grazing |
Shrub- and woodlands | ||
PZ1 |
50 148 |
42.0 |
2.1 |
17.0 |
9.5 |
29.3 |
PZ2 |
31 659 |
56.0 |
2.7 |
26.3 |
2.5 |
12.6 |
PZ3 |
79 297 |
48.7 |
2.3 |
17.4 |
4.1 |
27.4 |
PZ4 |
68 845 |
49.4 |
2.5 |
19.7 |
9.2 |
19.3 |
PZ5 |
105 631 |
43.8 |
2.3 |
9.7 |
2.3 |
42.0 |
PZ6 |
226 405 |
56.4 |
2.9 |
8.2 |
6.9 |
25.6 |
PZ7 |
152 858 |
54.5 |
2.6 |
6.9 |
2.2 |
33.8 |
PZ8 |
144 403 |
54.7 |
2.6 |
9.3 |
6.4 |
27.1 |
PZ9 |
163 925 |
21.4 |
1.1 |
3.2 |
13.8 |
60.5 |
Overall |
1 023 166 |
47.2 |
2.4 |
10.0 |
6.7 |
33.8 |
Notes: (1) Those areas between or adjacent to active cropland, excluding fallow, and classified in the "Cx" Land Use/Cover Class. | ||||||
Table 16. Estimated yields of each forage type by Planning Zone in Haikoch and Butajira | ||||||
Planning Zone |
Yield (kg DM/ha) |
Conserved fodder (%) | ||||
Crop residues |
Fallow |
Inter-crop grazing(1) |
Grassland grazing |
Shrub- and woodlands |
||
PZ1 |
4116 |
903 |
1969 |
1493 |
1685 |
59 |
PZ2 |
3409 |
741 |
1641 |
1254 |
1299 |
65 |
PZ3 |
3443 |
744 |
1606 |
1453 |
1525 |
60 |
PZ4 |
3498 |
789 |
1577 |
1337 |
1385 |
70 |
PZ5 |
4854 |
1102 |
2243 |
1574 |
838 |
69 |
PZ6 |
4004 |
912 |
1829 |
1479 |
1530 |
70 |
PZ7 |
4290 |
1103 |
1874 |
1684 |
1714 |
67 |
PZ8 |
3525 |
912 |
1534 |
1515 |
1590 |
65 |
PZ9 |
3980 |
1057 |
1692 |
1801 |
1779 |
31 |
Overall |
3957 |
949 |
1762 |
1588 |
1545 |
61 |
Notes: (1) Those areas between or adjacent to active cropland, excluding fallow, and classified under the "Cx" land Use/Cover Class. | ||||||
Despite their high abundance, palatable shrubs did not contribute significantly to the regular forage supply because their foliage tended to be out of normal reach of livestock. The browse component of the shrub- and woodlands was estimated to be between about 50 and 525 kg DM/ha within the strata accessible to livestock (excluding camels). It was inferred that within Haikoch and Butajira the contribution of browse relative to grass and forb species was minimal during normal years. Forage yields from within forests were similarly low, between zero and 800 kg DM/ha (Table 16).
Hay production was seen in some relatively localized areas but was not an important forage source, in contrast to Menagesha.
Two patterns of "normal" year grassland production were identified within Haikoch and Butajira. Within the Woina Dega and Lower Dega zones the forage production profile was similar to that for Menagesha, namely an asymmetrical bimodal growth profile corresponding to the occurrence of the belg and kremt rains, and with a growing period ranging from six to ten months. In the lower-altitude zones, where annual rainfall was generally less, the growth profile was more distinctly unimodal, without any depression of growth around May, and lasting for a period of nine to ten months. Farmers subjectively assessed the belg pasture growth (January to May) as normally never amounting to more than 10 to 15% of total annual production. Figure 41 shows the seasonal pattern of forage production.
About 80% of the crop residues became available after the harvest of the kremt crops between October and January. Minor supplies of residues also became available between March and September. However, the significance of these residues, particularly for the latter months, was highly dependant on the belg rain and associated cropping programmes.
Table 17. Herd and flock composition and average liveweights per class at current and "preferred" feeding levels in Haikoch and Butajira | |||
Livestock class |
Composition (%) |
Liveweights | |
Current |
"Preferred" | ||
Sheep | |||
lambs |
3.1 |
2 |
3 |
1 yr |
0.6 |
14 |
17 |
2 yr |
0.4 |
20 |
25 |
ewes |
3.1 |
28 |
37 |
ewes (dry) |
1.0 |
32 |
43 |
rams |
0.6 |
32 |
43 |
wethers |
0.4 |
34 |
46 |
Goats | |||
kids |
7.0 |
2 |
2 |
1 yr |
2.0 |
10 |
13 |
2 yr |
1.3 |
17 |
22 |
doe |
7.0 |
21 |
28 |
doe (dry) |
2.1 |
24 |
32 |
buck |
0.9 |
24 |
32 |
buck (castrated) |
0.9 |
26 |
35 |
Cattle | |||
calves |
13.7 |
16 |
20 |
1 yr |
11.3 |
64 |
80 |
2 yr |
7.4 |
109 |
136 |
3 yr |
3.7 |
149 |
186 |
cows |
13.7 |
192 |
257 |
cows (dry) |
2.3 |
207 |
278 |
bulls |
1.1 |
271 |
364 |
oxen |
9.9 |
271 |
364 |
Donkeys | |||
foals |
0.8 |
16 |
19 |
1 yr |
0.6 |
57 |
72 |
2 yr |
0.4 |
81 |
102 |
3 yr |
0.3 |
112 |
140 |
hinnies |
0.8 |
119 |
161 |
asses |
0.6 |
119 |
161 |
Mules | |||
foals |
0.1 |
25 |
32 |
1 yr |
0.1 |
121 |
151 |
2 yr |
0.1 |
217 |
271 |
3 yr |
0.1 |
335 |
419 |
mares |
0.1 |
359 |
482 |
stallions |
0.1 |
359 |
482 |
Horses | |||
foals |
0.3 |
25 |
32 |
1 yr |
0.3 |
121 |
151 |
2 yr |
0.3 |
217 |
272 |
3 yr |
0.2 |
335 |
419 |
mares |
0.2 |
359 |
482 |
stallions |
0.2 |
359 |
482 |
Source: Based on field estimates, livestock census data and modified Socio-Economic Section (LUPRD) livestock composition data. | |||
Assessments of livestock condition indicated that liveweights during the dry season were less than for equivalent animals in Menagesha (Table 17). This corroborated the extent of the forage deficits and periods of under-feeding as described by the farmers and herders, although there was evidence that disease, mineral deficiencies and energy expenses of watering at distant sites contributed to the poor condition.
Approximate percentage compositions were: sheep - 9%; goats - 21%; cattle- 63%; donkeys - 4%; mules - 1%; and horses - 2%. Generally, all livestock types were found throughout Haikoch and Butajira, but the distribution was distinctively uneven. Cattle occurred in densities from less than 0.2 head/ha to about 6.9 head/ha, and were at higher concentrations on the southern Haikoch Plain, Alaba Plain, southern Negele foot slopes, and the interface of the Buki Upland, Gurage Mountains and Koshe Plain. Sheep showed a more broken distribution compared to the other livestock types, but their overall distribution was similar to cattle. Densities ranged up to about 1.2 head/ha. Sheep were more prevalent in the southern Alaba Plain, Negele foot slopes and in the Gurage Mountains and Koshe Plain. Goats ranged in densities up to 3.83 head/ha, and most were located in the southern and eastern-central sectors, mainly on the Alaba and Haikoch Plains. Horses, donkeys and mules, as a group, were mainly located in the southern plains of Haikoch and Butajira, specifically the Alaba Plain and southern Haikoch Plain. Equine densities ranged up to 0.4 head/ha.
Patterns of livestock management within Haikoch and Butajira were more complex than for Menagesha, but the system was similarly based on forage associated with crop production, and grazing of grassland and shrub lands in areas adjacent to the croplands. Generally, livestock in the higher altitude undulating or hill lands in western and southeastern sectors were subject to a mainly sedentary livestock management pattern, whereas in the lower, drier plains there were some seasonal migrations in combination with sedentary management. In these areas, water shortages were increasingly significant. Grazing patterns were primarily governed by the cycles of availability of the croplands for grazing and the supply of livestock water. The inter-cropland areas and local grazing lands were used to varying degrees throughout the year. The local grazing area expanded to include the croplands between December and the end of February, with occasional access extending from October through to April. During the main crop growing season of April to November, restricted grazing land and higher livestock forage requirements frequently forced livestock onto adjacent hill slopes and shrub lands and, in extreme cases, to more distant grazing lands.
The use of "non-local" grazing lands involved both movement of herds within Haikoch and Butajira and also the incursion of livestock from other Awrajas. Intra-Haikoch and Butajira movements, particularly of cattle, were most likely to occur during the period of local grazing land shortage - May to August - and the period of zero forage growth - December to February. The movements have also been associated with a lack of local watering points. This kind of movement was more common in the plains areas of the eastern and southern sectors and conditional on having grazing rights in other areas. Camels, cattle and goats from Yerer, Kereyu and Sidamu were frequently brought into the southern and eastern plains of Haikoch and Butajira. The timing and duration of their presence depended on the relative abundance of forage at the particular time.
The forage supply of Haikoch and Butajira was classified into the same five groups as identified for Menagesha: inter-cropland grazing, open grassland grazing, shrub- and woodland grazing, crop land, and fallow land. Approximately half of Haikoch and Butajira was active cropland, with the remaining areas a heterogeneous mix of land types used for grazing or browsing. The second most common forage group, the shrub- and woodland grazing areas, accounted for about 34% of land area and the inter-cropland grazing lands accounted for 10%, while open grasslands occupied 7% of the total area. Crop residues were most significant as a forage source in the Gibiso Upland, Koshe Plain, Alaba Plain and the Zwai Plain. The only area that could be considered predominantly pastoral was the Haikoch Plain, with about 74% grass and shrub- and woodlands.
Aggregated forage production estimates indicated that highest yields were from croplands, in the form of low quality crop residues yielding between 3 400 and 4 800 kg DM/ha. On average, the inter-cropland grazing areas, open grasslands and shrub- and woodlands produced between 840 and 2 250 kg DM/ha. Crop residues accounted for about 61% of the total livestock energy requirements. The analyses revealed that livestock depended on year-round crop residue supplies because grass and shrub- and woodland grazing never exceeded livestock needs. Surpluses of crop residues mainly occurred between November and January, and reduced gradually as the dry season progressed. The relationship between forage supply (areas grazed in situ and conserved forage) and livestock forage intake is illustrated in Figure 41.
Forage deficits were a regular feature of pastoral production systems in Haikoch and Butajira (Figure 42). The main causes were as for Menagesha: an irregular growing season, chronic reductions in grazing land, predominance of grazing on low quality species, and a reliance on low-quality crop residues during the dry season. Forage deficits occurred at any time of the year. This indicated that the forage situation was more serious in Haikoch and Butajira compared to Menagesha. Deficits normally peaked around March and were at a minimum about August and September.
Figure 41. Profile of forage supply and livestock demand, Haikoch and Butajira
|
Figure 42. Monthly forage balance relative to optimal livestock feeding levels, Haikoch and Butajira
|
There appeared to be lower carrying capacities in the higher altitude areas: the Dega Mountain and Lower Dega zones (2 200 to 3 600 m altitude) compared to the rest of the survey area. However there was no distinct difference between the Woina Dega, Moist Kolla and Semi-Arid Kolla zones, which extended from 1 600 to 2 800 m (Figure 43). The highest grazing pressures, indicating overstocking, occurred in the southern and southeastern sectors: parts of the Alaba Plain, the Negele foot slopes, and Haikoch Plain (Figure 44).
As for Menagesha, the areas identified as being overgrazed needed further study to confirm the grazing pressure estimates and, if warranted, be given priority in a forage development programme.
Figure 43. Livestock carrying capacities, Haikoch and Butajira
|
Key: dark blue-green = >1.25 TLU/ha; |
Figure 44. Livestock grazing pressure, Haikoch and Butajira
|
Key: dark blue-green = high grazing pressure; |
The analyses of the livestock and forage resources of Menagesha and Haikoch and Butajira confirmed the widespread and extreme nature of forage deficits, both in yield and quality, even in a "normal" forage production year. Livestock numbers were generally near the maximum possible and therefore were regulated by the fluctuations in forage supply. Animal productivity was characteristically low, with high susceptibility to diseases. The chronic encroachment of the croplands into the traditional grazing areas compounded this problem.
The general condition of livestock in the areas surveyed clearly showed that forage development options would have to be directed towards mitigating the normal forage deficits and increasing per-animal productivity while at the same time discouraging the tendency for increasing livestock numbers to the maximum.
During the assessment of forage development, priority was given to those techniques having relevance and acceptability. In this context, emphasis was placed on the testing of those techniques for which there was already local experience and demonstrated potential. For the majority of farmers, simple, low-cost improvements in forage production compatible with their knowledge and traditional practices were required.
In recent years, localized areas of development had confirmed that significant increases in forage and livestock production were possible. The strategies promoted included backyard forage production, undersowing and inter-planting, forage strip establishment, over-sowing legumes on grazing areas, permanent grass-legume pasture establishment, improved forages in livestock exclusion areas, and fodder crop production.
Within the context of this study, attention was primarily directed at those techniques that would address the overall forage shortage. The factors taken into consideration in appraising development options included low cost, simple technology, compatibility with traditional farming and livestock practices, no use of fertilizer, compatibility with present and projected trends in land use, compatibility with social and cultural constraints, scale of applicability, and current evidence of suitability of the technique.
Eleven options for forage or livestock development were selected for evaluation: undersowing of tall cereal crops; improvement of crop residue quality; improvement of hay lands; establishment of forage tree plantations; establishment of fodder banks (controlled-use grass-legume areas); general over-sowing; development of agroforestry; establishment of forage reserves; grazing management; reduction in livestock numbers; and improvement of herd and flock production efficiency.
Of these techniques, the following were identified as being most practical or relevant in the medium term:
The first five options were used in an assessment of the impact of forage development within Menagesha and Haikoch and Butajira. The exclusion of other development options, particularly agroforestry and creation of forage reserves, in no way implied a lesser importance; simply that parameters for the estimation of their impact were less certain. For similar reasons, the options were considered solely from a livestock production viewpoint, so crop interventions, such as better varieties, improved management and the use of fertilizer, were not directly considered.
Forage production estimates for each of the development options were made on the basis of realistic targets achievable in the medium term (5 to 12 years) and assuming methods indicated as practicable by ongoing forage and livestock programmes. The estimates were conditional on livestock management requirements being met. Under these conditions, the targets described were below the potential of the land resource but were nevertheless more realistic.
Forage parameters used in the appraisal of development options in Menagesha and Haikoch and Butajira are presented in Table 18.
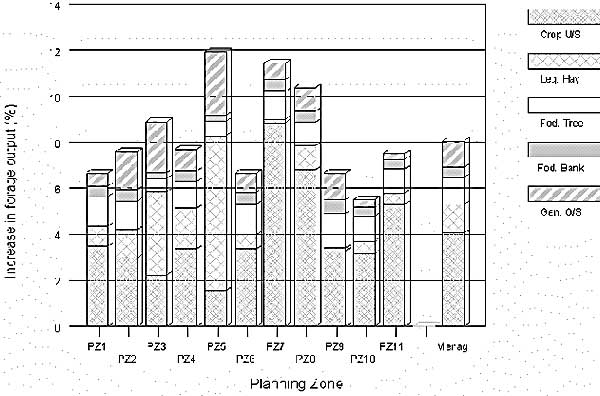
For Menagesha, the analyses indicated a potential 8% increase in forage production. Approximately half was from cereal undersowing, whereas hay land improvement, fodder trees, forage banks and general over-sowing would each contribute 1.26%, 1.17%, 0.45% and 1.14% respectively. There was considerable variation in the effect of each forage development type between planning zones, reflecting differences in the proportions of land type and of land use. Details of the incremental forage production due to the five development options within the eleven planning zones of Menagesha are presented in Figure 45.
Table 18. Forage parameters used in the appraisal of development options in Menagesha and Haikoch and Butajira | |||||||||||
Forage Development Type |
Area |
Utilization |
Av. Inc. Yield(1) |
Current |
% Change in Yield(2) | ||||||
(ha) |
(%) |
(%) |
(kg DM/ha) |
||||||||
Menagesha | |||||||||||
Undersowing of tall cereal crops | |||||||||||
Maize |
5 |
85 |
2 250 |
2 391 |
+94 | ||||||
Sorghum |
10 |
85 |
2 750 |
>2 391 |
+115 | ||||||
Legume introduction into hayland |
|
|
|
|
| ||||||
Normal |
30 |
80 |
1 250 |
>3 543 |
+35 | ||||||
Intensive |
70 |
32 |
2 000 |
>3 543 |
+56 | ||||||
Fodder trees |
4 127 |
1 |
90 |
3 750 |
1 594 |
+235 | |||||
Fodder bank |
3 930 |
1 |
70 |
1 906 |
1 594 |
+120 | |||||
General over-sowing |
20 000 |
30 |
85 |
500 |
2 369 |
+21 | |||||
Haikoch and Butajira | |||||||||||
Under-sowing of tall cereal crops |
20 |
85 |
3 000 |
3 957 |
+76 | ||||||
Fodder trees |
7 163 |
7 |
90 |
3 750 |
1 762 |
+213 | |||||
Fodder bank |
4 775 |
5 |
70 |
1 738 |
1 762 |
+99 | |||||
General over-sowing |
34 000 |
50 |
85 |
300 |
1 588 |
+19 | |||||
Notes: (1) Average incremental yield.
(2) Percent increment in yield relative to current estimated production | |||||||||||
Figure 45. Estimated increases in forage supply following five development options, Menagesha
|
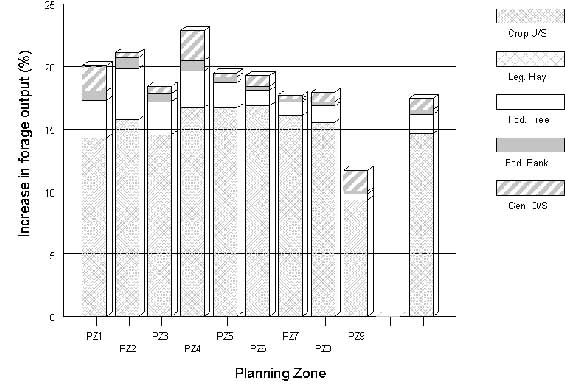
Figure 46. Estimated increases in forage supply following five development options, Haikoch and Butajira
|
The highest proportional increments from crop undersowing were likely in the Lemen Upland and Tefki Plain, where there was more sorghum, whereas for areas such as the Sululta Plain, which had significant hay lands, the major benefit might be from legume introduction. General over-sowing would benefit areas with the highest proportions of open grasslands, such as the Chancho-Holetta, Jida and Sululta Plains.
The forecast increases in forage supply for Haikoch and Butajira were different in character to those for Menagesha because of the predominance of maize and sorghum cultivation and the potential from crop undersowing. Overall, a 17% increase in forage production would be possible in the medium term, of which 84% would be due to crop undersowing. Details of the incremental forage production resulting from each of the five development options, within each of the nine planning zones of Haikoch and Butajira, are presented in Figure 46.
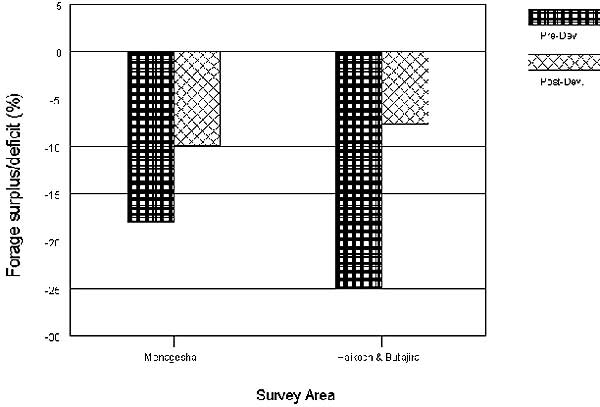
Analyses showed that undersowing of cereals was the most promising development technique for both provinces. This reflected the high proportions of arable and the potential increments in forage yield and forage quality. Despite the potential impact of the technique, levels of risk and uncertainty meant it could not be given priority over the others. It was more prudent, and offered greater long-term security, to exploit all development interventions, since the potential contribution of each varied considerably between locations. Furthermore, their relative contribution would change as managerial skills and farmer confidence increased. The medium-term impact on the forage deficit of the proposed development programmes was shown to be significant. However the forecasts indicated that the deficits would continue into the longer term (more than ten years), especially if farmers increased livestock numbers prematurely.
The net changes in forage deficit following "medium-term" forage development in Menagesha and Haikoch and Butajira are illustrated in Figure 47.
Figure 47. Net changes in forage deficits following "medium-term" forage development, Menagesha and Haikoch and Butajira
|
![]()
![]()
![]()