FIGURE 1
Soil Degradation: Africa (GLASOD)
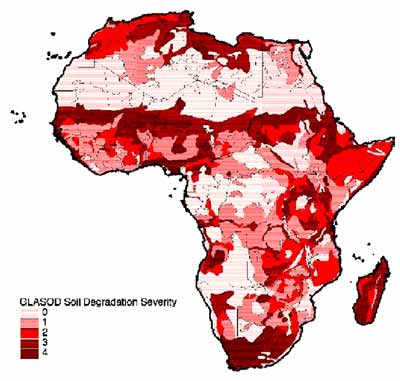
FIGURE 2
False Elevation Representation of Average Windspeed
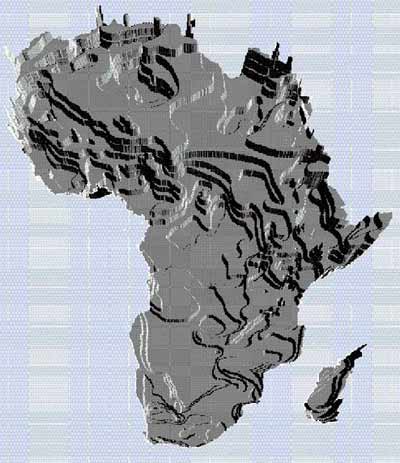
FIGURE 3
Illiteracy Rates: Africa
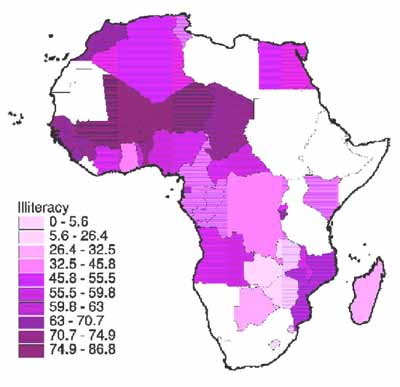
FIGURE 4
Percent Change in Terms of Trade: Africa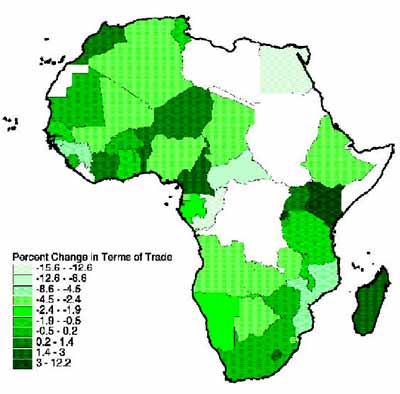
FIGURE 8
Wind and Soil DEgradation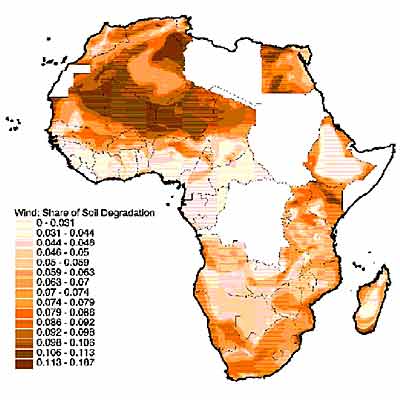
FIGURE 9
Wind and Soil Degradation: Closeup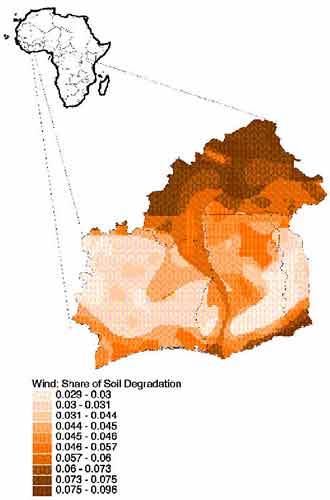
FIGURE 10
Terms of Trade and Soil Degradation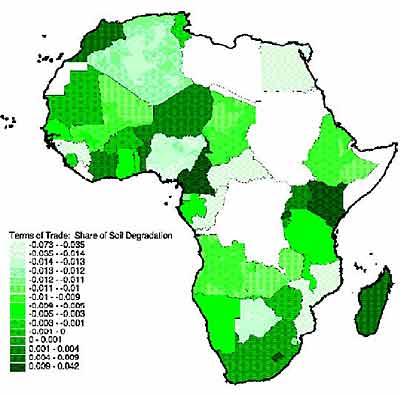
FIGURE 11
Soil Degaradation and Per Capita Income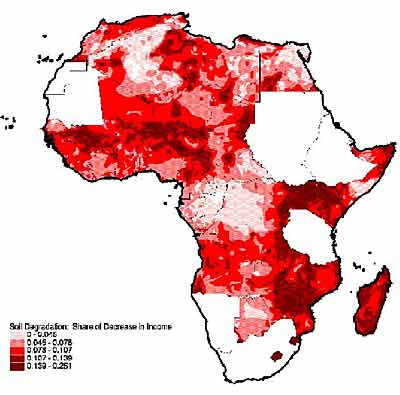
FIGURE 12
Illiteracy and Decreases in Per Capita Income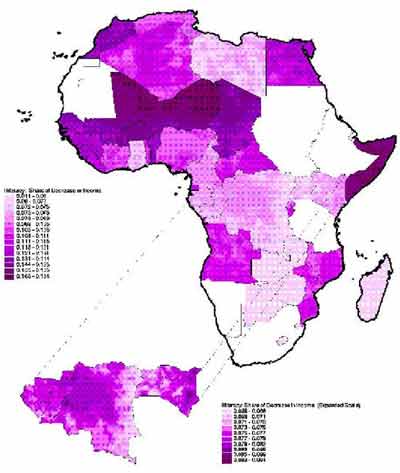
FIGURE 13
Soil Degradation and Decreases in Per Capita Income: Closeup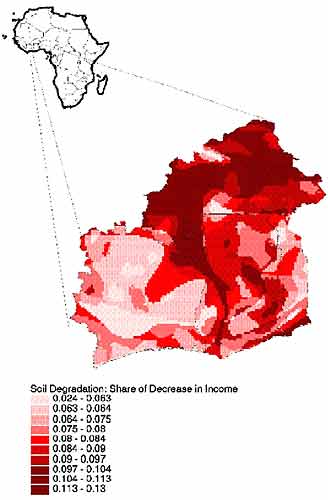
FIGURE 14
Illiteracy and Decreases in Per Capita Income: Closeup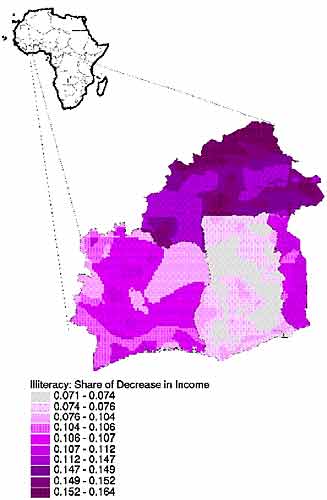
FIGURE 15
Ghana: Soil Degradation (GLASOD)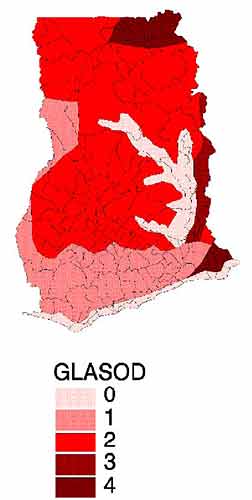
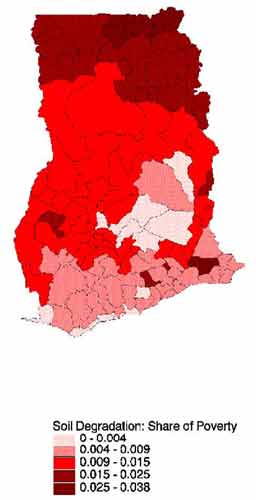
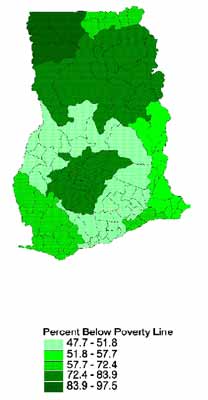
FIGURE 16
Soil Degradation and Poverty