![]()
![]()
![]()
Criteria and indicators
Forest management plans
Certification
Comparison with previous estimates
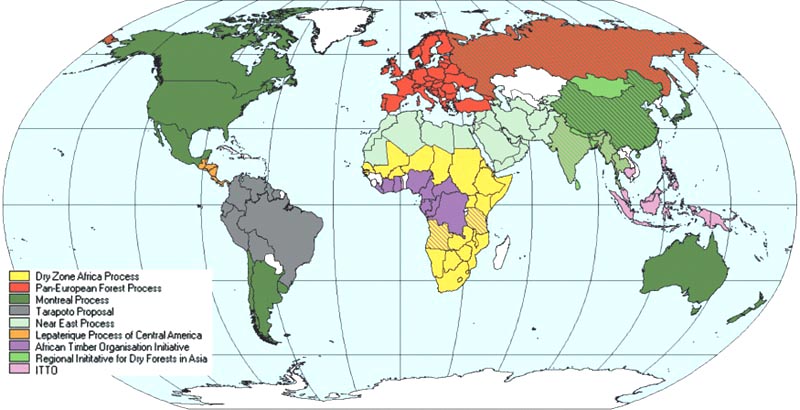
At the end of December 2000, 149 countries were members of one or more of the following nine initiatives: the Pan-European, Montreal, Tarapoto, Dry-Zone Africa, Near East, Central America/Lepaterique and Dry-Forest Asia processes and/or initiatives, and action taken by ITTO and the African Timber Organization (ATO).[10] Refer to Table 1 for a regional overview and to Table 3 in the Appendix for details. Figure 1 illustrates the geographical coverage of the nine processes.
These initiatives and processes are conceptually similar in objectives and overall approach, although differing in detail. National-level criteria of sustainable forest management focus on the following globally agreed elements: extent of forest resources; biological diversity; forest health and vitality; productive functions of forests; protective functions of forests; socio-economic benefits and needs; legal, policy and institutional framework. The indicators vary widely among initiatives owing to differences in forest types and environmental, social, political and cultural conditions.
Figure 1. Geographical coverage of nine criteria and indicator processes
National-level criteria and indicators are being complemented by the development and implementation of criteria and indicators defined at the forest management unit level in a number of the processes as well as by other actors such as NGOs and the private sector.
Table 1. Regional overview of number of countries involved in criteria and indicator processes
|
Region |
Number of countries/areas |
International/ecoregional processes |
|
|
Total number reported in FRA 2000 |
Member of one or more criteria and indicators processes |
||
|
Africa |
56 |
46 |
Near East, Dry Zone Africa, ATO, ITTO |
|
Asia |
49 |
36 |
Near East, Dry-Forest Asia, ITTO, Montreal, Pan-European |
|
Oceania |
20 |
5 |
Montreal, ITTO |
|
Europe |
41 |
40 |
Pan-European, Montreal, Near East |
|
North and Central America |
34 |
11 |
Lepaterique; Montreal, ITTO |
|
South America |
14 |
11 |
Tarapoto, ITTO, Montreal |
|
WORLD TOTAL |
213 |
149* |
|
* Includes four countries being invited to join the Pan-European process as of December 2000 (Bosnia Herzegovina, Georgia, San Marino and Yugoslavia). Belgium and Luxembourg are counted as two countries in this table although reported on jointly in the main table.The degree of implementation of criteria and indicators at the national level varies considerably. In many cases, action is limited by the lack of trained personnel or institutional capacity for collecting and analysing information and for following up the development and implementation of improved management prescriptions based on the information obtained.
As most of the nine processes have begun only in the past few years, it is anticipated that future global assessments will be able to gain significant information on a number of forest management indicators.
Eighty-three countries, including all major industrialized countries,[11] provided national-level information on forest management as part of FRA 2000 reporting. An additional 14 countries supplied comparable information to FAO’s Latin American and Caribbean Forestry Commission in 2000. National figures are, however, still missing from a fairly large number of developing countries, including many of the larger countries in Africa and some key countries in Asia. Data are also missing from many smaller countries in Oceania and the Caribbean. Clarification is currently being sought in six cases and these reports have been excluded from the analysis. An attempt has been made to obtain information from auxiliary sources, but, as can be seen from the results presented in Appendix 3, information is still lacking from a number of countries.
Disparities in replies from industrialized countries, which are not entirely explicable by differences in national situations, suggest that there is a lack of uniformity in the way in which the definition of forest area managed has been interpreted and applied - notably in the distinction between management for wood supply only and for all forest functions, and between management according to approved management plans and less formal forms of management.[12] There was also uncertainty as to whether areas where a decision has been made not to manage the area at all had always been included in the “managed” category, as was recommended by UNECE/FAO (2000), so figures may not be directly comparable between countries.
The definition used for developing countries, on the other hand, was limited to forest areas subject to a formal and nationally approved forest management plan. This definition appeared to cause fewer difficulties in interpretation and application but precludes a direct comparison of results with those from industrialized countries.
In summary, the results indicate that 89 percent of the forests in industrialized countries (accounting for 45 percent of the total forest area in the world, most of which is located in the temperate and boreal zones) were subject to a formal or informal management plan. National figures are still missing from a fairly large number of developing countries, including many of the larger countries in Africa and some key countries in Asia. Nevertheless, results obtained so far indicated that of a total forest area of 2 139 million hectares in non-industrialized countries, at least 123 million hectares, or about 6 percent, were covered by a formal, nationally approved forest management plan with a duration of at least five years.
In analysing the results provided in the table, it is important to keep in mind that the total area reported to be subject to a forest management plan is not necessarily equivalent to the total area of forest under sustainable forest management. The present study does not indicate whether the plan is appropriate, being implemented as planned or having the intended effects. Some areas reported as being covered by a management plan may thus not be under sustainable forest management. Conversely, many areas may be under sustainable forest management without the existence of a formal management plan. Furthermore, remote areas with lack of access or very limited human use may not require a management plan or management activities to achieve a management objective of being safeguarded for the future.
Qualitative information on status and trends in silviculture and forest management is presented for selected countries in the country profiles on the FAO Forestry Web pages (www.fao.org/forestry/fo/country).[13]
Regional overview
In Africa, only seven countries provided national-level information, representing less than 3 percent of the total forest area in the region. Only two tropical moist forest countries were included in this list. The percentage of the forest area under a formal, nationally approved forest management plan in these seven countries in 2000 ranged from 2 to 78 percent, with the total area subject to management plans equalling 15 percent of the combined forest area in these countries. Partial figures were obtained from an additional seven countries. All available figures added up to 5.5 million hectares of forests under management plans, equivalent to only 0.8 percent of the total forest area of Africa. Efforts are currently under way to obtain clarification from a number of countries and to supplement the existing information with data from other sources.
In Asia, national-level information was provided by 21 of the 49 countries and areas reported on, accounting for 30 percent of the total forest cover as information was not obtained from the two countries in the region with the largest forest areas. The percentage of the forest area under a formal, nationally approved forest management plan in these 21 countries in 2000 ranged from 23 to 100 percent.[14] It should be kept in mind that the countries of the Commonwealth of Independent States (CIS), where figures ranged from 82 to 100 percent, reported on the area subject to management with a formal or informal management plan and included areas where a decision had been made not to manage the area at all.[15] The total area in the region reported as being subject to forest management plans (including partial results from two countries, and with the two different definitions used kept in mind) equalled 134 million hectares or 24 percent of the total forest area.
In Oceania, only three of the 20 countries and areas provided national data on the area of forest managed. However, these three countries (Australia, New Zealand and Papua New Guinea) together accounted for 98 percent of the total forest area in the region. The figure for Papua New Guinea was limited to formal forest management plans, whereas the definition used for Australia and New Zealand included areas under informal plans and areas where a decision had been made not to manage the area at all. Including the partial results from Solomon Islands, and with the use of two different definitions kept in mind, the total forest area under management plans was 167 million hectares or 84 percent of the total forest area in the region.
In Europe, 39 countries and areas provided national information on areas of forest managed, including areas subject to informal management plans and areas where a decision had been taken not to manage the area at all. With the exception of Italy, which reported only on areas subject to a formal, nationally approved management plan, the figures ranged from 33 to 100 percent of the total forest area in each country. Quite a large number of countries (19) reported that all their forests were managed according to the definition above, including the Russian Federation, which alone accounted for 82 percent of the total forest area in this region. Looking at the region as a whole, 98 percent of the total forest area was reported as being managed.
Thirteen of the 34 countries and areas reported in North and Central America provided national information on the area of forest under management.[16] The total forest area covered by these countries equalled 99 percent of the combined forest area of the region. Canada and the United States, accounting for 86 percent of the total forest area in this region, used the definition that includes areas under informal forest management plans and areas where a decision had been taken not to manage the area at all. The remaining countries reported on areas subject to a formal management plan. Most of these excluded forest plantations from their reporting to the meeting of the FAO Latin American and Caribbean Forestry Commission in 2000. The reported figures ranged from 2 percent of the total forest area to 74 percent. The total area reported as being under management plans in the region (including partial data and with the two different definitions in mind) equalled 310 million hectares or 56 percent of the total forest area.
Eleven of the 14 countries and areas reported in South America provided information on the size of the forest area subject to a formal management plan. Most of them included only natural forests in their report to the meeting of the FAO Latin American and Caribbean Forestry Commission in 2000. The area subject to a forest management plan varied between 0.1 and 25 percent of the total forest area in each country. For the region as a whole, 26 million hectares, or 3 percent, of the total forest area was reportedly subject to a formal management plan. Given that the countries that reported accounted for 94 percent of the combined forest area in the region, these figures may seem low. However, it should be kept in mind that many countries in this region have large expanses of forests that are located in remote areas with lack of access or with very limited human use, which may not require a management plan. It is also uncertain whether all countries included protected forest areas in their reporting on areas covered by forest management plans.
Criteria and indicators provide a means to measure, assess, monitor and demonstrate progress towards achieving sustainability of forest management in a given country or in a specified forest area over a period of time. Certification, on the other hand, is an instrument used to confirm the achievement of certain predefined minimum standards of forest management in a given forest area at a given point in time. Certification is essentially a forest products marketing tool, used by forest owners who perceive an economic benefit from undergoing the certification process.
A number of international, regional and national forest certification schemes now exist, focusing primarily on forests managed for timber production purposes. The volume of timber covered by these schemes, while increasing, is still relatively low. Depending on how the term “area certified” is defined, the area of certified forests worldwide at the end of 2000 was estimated at 81 million hectares or about 2 percent of the total forest area.
Whereas certification implies that an area is well or sustainably managed, the total area of well-managed forest is not limited to certified areas. Many uncertified forests, including both those managed primarily for wood production and those with other management objectives, may also be under sound management.
While some important wood-producing countries in the tropics have forest areas certified under existing certification schemes or are in the process of developing new schemes, most certified forests are located in a limited number of temperate, industrialized countries. At the end of 2000, about 92 percent of all certified forests worldwide were located in the United States, Finland, Sweden, Norway, Canada, Germany and Poland. At the same time, only four countries with tropical moist forests (Bolivia, Brazil, Guatemala and Mexico) had more than 100 000 ha of certified forests, for a combined total of 1.8 million hectares.
Table 2. Regional overview of size of forest area certified
|
Region |
Forest area 2000 (000 ha) |
Forest area certified (000 ha) |
Forest area certified (%) |
|
Africa |
649866 |
974 |
0.1 |
|
Asia |
547793 |
158 |
0.03 |
|
Oceania |
197623 |
410 |
0.2 |
|
Europe |
1039251 |
46708 |
4.5 |
|
North and Central America |
549304 |
30916 |
5.6 |
|
South America |
885618 |
1551 |
0.2 |
|
WORLD TOTAL |
3869455 |
80717 |
2.1 |
Some forest certification schemes are now being extended to include certain non-wood forest products (NWFP). This is proving to be more complex than certifying for timber, as the same forest area may have to be assessed for one or more NWFP, which may have different requirements. It is possible, for example, that a forest is managed for timber in a sustainable way while its NWFP resources are being overharvested, and vice versa.
A direct comparison with previous estimates of the forest management status in tropical and temperate/boreal regions is not possible because of differences in definitions used. However, it is worth noting that in 1980 an estimated 42 million hectares of forest in 76 tropical countries were reported to be subject to “intensive management for wood production purposes”. In 2000, information received so far indicates that at least 117 million hectares[18] of forests in these countries were covered by a formal, nationally approved forest management plan of a duration of more than five years. Most, but not all, of these forests were managed for wood production purposes. A reported 2.2 million hectares of forests in these countries had obtained forest certification by third parties by the end of 2000.
The ITTO study referred to earlier estimated that in 1988 a maximum of 1 million hectares of forest in 17 tropical timber producing countries were being managed sustainably for wood production purposes (Poore et al. 1989). Judging from the area under management plans and/or certified in the same 17 countries in 2000, a considerably larger area may now be under sustainable management for wood production purposes. Currently, more than 35 million hectares of forests in these countries are covered by a formal forest management plan, and 1.7 million hectares of forests have been certified by third parties. A considerably larger area is likely to be eligible for certification or under sustainable management for purposes other than timber production. As a case in point, six tropical countries (Cameroon, Ghana, Guyana, Indonesia, Malaysia and Myanmar), with a combined forest area of 206 million hectares, appear to have established all the conditions needed to enable them to manage their forests sustainably in the near future (Poore and Thang 2000).
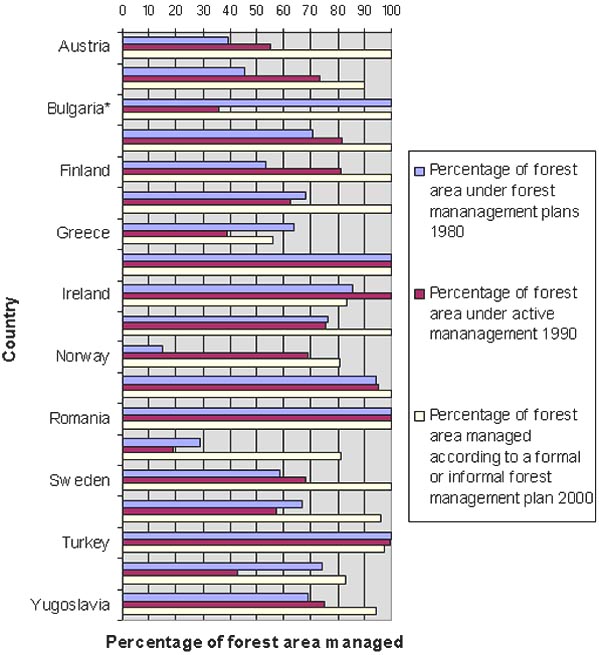
The situation in temperate and boreal forests appears to have remained stable or to have improved over the past 20 years. In the early 1980s, all areas classified as closed forests in the former Soviet Union were reported as being “managed according to a forest management plan” (UNECE/FAO 1985). In 2000 the Russian Federation and most of the States of the CIS reported that all forests were being “managed according to a formal or informal plan”. Nineteen countries in Europe[19] provided information on the forest management situation in the early 1980s, 1990 and 2000 (UNECE/FAO 1985; UNECE/FAO 1992; UNECE/FAO 2000). The proportion of closed forests “managed according to a forest management plan” in 1980 was 64 percent; in 1990, the proportion of forests “under active management” was 71 percent; and in 2000, 95 percent of the forest area was reported to be “managed in accordance with a formal or informal management plan”. Refer to Figure 2 below and Table 3 in the Appendix for information for individual countries.
The percentage of the forest area under management in Canada and the United States increased from 60 and 41 percent respectively in 1990 to 71 and 56 percent respectively in 2000.
Figure 2. Trends in forest management in Europe 1980-2000
![]()
![]()
![]()