11.1 NEED FOR AUTOMATED PROCEDURES
11.2 DATA FLOWS
11.3 SURVEY STANDARDS
11.4 PROCESSING OF PRIMARY DATA
11.5 DATA CHECKING AND MONITORING
11.6 ESTIMATION PROCESSES
11.7 BASIC REPORTING
11.8 TRAINING AND OPERATIONAL GUIDELINES
The production of meaningful fishery statistics requires processing of the data that results from the various field surveys. Modern data processing now requires the use of computerized systems. This section outlines the following:
Computer systems and software have become inseparable components of fishery statistical systems, and should respond to a wide variety of functional needs. Their design should be:
Typical functions of a computerized system for basic fishery data are:
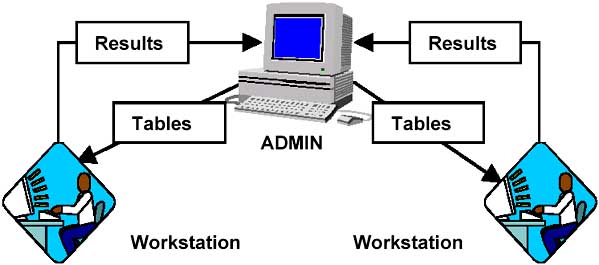
The above diagram gives an example of a simple system architecture that provides data flows between data processing operators and central administration of the fisheries statistical programme, which includes.
This or similar structures offer the following advantages:
Well-defined survey standards help to streamline field operations, produce consistent reports and integrate survey outputs with those resulting from other analysis and reporting applications.
11.3.1 Validity of survey standards
Survey standards are usually valid for a complete operational cycle of a survey programme (usually one year), after which period they are reviewed. However, there are cases of seasonal changes in a survey framework and it is thus essential for survey standards to reflect such changes.11.3.2 Strata and geographical areas and locations
The first step in the computerization of survey standards is to set-up the following tables:
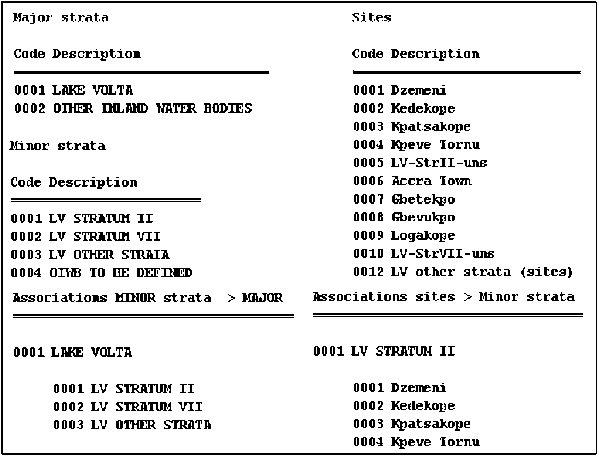
The figure above provides an example of a computer set-up for strata, sites and their associations.
11.3.3 Boat/gear types
The second step is to set up a table of all possible boat/gear categories, which should be easily recognizable by the recorders in case pre-printed lists are used in data collection forms.
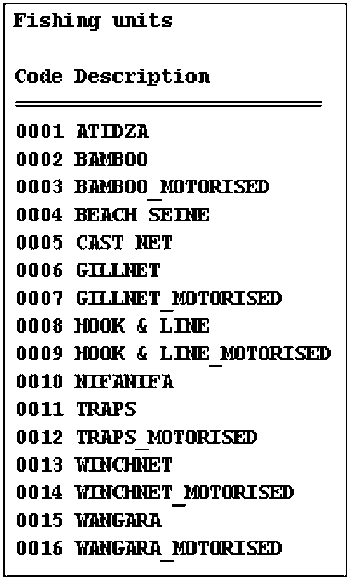
The figure above gives an example of a computer set-up for boat/gear types.
11.3.4 Frame surveys
The next task is to establish a table containing Frame Survey data, which requires associated tables of homeports, landing sites and boat/gear types.
Usually the computer system would operate on the tables of sites and boat/gears and prepare blank records containing all “site - boat/gear” combinations. Users would then complete these records with the numbers of fishing units potentially operating in each combination.
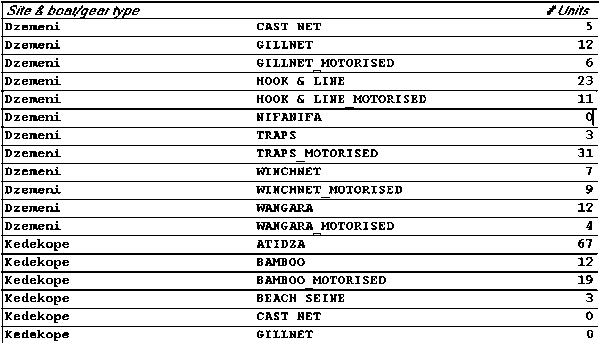
The figure above illustrates an example of a computer set-up for frame surveys.
11.3.5 Species lists
The next step is to set up a species table containing all possible species. Species names should be easily recognizable by the recorders in case pre-printed lists are used in data collection forms.
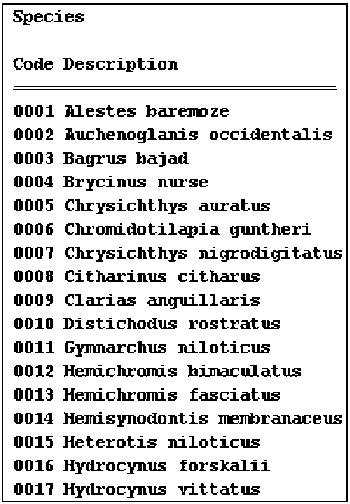
The figure above illustrates an example of a computer set-up for species.
11.3.6 Standard units
It is important that measurement units involved in a sample-based survey are consistent throughout the statistical programme. In this handbook the following units are considered:
Weight: units should be used consistently in all survey implementation components. For instance, if the agreed weight unit for recording landings is the kilogram, this unit should be used at all data collection sites. (The same concept applies to currencies.)Effort: by definition effort units differ among the various boat/gear types and fishing methods. However, in surveys dealing with basic fishery data there is a need to easily integrate catch and effort estimates deriving from different boats and gears. For statistical purposes it is generally accepted that the boat-day is a reasonably good way for uniformly expressing fishing effort.
The primary data for processing are the individual samples on boat activities and landings, collected from the field. Designing and implementing a computer system for these data can be a complex task, which requires considerable effort and can only be reviewed briefly here.
11.4.1 Input of data on boat activities
The computer procedure must be flexible enough to handle data that are collected by means of different sampling schemes. Data input is done directly from documents organized by month, by homeport or by boat/gear type.
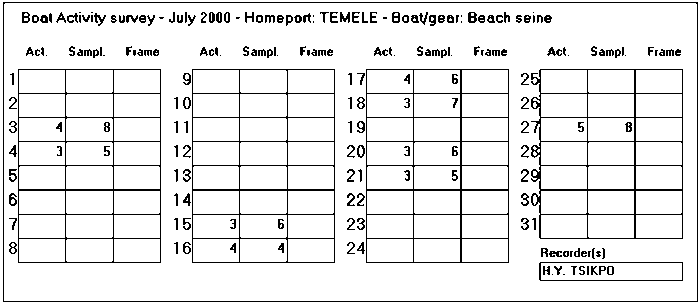
The figure above is an example of a general-purpose computer screen used for entering data on boat activities. Numbers of active boats are recorded together with the total number sampled at a homeport on a given day, although provision is also made for Frame Survey data if that is required.
11.4.2 Input of data on Active Days
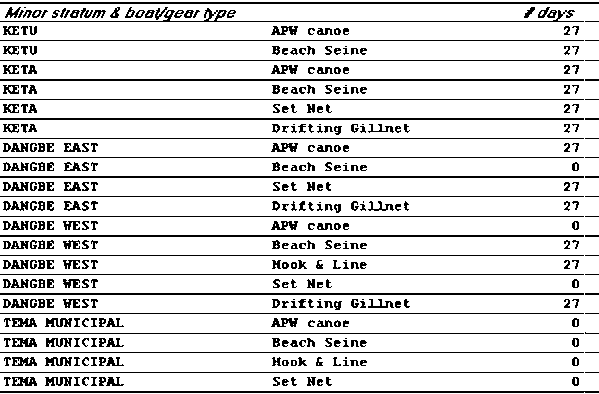
Active Days data provide time raising factors for estimating fishing effort in an estimation context of a minor stratum, a month and a specific boat/gear type. Therefore, the computer table would contain all combinations of minor strata and boat/gear types. These can be created automatically by the computer system. For a particular month these records need to be updated with the number of Active Days corresponding to each combination. Initially, the table contained zeroes.
11.4.3 Input of data on Landings
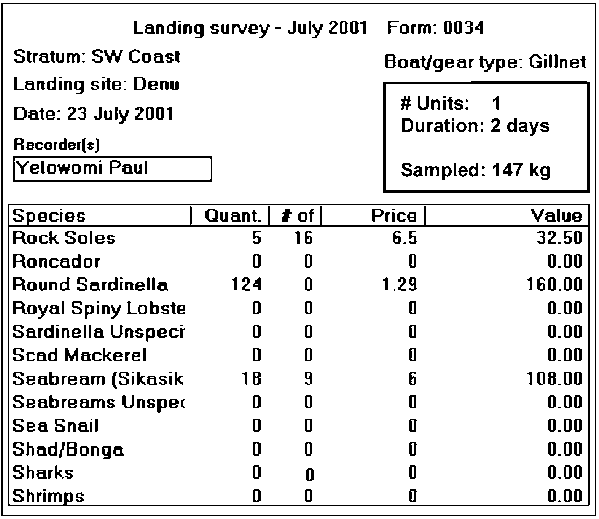
Landings data input is done directly from documents that have been organized by month, by stratum and homeport or by boat/gear type. The figure below is an example of a general-purpose computer screen used for entering sampled landings.
Prior to producing estimates for fishing effort and catch a certain amount of data checking and monitoring must be performed with the purpose of ascertaining the state of completeness and the quality of primary data. Such control functions involve:
A computer-based estimation process involves the following computational steps:
11.6.1 Estimation of fishing effort
(a) Boat activity samples, Active Days and Frame Survey data are directed to the appropriate estimation context of a minor stratum, a month and a boat/gear type.11.6.2 Estimation of catch and value(b) BACs are formulated in each context.
(c) The accuracy of BAC estimates is computed.
(d) The overall BAC variability and its confidence limits are computed.
(e) BAC variability is explained in space and time.
(f) BACs are combined with Active Days and Frame Survey data to produce estimates of fishing effort.
(g) Effort variability and confidence limits are computed.
Sampled landings data are directed to the appropriate estimation context of a minor stratum, a month and a boat/gear type.
(a) Overall CPUEs are formulated in each context.The computational steps given above are repeated for each estimation context of a minor stratum, a month and a boat/gear type. At the end of this process the following data grouping procedures are performed:(b) The accuracy of CPUE estimates is computed.
(c) The overall CPUE variability and its confidence limits are computed.
(d) CPUE variability is explained in space and time.
(e) Sample species proportions are formulated.
(f) Sample prices are formulated.
(g) Estimates of average fish size (in weight units) are produced.
(h) Estimated CPUEs are combined with estimated effort to produce estimates of total catch.
(i) Variability of catch estimates and related confidence limits are computed.
(j) Sample species proportions are combined with estimated total catch to produce estimated catch by species.
(k) Sample prices are combined with catch by species to produce estimated values by species.
(l) Values by species are added up to produce total values for landings.
11.6.3 Data grouping
(a) Catch, effort and values are grouped at major stratum and grand total levels.(b) Average CPUEs and prices are formulated at major stratum and grand total levels.
There are many ways for the preparation of basic reports on estimated data. Generally, in the reporting functions of monthly catch/effort estimates, which constitute ‘first generation’ statistics, the following points should be considered:
(a) The first reporting level should be the estimation context (the stratum) where all computations and related statistical indicators and diagnostics are produced.11.7.1 System diagnostics(b) Prior to analyzing the results, users should check the system messages to determine the level of completion of each estimating context.
(c) All data involved in the estimation process must be reported to allow manual verification of the results, if needed.
(d) The reporting sequence should generally follow the computational steps discussed in 11.7.
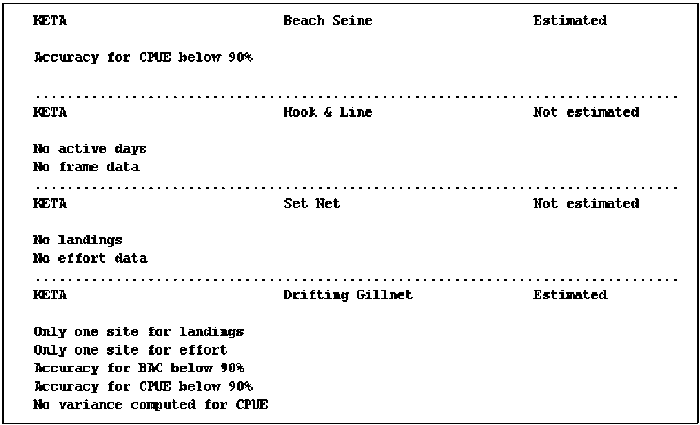
The example given below illustrates system messages that were produced during an (incomplete) estimation process. For each estimation context, messages are displayed describing the outcome of the estimations.
The messages displayed for different estimation contexts inform users that:
(a) Accuracy for CPUE is below 90%. Estimation continued.(b) No active days and no frame data (so, no raising factors). Estimation failed.
(c) No landings or data. Estimation failed.
(d) Limited geographical coverage. Accuracy levels for BAC and CPUE are below 90%.
11.7.2 Estimated effort
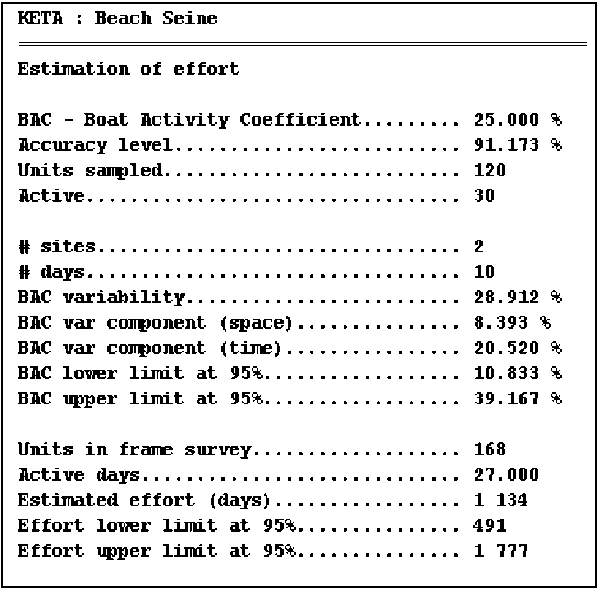
In the example figure below, the estimated effort is described in three sections.
(a) Estimation of BAC and resulting accuracy can be verified with the sampling information displayed.(b) The variability of BAC is high (29%) and is explained in space and time. Note that variability in time (20.5%) is the primary cause.
(c) Estimation of fishing effort can be verified using the estimated BAC and the data on active days and frame survey raising factors. Confidence limits for estimated effort are also displayed.
11.7.3 Estimated total catch
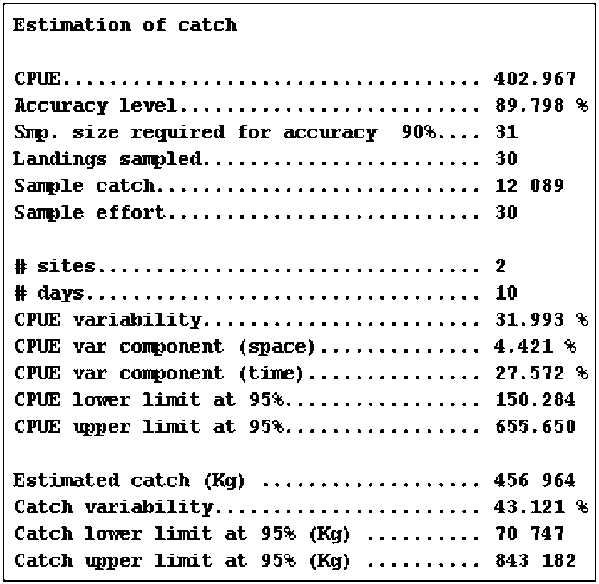
In this example total estimated catch is described in three sections.
(a) Estimation of overall CPUE and resulting accuracy can be verified with the sampling information displayed. To be noted that the resulting accuracy is slightly below the acceptable level of 90% because 30 samples, instead of 31 required, were used.(b) The variability of CPUE is high (32%) and is explained in space and time. Note that variability in time (27.5%) is the primary cause.
(c) Estimation of total catch verified using the estimated CPUE and the estimated fishing effort described earlier. The compound variability of catch is very high (43%) because of the high variability in CPUE and fishing effort. Confidence limits for estimated total catch are also displayed.
11.7.4 Catch by species
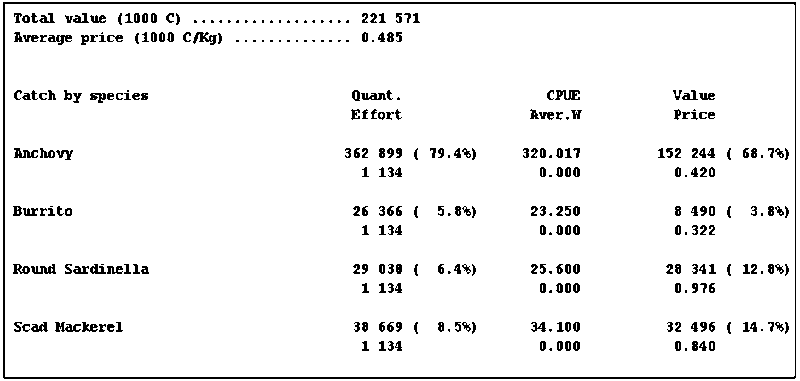
In the example below, results by species are displayed in three columns describing:
(a) Estimated catch by species and related effort.A summary total value of all landings and their unit-value is given at the top of the report.
(b) CPUE by species.
(c) Average weight per species.
(d) Sample price and estimated value by species.
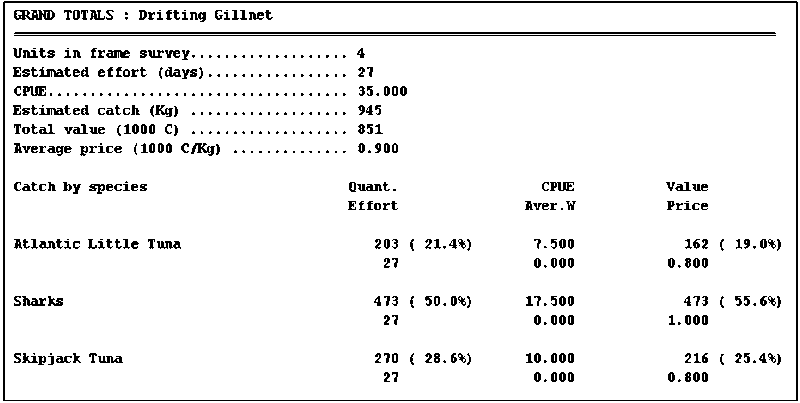
11.7.5 Grand totals
The example below illustrates grand totals computed for a specific boat/gear type (drifting gillnet). These figures have resulted from grouping all statistics for this boat/gear type from the different minor strata.
The overall assessment of a computer system for basic fishery data involves not only design criteria but also the capacity of fisheries personnel to operate it efficiently. Training aspects include:
(a) Mastering of all system functions by data operators.(b) Preparation of regular backup copies of data.
(c) Availability of quick start-up guides for system operations.
(d) Methods for accessing catch/effort estimates for further processing.
(e) Effective monitoring of data entry, estimation and data submission procedures.
|
SUMMARY In this section general aspects concerning automatic processing of basic fishery data was introduced, including: (a) The need for automated procedures performed by robust, modular and sustainable computer systems |