![]()
![]()
![]()
Table 10. Population and economic indicators
|
Country |
Population, in Millions |
Percent Rural Population |
GNP in Billions US$ |
Rate of growth of GNP |
Annual per Capita in US$ |
|
Cameroon |
15 |
52 |
8.5 |
5.0 |
580 |
|
Ghana |
19 |
62 |
7.4 |
4.8 |
390 |
|
Kenya |
29 |
68 |
10.6 |
0.5 |
360 |
|
Madagascar |
15 |
71 |
3.7 |
5.5 |
250 |
|
Malawi |
11 |
76 |
2.6 |
6.9 |
190 |
|
Mali |
11 |
71 |
2.6 |
5.8 |
240 |
|
Senegal |
9 |
53 |
4.7 |
5.1 |
510 |
Table 11. Land resources
|
Country |
Land under permanent crops in1997, in Million/ha |
Percent Irrigated land 1995-1997 |
Agricultural productivity/agricultural worker 1995 dollars 1996-1998 |
Food production Index 1989-1991=100 |
|
Cameroon |
2.6 |
0.3 |
1 054 |
120.2 |
|
Ghana |
7.5 |
0.2 |
542 |
144.2 |
|
Kenya |
0.9 |
1.5 |
228 |
104.9 |
|
Madagascar |
0.9 |
35.0 |
186 |
108.7 |
|
Malawi |
0.9 |
1.6 |
138 |
109.7 |
|
Mali |
0.0 |
2.1 |
271 |
114.5 |
|
Senegal |
0.2 |
3.1 |
320 |
100.4 |
Source World Bank, 2000, World Development Report 2000-2001: Attack on Poverty
Figure 15. Rural population since 1970 and the projections to 2010
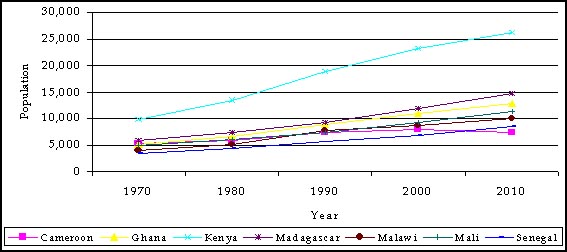
Figure 16. Economic active population
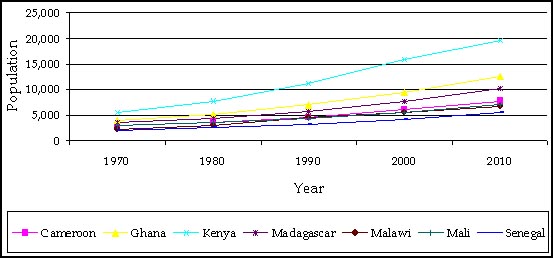
Figure 17. Non-agricultural population in the seven countries, 1970-2010
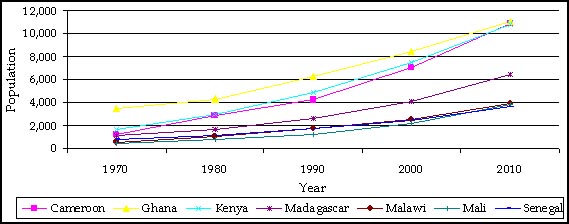
Figure 18. Net official development assistance
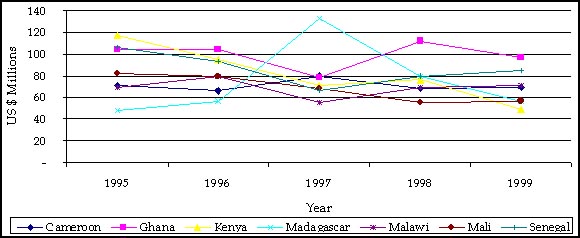
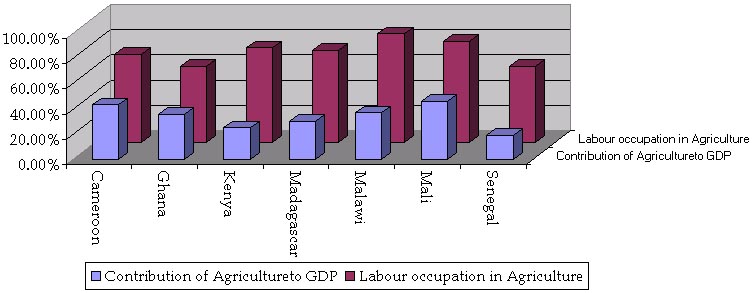
Figure 19. Agriculture Contributions to GDP
![]()
![]()
![]()