![]()
![]()
![]()
|
Stage 2 involves the review of data necessary for market design. Existing agricultural production statistics can be used together with surveys to estimate supply and demand. The following activities should be carried out:
|
STAGE 2
ASSESSING MARKET TRADING
REQUIREMENTS
Overall approach
What is supplied to the market? In Stage 1 the reasons why market improvements might be needed were broadly identified. This stage involves estimating the levels of supply that could pass through new or improved markets. For existing markets the assessment can be based mainly on observing what is happening in the market. Where there is no existing market the assessment must be based on local supply and demand estimates and forecasts.
Supplies to a market and the type of market used vary depending on the type of local agriculture. For example, in areas where there is large-scale production of fruits and vegetables for urban areas, a new or improved assembly market may be required. In areas where production is primarily of export commodities, which usually have well-established independent marketing channels, only rural retail markets may be required.
Catchment areas. One of the most difficult points to consider is the “catchment area” to be served by a particular market. This could be reviewed by looking at the production areas within walking or animal cart distance of a market, in which case a maximum radius of 10 km from the market might be a reasonable assumption. When an assembly market is being planned, and farmers have access to public transport or small trucks, a longer distance could be assumed. If there are no other large rural centres with markets a “catchment area” for an existing or new assembly market could have a radius as high as 50 km.
Step 2.1
Decide on design information
needed
Secondary data. All rural planning depends on the availability of information. The first approach to collecting this information is to undertake a review of existing published documents and maps, such as regular population and agricultural census reports. These provide what is usually referred to as secondary data, examples of which are:
population data (age composition, gender, migration, and mortality rates, annual growth rates);
agricultural production data - areas and yields, location of agricultural production areas (irrigated and non-irrigated), forested areas, fishing concessions;
relevant studies on crop marketing, existing market channels, location of agroprocessing and storage facilities; and
available site engineering data and maps, strategic and physical planning standards and master plans, environmental data and building cost data.
Primary data. Primary data may also be needed. This involves working with communities, market traders and farmers to collect data and, if necessary, undertaking field surveys to fill gaps.
Market surveys. The types of survey that could be undertaken are as follows:
inventory surveys that describe physical and trading conditions in existing markets;
traffic surveys to measure the number of vehicles using a market, the mode of transport used and the origin and destination of agricultural produce;
socio-economic and environmental impact studies of specific issues or areas; and
case studies of small businesses, such as market traders, to investigate their financial viability. This is particularly important in order to evaluate their capacity to pay increased fees, which may be necessary after making improvements or building a new market.
The market inventory survey (detailed in Annex A) usually consists of two parts: a general review of market operations and a physical survey, which involves mapping the site and its facilities.
For more complex markets (such as an assembly market) this data should be supplemented by a traffic and origin/destination survey. Where there is a total lack of information on production, a sample survey of farm households may be necessary, although this level of investigation is probably not appropriate for most rural markets. A count of the existing sellers and observation of the market users’ activities, together with discussions with traders, should be adequate for most markets.

FAO/16188/G. Bizzarri
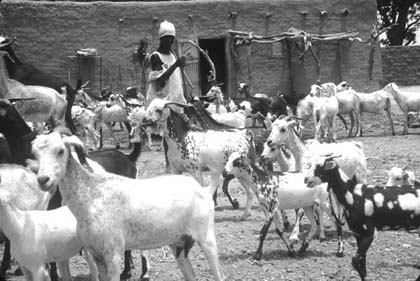
It is essential to review production of both crops and livestock in the area to be served by the market.
FAO/10995/J. Van Acker
Step 2.2
Assess supply and demand
It may be necessary to make an assessment of potential supply and demand to determine the existing or likely flows through new markets. The methods for doing this are shown in Annex B and the steps involved are as follows:
review crop and livestock production, to identify the quantities that could be marketed;
review the role of market channels, to find out where the produce is presently going;
review existing consumption, on the basis of average food consumption levels;
determine on-farm use, to identify what is retained by the farmers for their own use; and
determine non-market sales, to quantify how much produce is not likely to go through the market.
Step 2.3
Estimate the market’s
throughput
Existing throughput. The last step at this stage is to estimate the planned market’s throughput. The basic calculation method, which is the same for both primary and assembly markets, is shown in Form 6 in Annex B. Using this method for each of the main crops it is possible to estimate the following on an annual basis:
marketable surplus;
total non-market sales;
planned or existing market sales;
imports into the area to meet any deficit; and
total market throughput.
Future market throughput. In calculating future market throughput additional factors need to be considered. The future throughput of produce marketed at an assembly market is dependent on how local production increases and what proportion of this increased growth will pass through the market. For a primary retail market the future throughput will depend on local retail demand, which will be affected by local population and income growth. The easiest way to handle this calculation is to assume that the competition from other marketing channels remains a constant proportion, to divide the market throughput into retail and assembly trade and then to apply growth factors for:
retail trade, based on population growth and changes in consumption (remember that census data is often out of date and this may be significant when growth rates are very rapid);and
assembly trade, based on expected production growth for different crops.
Table 2
Calculation of future market
throughput
(tonnes per year)
|
Fresh produce |
Present through-put |
Retail trade |
Assembly trade |
Total future |
||||
| |
|
Through-put |
Growth factor |
Future |
Through-put |
Growth factor |
Future |
|
| |
a |
b |
c |
d |
e |
f |
g |
h |
|
Vegetables |
2 000 |
1 200 |
1.40 |
1 680 |
800 |
1.40 |
1 120 |
2 800 |
|
Potatoes |
2 500 |
1 500 |
1.40 |
2 100 |
1 000 |
1.60 |
1 600 |
3 700 |
|
Fruits |
2 000 |
1 200 |
1.40 |
1 680 |
800 |
1.50 |
1 200 |
2 880 |
|
Meat |
800 |
800 |
1.40 |
1 120 |
- |
- |
- |
1 120 |
|
Eggs |
500 |
500 |
1.40 |
700 |
- |
- |
- |
700 |
|
Fish |
200 |
200 |
1.40 |
280 |
- |
- |
- |
280 |
|
Total |
8 000 |
5 400 |
|
7 560 |
2 600 |
|
3 920 |
11 480 |
To make projections it is necessary to assume a time period. In financial and economic analysis this is usually taken at 20 to 25 years, based on the life of the investment. However, such long-term projections are difficult to justify and would give an exaggerated impression of demand for space. For rural markets a 10-year projection period is more appropriate. For example, if the growth is 3.5 percent per year, for 10 years it will be a growth factor of 1.03510, roughly equivalent to a 40 percent increase or a multiplier of 1.4.
In many cases, of course, a market has a mixture of functions. For example, retail trade might account for 60 percent of the total and the balance might be assembly trade. This assumption is made in the example shown in Table 2.
Given the uncertainty of making such estimates it is usually necessary to make two projections-high and low-of future throughput, which reflect optimistic and pessimistic views of likely growth scenarios. The basis for the growth factors should be discussed with local agricultural officers to ensure that they are consistent with current information and policies.
As was suggested earlier, for simple improvements to an existing primary market such detailed calculations can be omitted. By counting the number of stalls (n) and multiplying this by the average daily sales per trader (s) and the number of marketing days (d) in a year, a rough estimate of the annual total (T) throughput can be derived. T = n × s × d. This can be projected into the future using a simple growth factor (as in Table 2).
Note: More detail on methods that can be used to project demand is given in the FAO Agricultural Services Bulletins Nos. 90, 121 and 141 (see Further Reading at the end of the guide).
![]()
![]()
![]()