![]()
![]()
![]()
A. Barkai and M. Bergh
OLRAC - Silvermine House, Steenberg Office Park
Tokai 7945, Cape Town, South Africa
<[email protected]>
1. THE INFORMATION WAR
"...Because U(t) is a linear function of population biomass for U(t) < g K, there are an infinite number of equilibrium solutions when the replacement line U(t) = b B(t) coincides with the replacement line U(t)=UB(t)/ gK [i.e. when b=U(gK)].... Nevertheless, the relative equilibrium population size structure, N*j / N*j+1 for all j, will be identical at all possible equilibria on the interval 0 < B(t) < g K regardless of the harvesting strategy which maintains each equilibrium..."
(Extract from a scientific document on the management of a deep-sea rock lobster stock by the authors of this article)
"Speak English!" said the Eaglet. "I don’t know the meaning of half those long words, and, what’s more, I don’t believe you do either!" (Lewis Caroll: Alice in Wonderland)
A new breed of high profile fisheries scientists is commanding increasing influence in the worldwide management of fish stocks. Like the knights of old on horseback, they fly around the world waving powerful computers like swords and dispensing mathematical models like magic potions. They use complex scientific jargon to communicate amongst themselves and are dismissive of others who are unable to understand or participate in their complex rituals. They recognize no masters and take no prisoners. They are the protectors of the sea and its fish. Uncontrolled fishers are their enemies and unsustainable utilisation is their war cry.
Many of these scientists have no biological background and little knowledge or interest in fisheries biology or ecology. Never having been exposed to the harsh and smelly realities of fishing or the challenges of running a competitive business, to them fishing is the manipulation of binary digits on their virtual fish stocks, productivity occurs at peaks on different probably curves and reality is defined by the minimum "negative log likelihood" parameter estimates that appear on computer printouts.
Some of these fisheries gurus treat fishers with great suspicion and contempt and use their scientific wizardry and skill to promote ideological or wider political objectives, while others regard themselves as the protectors of the environment from ruthless exploiters. Yet others sell their craft to fishing companies or fisheries associations in order to ward off harsh management decisions. The latter are often perceived to be biased or dishonest, and their scientific work is treated with suspicion by the established scientific community.
Not surprisingly, fishers frequently regard fisheries scientists as parasites who do not add value to the fishing industry, but rather impose additional costs through purposeless and unproductive fishing regulations and reductions in total allowable catches, quotas and regulated effort levels. As a rule fishers do not trust fisheries scientists. At best they see no integrity in the scientific process; at worst they regard scientists as pawns of cynical political forces or radical environmental groups.
On the other hand the conduct of the fishing industry is questionable. There are good reasons why, in many circles, fishing is synonymous with illegal activity. The use of indiscriminative fishing gear kills large numbers of non-commercial species such as seabirds, seals, dolphins and indeed undesirable finfish species. Sharks are finned and released, doomed to a slow painful death. Where control is lax high-seas fish stocks are ruthlessly overexploited (e.g. as in recent high-seas Patagonian toothfish and orange roughy fisheries), and the pursuit of illegal high-seas fishing vessels by multinational enforcement efforts is a regular feature on many national news networks. Often catches are not honestly reported to management agencies and gear regulations are ignored.
The fishing industry receives a far greater share of public and scientific interest and comment than other more damaging exploiters and polluters of the environment. Farmers, miners and manufacturers associated with significant environmental degradation are often treated much more leniently than fishers. The intense public interest in fishing does not reduce the tension between the fishing industry and management authorities, and what should be a straightforward technical communication often deteriorates into an emotive debate where facts and science are combined with personal ideology, environmental conviction and political agenda. The often venomous e-mail exchanged between subscribers of internet groups like "fishfolk" demonstrates the level of emotion that is typically generated. The result is a chaotic cacophony, which is high on emotion and low on solutions.
This state of affairs can be partly attributed to the different philosophies governing science and fishing as occupations. Scientists are by definition ‘scientists’. Fishing stories in their view are just that - stories. Scientists regard real life fishing experiences and views with considerable scepticism, a result of either not believing these narratives, or not knowing what to do with them. The reason is that the information content of these experiences is usually not properly quantified. Quantitative fisheries scientists only use and analyse information which is applicable to their mathematical models. Data which is readily incorporated into these models includes CPUE data, historic catch records, growth rate data, the data from scientific surveys of stock biomass trends, and the age and size structure of landings. Scientists are disinclined to take on the often thankless task of making sense of large amounts of unstructured or qualitative information which is not presented in the usual scientific format.
Scientists are also, by virtue of their discipline, extremely conservative. This has a lot to do with the basic personality types that opt for a career premised on the application of a rigorous discipline, in contrast to the flair and risk taking traits required to pursue a business, especially one in the fishing industry. Ideology also plays a significant role and there are a number of epistemologies, which in combination produce the final world view of modern day quantitative fisheries scientists.
One of these is the scientific ideology that one should, as a rule, favour the simplest interpretation of events as a basis for management, a rule immortalised as the maxim known as ‘Occum’s razor’. For example, prolonged poor catch rates should be treated as an indication of declining fish stocks, even if this is not proven. A further ideological principle is the Precautionary Principle, which came to prominence at the Earth Summit in Rio, requiring safe management measures to be taken in the face of uncertainty. In fact, any comprehensive and logically consistent treatment of uncertainty in scientific knowledge leads to the unavoidable scientific position that if the data upon which management is based are dubious or incomplete, then this has to be matched by a commensurate increase in the level of conservativeness in the basic management objectives and consequences.
Fishers, on the other hand, are hunters, who operate in an unforgiving environment. Their expertise is not neatly tabulated in columns of figures, but rather in a bag of memories, experiences, other fishers’ stories, legends and facts, all mixed together to form a picture with many hues and shades but little structure. Hardened by the high level of unpredictability associated with fishing, fishers prefer to treat poor catches as bad luck, or temporary environmental fluctuations, just like a drought after some years of good rains. They seldom accept that poor catch rates and diminishing catches are due to declining fish stocks.
2. IT’S ALL ABOUT INFORMATION
2.1 It’s not about being conservative, it is about being ignorant
"It’s all about information" says Cosmo (Ben Kingsley) in the movie Sneakers "The world isn’t run by weapons anymore, or energy, or money. It’s run by little ones and zeroes, little bits of data". While it is debateable that the world isn’t run by weapons anymore, modern weaponry is also governed by these "little ones and zeroes" referred to by Cosmo as the binary stones of computer language. The real technical revolution of the twentieth century is, arguably, the development of information technology.
Fishers are by virtue of their occupation, conservative (the sea is unforgiving), protective of their data and suspicious of any new technology which could be used by scientists to control their operation. For these reasons, while they readily adopt digital technology for remote sensing and navigation, they are far less receptive to the incorporation of information technology into their operation.
Skippers do believe that data are important; the fact is that many of them are obsessive collectors of operational data. The problem is that most skippers see these data as a means to assist them to find fish. There is no appreciation of data as a strategic tool and hence there is little interest in the more complex aspects of data gathering and data analysis. The same applies to shore skippers and fleet managers - for them data are production sheets and quota reports. The reality is that few in the fishing industry understand the crucial role that information technology plays or could play in the management of their resources, and the significant impact it has on their business and livelihood.
2.2 Data and decision making
The face of fisheries management has changed considerably over the last 20 years. Ever-increasing computing power has allowed quantitative scientists to test and implement population models which were previously unmanageable. To quote from our own experience, a simple and short version of a size-structured model for the South African West Coast Rock Lobster resource spanning a time period of 20 years took about a week to run in 1990. A much more complex model simulating 130 years of the fishery with 20 year forecasts now takes about 85 minutes to run.
The importance of this leap in technical capacity is that fisheries scientists are able to employ increasingly realistic population models to explore different and realistic possibilities about population dynamics with considerable ease. Unfortunately, this creates a dangerous situation of hyper-rationality, in which the realism of the models tends to anaesthetize the critical faculties. Nevertheless, this advance in hardware and software has placed considerable power in the hands of quantitative scientists. This in itself would not be a problem if skippers and managers had an appreciation of the technological gap that has opened up between their knowledgebase and the knowledgebase used by management agencies and governments to manage fish stocks. Unfortunately, most fishers believe they should come out of their corner fighting and that they can wage this battle against modern "weapons" with sticks and stones. They often believe that they can outsmart quantitative fisheries scientists by providing them with partial, or worse, incorrect data. Both the presumption of the need to fight a battle, and their ability to wage it in their terms is counterproductive.
Managers in many fishing companies still fail to see the direct benefit they could, and should, derive from quantitative assessment work for day-to-day boardroom decision-making. Go to any financial service business and you will see that the entire business is linked to quantitative projections, mathematical models, risk assessments and other data driven decision aids. However, many fishing company directors will make huge investment decisions without once consulting a stock assessment scientist. The cost of such misconception and ignorance is enormous.
On another front there is a common misconception in the fishing industry that management authorities cannot, and should not, make management decisions when data and scientific knowledge are lacking. There are two problems with this view: (a) there will never be a time when we have complete knowledge of all biological, ecological, physical, environmental and other data relevant to the management of fish resources - so this is not a realistic expectation and (b), scientists must use whatever data they have to assess the state of the stock and its productivity. Consequently, when scientists feel that critical data are either not available or not reliable, their duty is to be extra cautious. This means that they should, under circumstances of uncertainty, give more weight to more conservative interpretations of the data - that is, those that assume resources are more depleted and/or less productive.
2.3 The link between data and public perception.
In a September 2003 issue of the Economist, an article suggests that "when disasters prompt new policies, the results may be disastrous". It goes on to criticize the tendency by decision makers to respond to crises in an emotional and populist manner to satisfy headline grabbing journalists and a disenchanted public. Journalists and a number of scientists tend to refer to heavily depleted fish stocks in emotionally loaded terms coupled with demands for radical action. While many fish resources are indeed excessively depleted, there is an emotional overtone whenever fish resources are discussed. Often in these cases tall stories, supposition and a subjective interpretation and presentation of information is fed to the public as the real thing.
The reality is, of course, far more complex than this. Few have had any exposure to the basic concepts underlying renewable resources, and so do not appreciate that in order to exploit a resource on a renewable basis it is in fact necessary to deplete the resource biomass. Indeed, in order to optimally exploit fish resources the biomass must be depleted to between 30 and 50 percent of its pristine size. The public at large have no concept of the fact it is virtually impossible to fish commercially without severely reducing the number of large, older individuals in a population.
It is true that many, fish resources in the world are badly depleted. And it is also true that fishers are often dismissive, indifferent or ignorant of fishing regulations and their underlying rationale. A boom and bust culture still prevails in the global fishing industry and "loopholing" fishing regulations is as prevalent and culturally acceptable amongst fishers as income tax evasion is amongst tax payers. Despite this, there is an increasing number of fishers and fishing companies, mainly in countries where fishing rights are secure, who are playing the game by the rules. Unfortunately the political ability of the fishing industry to lobby for their cause is diminishing rapidly, and as a result the biggest challenge for years to come is not going to be their ability to catch their allocation, but rather their ability to keep it. There are really only two options open for fishers if they have any hope to avert draconic regulations and significant cuts in their fishing allocations. Both options require high levels of investment in information gathering and management technology.
The first option is for fishers to become a reliable source of good quality data. The culture of hiding information from decision makers or other interest groups is no longer effective at avoiding public and scientific scrutiny. If anything, it adds fuel to the general feeling that fishers cannot be trusted and as such should be intensively policed and managed.
The second option, to be used in combination with option number one, is for fishers to become equal, reliable partners in the technical debates about the determination of management plans and fishing regulations. Fishers need to accept the scientific process and to build capacity to meaningfully participate in this process. Failure to do so leaves the industry vulnerable to many "hostile" agendas, which are well versed at using the scientific process to good advantage. An example is the aggressive use by organisations such as the World Wildlife Fund (WWF) of scientific arguments aimed at promoting wildlife conservation goals. This is a fair and legitimate platform of engagement and arguably the most objective one (though not flawless as we shall see later). Any alternative is open to political and ideological abuse.
The risk of not being an honest "data broker" is far too great for the industry. A recent publication in the May 2003 issue of scientific journal Nature Ransom Myers and Boris Worms (Myers and Worm 2003) suggests that 90 percent of the world’s fish stocks have been removed by commercial fishing companies over the last 50 years. They suggest that the only way to confront the industry’s "irresponsible behaviour" and to save the world’s fish resources is to completely close large portions of the sea to fishing. Their call has the ear of many prominent scientists. For example, a group of British scientists lead by Professor Callum Roberts of York University (Roberts and Hawkins 2000) suggests that the world’s oceans are in crisis as a result of the massive over-exploitation of fish resources and the breakdown of the oceanic food web. They have suggested that as much as 40 percent of the marine environment should be closed to fishing if there is to be any hope of a recovery.
Debating the merits of such claims lies outside the scope of this article. However, our experience has been that such statements and sentiments find automatic acceptance and support from large sections of the scientific community and the general public. The protective, and often deliberately inaccurate, manner in which fishers record fishing data leaves a vacuum of knowledge that in the absence of reliable information, can be filled by rumours and allegations. In the game of rumours and vague allegations the fishing industry will always emerge as the loser. Only well documented and independently verifiable data can save the industry from public and scientific condemnation and from an economic catastrophe.
2.4 Real data versus model output
The management authorities on the other hand have at times used developments in information technology and computing power to cheaply replace proper fisheries science. Who needs to worry about real biological information, which is difficult and expensive to gather, when it is possible to simulate entire population life cycles using computer programmes, or when it is common practice to estimate environmental perturbations in the absence of any real environmental data and then use these in stock assessments?
In fact assessment models become so dominated by assumptions that in many cases they are more sensitive to subjective inputs, assumptions and "virtual data" than they are to the actual data. A South African example is the model assumptions about historic somatic growth rates for West Coast rock lobsters for a period over which no growth rate tagging data were recorded. Slight modifications of the historic growth rate assumptions can significantly alter the assessment model outcomes in ways that no reasonable change in the real input data would do. Another example is the role of natural mortality, more often than not a derived property rather than an empirical one, in assessment models. An example of the importance of natural mortality is the comparison of yield-per-recruit for trawled hake taken by trawl versus that taken by longline. The comparisons change dramatically under different natural mortality assumptions. The lack of real data allows different interest groups to lobby for natural mortality values favourable to their cause.
It takes a lot of training for fisheries biologists to accept that it is acceptable to have biologically senseless assumptions in assessments in order to maintain their mathematical integrity. Examples include the growth rates of fish at size zero and the size of fish at a negative age. It seems however that no amount of training has been able to prevent stock assessment mathematicians from presenting biologically nonsensical output as a plausible reflection of reality. Champion amongst these latter outputs are estimates of recruitment. These are rarely observed directly or measured, but are regularly peddled by mathematical modellers. To the non-cognoscenti they seem to be a kind of buffer that are used at the discretion of the mathematical modeller to improve model fits, and then interpreted as a fair statement about reality.
In a high profile South African stock assessment model presently in use, the recruitment of the West Coast rock lobster was estimated to have collapsed in the middle of the 20th century to a level well below the unexploited population replacement line, for a period of some 40 years. According to this model, the resource was being driven to extinction regardless of the presence of a fishery. This, despite the same model indicating that the resource spawning biomass was close to pristine at the time of the suggested "virtual" collapse in recruitment. The reason for this feature in the model output was apparently the need to explain a phase of increasing CPUE in the 1980s. Since the catch and growth rate data were regarded as empirical and given, the model was left to "its own devices" to explain trends in CPUE and size and sex ratios. The best-fitted model produced the aforesaid massive decline in requirement.
There is nothing wrong with such an approach as long as it is accepted that recruitment as used in the model is little more that a model-tuning artefact and that numerous other similar tuning variables could have been employed (under-reported catches, different levels of historic somatic growth rates, different levels of historic discard mortality, different degrees to which historic minimum size regulations were enforced, etc.). The first mistake is to fail to emphasize the arbitrary nature of the model assumptions. The second mistake is to fail to prevent these arbitrarily based model results from entering local fisheries science folklore. Experience shows that the longer the mistake is perpetuated, the longer it seems to take to rectify the situation and the longer that these fisheries folk tales resurface as objective facts at scientific presentations and discussions.
A disturbing phenomenon, a result of the hazy line where real data and virtual data meet, is that the model estimates referred to are presented to management bodies with the same weighting as real data. In the words of a South African industry member "thumb-sucked assumptions or model-fitted creations" get burnt into the institutional memory as real data or real events.
2.5 Double vision - same data two different interpretations
Another factor that for some reason seems to elude management authorities and scientists is that fishers do not as a rule optimize their fishing operations to achieve the maximum catch rate, but rather to achieve maximum economic rent (profit). Sometimes maximum economic rent coincides with maximum catch rate, but not as a general rule. When the two diverge, and a better size structure, species composition or fish quality is the overriding economic consideration, then the catch rate is bound to drop in response to changes in the logistics of the fishing operation. Unfortunately many scientists who are alert and responsive to real or perceived improvements in fishing efficiency (new electronic gadgets, skipper’s experience, new fishing gear, etc.) are slow, or in a state of denial when fishing becomes "inefficient" due to market driven logistic decisions by fishers. In such cases declines in catch rate are immediately linked to declining resource biomass and no attempt is made to tease out possible negative biases in CPUE.
Fishers, it should be noted, are often as guilty as scientists by their indifference or, worse, dishonesty in the manner in which they report their operations. Examples of such ‘oversights’ are failure to report discarded catches, the actual mesh size used, the target species or the true catch. There are however certain subtleties. A number of changes in the mode (gear, targeting strategy) of fishing are difficult to quantify and are therefore conveniently ignored by fisheries managers and scientists. A case in point is the common practice by fishers to move to less productive areas in order to catch favourable species or favourable fish sizes. Another is stopping fishing even when catch rates are high because company or factory daily processing quotas have been achieved. This fishing practice can increase the statistical weight (number of incidents) of low CPUE records in the database of catch rates.
3. A FEW EXAMPLES
3.1 Background
The following examples are case studies in which we were involved as scientific consultants to the fishing industry. They are described from our point of view. Many of the issues that are recalled here were, and still are, intensely debated. It is therefore likely that others involved in these debates will have different views and opinions. Nevertheless we have tried to be factual and impersonal, insofar as possible, in the presentation of the facts. Our purpose in presenting these case studies is to highlight the futility of failure to accurately record fishing data to the fisheries management authority, or alternatively to simply illustrate the pitfalls of paying insufficient attention to the strategic importance of data.
3.2 Pilchard fishing in Namibia
In 1994 a joint venture from South Africa and Namibia built a pilchard cannery at Walvis Bay, Namibia at the cost of about US$ 8 million. This investment decision was based on industry-wide pilchard catches of about 90 000 t a year since 1988. The decision-makers were apparently unaware at the time of biomass surveys indicating an alarming and persistent decline in resource biomass since 1991. As a result, the company was taken by surprise when in 1995, a year after the cannery was completed, the Namibian pilchard TAC was reduced from 125 000 t to 40 000 t. In 1997 a further 50 percent reduction in the TAC was introduced. Since then the average annual TAC has been about 30 000 t, 30 percent of the production figure upon which the construction of the cannery was based. As a result the cannery is underutilised with a significant loss of money.
Simple attention to some of the details of the available scientific data, coupled with an understanding of some basic principles of the population dynamics of pilchard stocks, may have led to a different decision. This is a common mode of operation by fishing companies around the world, i.e. ‘first create the catching and processing capacity and then try to get the fish to justify it’. In this case, as with others, this leads to undue pressure on scientists to produce more favourable assessments or on politicians to override conservative scientific recommendations. In the Namibian case there was another unfortunate development. As it became clear that Namibian scientists would not increase the pilchard TAC, applications were made for licences to fish pilchard in Angolan waters just across the border, in full knowledge that this was, and still is, part of the same pilchard resource.
3.3 Somatic growth rates in the West Coast rock lobster resource
West coast rock lobster growth rates have been recorded in South Africa since 1968. Up to 1987, 20 sites were sampled sporadically for growth. Growth rates are estimated by measuring, tagging and releasing a few thousand lobsters (mainly males) just before the moulting season. Tagged lobsters, which are later caught commercially, are measured for carapace length. From 1987 on a more regular tagging programme was established at six or seven regularly sampled sites. Lobster growth rates along the South African West Coast are known be strongly area dependent and it was felt that it would not be statistically appropriate to use tagging results from pre-1987 samples. As such, the growth rate index, which was used in size-structured stock assessment models, was based solely on post-1987 tagging data. In 1994, three changes to the way that the growth rate index was calculated were made.
i. The more scattered data from the much larger number (>20) of sporadically sampled sites for years 1968 - 1986 were incorporated into the analysis
ii. It was decided, based on aquarium studies, that lobsters can actually shrink in size and so a decision was made to include all zero and negative growth rates values which previously were discarded in the calculation of average annual growth rates,
iii. Until 1994 measurements were recorded to the nearest millimetre but thereafter measurements were recorded to the nearest tenth of a millimetre.
These changes in methodology introduced a number of problems. One is the difficulty of obtaining annual indices of growth rate when there are no records of growth rate for the majority of year and site combinations. Another follows from the simple act of including zero and negative measurements in the growth rate data set. The concern is that, historically, zero and negative growth rate records may have been lost, leading to a positive bias in the historic mean annual growth rate estimates.
A further potential difficulty with the inclusion of zero and negative growth at large values was that these may in fact be the result of a no-moult, since the lobster was either tagged, released and recaptured before moulting took place, or tagged released and recaptured after moulting had already occurred. This concern was raised by the industry but was rejected by the South African management authorities who informed them that the moult state was recorded by well trained inspectors when recaptured tagged lobsters were handed to them. Consequently, the original tagging datasheets were examined and it was found that the moult state of tagged and recaptured lobsters was not recorded in real-time by inspectors, but was in fact judged from the recorded growth rate level. In short the moult state was an assumption and not based on independent empirical data.
In order to test the possibility that lobsters, that had not moulted were included in the growth rate database, a statistical test of the relationship between time-at-large and growth rate was carried out. The test revealed evidence for the dependence of growth rate on time-at-large, suggesting that lobsters which had not moulted were included in the database.
A number of methods were tested in order to exclude no-moult cases from the data set. The method preferred by authorities involves excluding 70 percent of the data. The resultant plot of interannual growth rates shows high pre-1987 growth rates, and post-1987 growth rates which are some 70 percent lower.
To date there is still unhappiness in the industry about the growth rate index used in the assessment model. There has been no clear biological and/or ecological explanation for the large decline in somatic growth rates indicated by the available data, nor why this decline in growth rate seems to coincide with the time of a change in sampling methodology. From an economic point of view, the assumed decline in lobster growth rate in recent years has doomed the resource to an unproductive state that has serious implications for the annual TAC. From a scientific point of view the loss of 70 percent of the data is of concern. From a logistic and monetary point of view, a large amount of effort and money has been wasted simply because data were not properly recorded and sampling methods have not been consistently applied.
3.4 West Coast rock lobster - size structure data supplied by the industry
In the early 1990s the catch rate of the South African West Coast rock lobster (Jasus lalandii) declined significantly. As part of a scientific debate, which was initiated to explore the reasons for this decline and to propose remedies, it was suggested that the exclusive harvest of large lobsters above the 89 mm carapace length minimum size was putting too much pressure on this relatively small component of the resource, given the reasonable assumption of a large stock of lobsters below the minimum size. The industry, keen to pursue this argument, volunteered to conduct a survey aimed at estimating the quantities of lobsters below the minimum size. The industry was aware of the implications of the finding of such a survey, especially the positive nature of a result indicating large numbers of lobsters just below the minimum size. For whatever reasons the survey results indicated an abnormally large frequency of lobsters on the 88-89 mm size range. It seems that somebody decided to record lobsters between 80 and 88 mm as 88 mm lobsters. If anything this was not much more than a white lie. No attempt was made to increase the total number of lobsters sampled, rather some inventive data massaging. The result was that when the size data were plotted, a distinct horn was created just below 89 mm. The end result of this exercise was that:
all the data from the industry survey were discarded
the industry lost credibility
the entire survey program, which was initiated and initially designed by the industry, was taken over by the South African management agency, the Sea Fisheries Institute of the Department of Environmental Affairs and Tourism and
the scientific deliberations regarding possible changes in lobster minimum sizes was sidetracked and ultimately delayed, since the credibility of claims and information, which were provided by the industry as part of the debate, were now questioned as well.
3.5 West Coast rock lobster - use of catch rate data as a biological or an economic index
Since 1995 there has been a substantial increase in the catch rate of West Coast rock lobsters by a factor of about four. This high catch rate has been associated with a relatively low TAC in relation to the industry’s catching capacity. The high catch rate and the low TAC has transformed the entire way in which fishing companies have deployed their fishing effort. Since landing the TAC is not an issue, far greater emphasise has been placed on increasing the value of the catch and reducing fishing costs.
In other words the industry has been transformed from one which is volume driven to one which focuses on cost savings and product quality and value. As a result, fishing vessels have started to fish closer to home in order to save fuel and working hours, this, despite the fact that much higher catch rates can be achieved further afield. The sacrifice in catch rate in this case is insignificant in comparison to the operational costs saved. Fishers have also been instructed to target preferred lobster sizes - at present smaller lobsters are preferred as they fetch better prices in the Far East. This targeted fishing, which probably involves some selective discarding of large lobsters, also reduces the potential catch rate. Another issue associated with substantially improved catch rates are the problems caused for processing and marketing. If product comes in from the sea at a rate faster than can be processed or marketed, then skippers are instructed to restrict their daily catches. This is typically achieved by setting catch tallies which are considerably less than what could be caught if the total numbers of onboard traps are used. The problem is that skippers generally report the number of traps onboard and not the number of traps actual used and these erroneous trap values are then used in calculating the CPUE (catch (kg)/number of traps).
A further problem in the West Coast rock lobster fishery is that the CPUE calculations have no time unit. Consequently, changes in soak time which may affect catch rate are not recorded and presently the impact of different soaking periods on CPUE is not calculated.
The end result is the creation of contradictory perceptions about the resource, scientists versus fishers. Fishers say we never had it so good, scientists say, no, your catch rate trend is considerably less than you assume and there is no cause for celebration. Industry people are, of course, guilty by not accurately recording information (mainly the exact number of traps used) critical to a proper calculation of catch rate. However, on the management authority’s side there seems to be a level of indifference to the collection and interpretation of factors which may be negatively biasing catch rates. The reason is simple. There is no biological risk associated with management decisions based on the assumption that the catch rate is lower than its real value, since if anything, TAC allocations would be more conservative and resource depletion less. A much keener investigative approach to possible biases in catch rate data seems to take place however when the agenda is factors that may be increasing efficiency in the fishery.
3.6 Namibian hake - survey biomass estimates
In 1996, following a decline in the commercial CPUE index since 1995 and a similar decline in the annual biomass estimate from scientific surveys, the Namibian management authorities felt that there was a need to take corrective action on the TAC. The problem was that the standard stock assessment methods (a surplus production model and, later, an age structured production model) suggested that the Namibian hake resource was large and growing.
Though there is, often, some discrepancy between different methods of estimation, the gap in this particular case was large. In 1995, for example, the survey estimate put the resource biomass at about 330 000 t while modelling work suggested a biomass of between 2.5 and 3.5 million tonnes. The TAC implications of these different assessments were, of course, significant. Since, at the time, the annual Namibian hake TAC was calculated as 20 percent of the fishable biomass estimate from the scientific survey, the TAC for a biomass estimate of 330 000 t was 66 000 t, less than 50 percent of the annual catch at that time. On the other hand the estimates from the stock assessment models produced an MSY of about 350 000 t and indicated that the resource biomass was well above the biomass required to produce MSY - BMSY.
The commercial catch rate is notoriously unreliable since it suffers from numerous factors capable of influencing catchability[62] and hence biasing trends in CPUE in relation to resource biomass. Examples include an increase in fishing efficiency from the use of better fish tracking equipment, the use of gear with improved fishing efficiency and changes in fishing efficiency resulting from strategies to target particular size ranges.
Although the long term trend in commercial CPUE since 1990 was increasing, the recent decline in CPUE since 1995 was worrying. However the focus of attention in this particular debate was the interpretation of the annual fishing survey results involving the use of a dedicated research vessel, which at the time was virtually the only management tool for the Namibian hake resource. The prominence of this research tool raised some important questions about its validity, particularly whether it is possible for a combination of swept area and acoustic biomass estimates to be reliably used as an absolute estimate of resource abundance, or whether the survey results should only be used as a relative index of abundance. This debate led to a number of different investigations. One of these was to examine the quality of the model fit to a suite of observed data sets including the historic commercial catch rate, the post-independence catch rates, historic and post-independence catch-at-age and the scientific survey abundance estimates, and associated catch-at-age data, all using different values of q. A value of q = 1 (see footnote) means that the survey abundance estimate can be treated as an estimate of the actual abundance of hake. Values of q that are smaller than 1 indicate that the scientific survey’s estimate of abundance is negatively biased with respect to the true value. A possible reason for this is that only a certain proportion of the hake within the sweep of the net are caught and/or detected acoustically. It is possible to leave it to the modeller to decide whether the survey can be used to estimate the absolute hake biomass or, if not, what percent of the biomass is detected by the survey, by treating q as a quantity to be fitted in the mathematical model. In this particular case the best-fitted estimate of q was between 0.25 and 0.30, implying that on average the survey abundance estimate is only 25 to 30 percent of the true biomass.
The other analytical approach that was followed was to critically examine the survey methodology and its application in order to determine the direction and scale of biases. An unfortunate by-product of the debate about the survey was the lack of cooperation by the survey operators with industry scientists.
An interesting side-issue in this particular case was the way the data were finally provided to the industry. It was found that the database, which was used to collect and store the data, was old and fairly primitive, and incapable of handling even a moderate number of sampling stations (~ 2000). As a result the entire survey period from 1990 to 1997 was stored in two different databases, resulting in a confusing duplication of station numbers (survey locations). Furthermore, catch information and corresponding cruise information could not be extracted simultaneously and some of the data seemed to be corrupted (either in the original database, or as a result of the data ‘extraction’ process). In many cases the final extracted data set lacked column headings or had short, cryptic headings. Many of the files were not properly delimited or not delimited at all and existed as a continuous string of information without any headings. A considerable amount of work and ingenuity was required in order to make any sense out of these data. Old published reports were used as a guide to locate column breaks and headings and specialized code was written to automate the data pre-processing exercise since there were many thousands of records to reconstruct. A few weeks of hard work was required for this job and during this period all attempts to obtain assistance from the data managers were unsuccessful. When data were finally available in a readable format, a number of rather worrying features emerged.
i. The survey trawling gear had been entirely replaced during the survey period.
ii. Different skippers were used during the survey period.
iii. In many cases there had been serious mechanical problems with the trawl gear which was not reported to fisheries scientists and in some cases the catch and catch rate of these aborted shots had been included in the analysis.
iv. The survey had not been conducted during the same months of the year each year.
v. Large areas where hake was abundant (less than 100 m depth) had not been sampled at all and were therefore excluded from the total estimate of resource biomass.
vi. One of the most damning findings regarding the survey was that night-time drags produced consistently lower resource density estimates than day-time drags. The two Namibian hake species (Merluccius paradoxus and M. capensis) are known to migrate up the water column at night to feed. Therefore consistent differences in catch rate between night and day are not unexpected when using trawl gear as the only survey tool. However the survey operators claimed that no hake could escape detection by acoustic sensors and hence there should be, on average, no discrepancy between the day-time results and the night-time results. In reality, however, it was found that the day-time densities were consistently higher than the night-time densities, by an average amount of 48 percent. The most logical conclusion from this was that the acoustic device produced a negatively biased estimate of the density of hake above the headline of the survey trawl net.
In addition to these problems the scientific debate was confounded by attempts to over-interpret statistical fluctuations in the survey abundance as being due to specific recruitment, migration or fishing down effects. In general, particular annual fluctuations were being interpreted as real changes in biomass, while overall trends were being ignored.
An international workshop which took place in Swakopmund, Namibia in October 1997 tried to resolve the debate. By this time the TAC recommendation by the Namibian government scientists was 47 000 t, less than a third of the annual catch by the industry at the time (as a result of prior compromises between government scientists and decision makers).
The upshot of the workshop was that the majority of scientists felt it unlikely that the survey could accurately estimate the absolute abundance of the Namibian hake resource, and preferred an approach in which the survey abundance index was treated as a relative index of abundance only (i.e. this is where the assessment model estimates the value of q that is most appropriate for resource management).
General Linear Modelling (GLM), a method commonly used to generate standardised indices of abundance index by taking into account possible biasing factors such as the depth and month of fishing and the use of different sets of trawl gear, was used to analyse the survey data. The standardised abundance index failed to demonstrate a decline in the Namibian hake resource since 1990 although the final results did indicate a decline in the abundance of M. capensis since 1995.
The outcome of the debate was that a TAC of about 170 000 t was recommended and approved by the Namibian government. The following year the survey-based estimate of resource biomass was roughly 1.5 million tonnes. Since it was impossible to explain the sudden fivefold biomass increase in terms of recruitment, mortality and growth, the survey operators suggested that there had been a mass migration of hake from South Africa to Namibia. Coincidently, the abundance of hake in South African waters was the highest recorded for years and considerably less than the 1.2 million tonnes that was claimed had migrated into Namibian waters.
To date (2003) the Namibian hake resource has yielded annual catches of about 200 000 t and while the debate regarding the real state of the resource continues apace, the industry seems able to land its annual TAC without any difficulty.
This story has two morals.
i. The fate of the fishing industry in a modern, often hostile, political and scientific environment is ultimately dependent on the proper collection and interpretation of data whether this be survey data or commercial catch statistics.
ii. Views, ideology and personal prestige plays a significant role in what should be a purely technical exercise. The only way to ‘play the game’ is to get involved in complex analytical issues at a level of competence that is equal to, or superior to, that of other participants and interest groups.
3.7 The South African hake fishery - codend mesh size
In 1974 and 1975 the South African hake fishery was experiencing extremely low CPUE levels as a result of resource overexploitation aggravated by the presence of foreign fishing fleets off the coasts of South Africa and Namibia. Economic margins in industrial trawl fisheries for species such as hake are generally quite small compared to fisheries such as abalone, rock lobster, squid and sole as harvesting costs represent a substantial proportion of the final value of end-product. The decline in catch rate and the associated increase in harvesting costs that occurred, particularly between 1968 and the early 1970s, had a negative effect on the economic viability of the fishery. Industry representatives have confirmed that by about 1975 the industry was operating at a loss. The reduction in catch rate that occurred during the development of the fishery between 1955 and 1975 has been ascribed to a reduction in resource biomass due to overfishing, which resulted in sharp reductions in landings between 1972 and 1975, from 202 000 t to only 89 617 t.
The Sea Fisheries Research Institute of South Africa was the responsible fisheries management agency at the time. It recommended that the conservation of the resource would be best served by cutting the TAC and by increasing the mesh size of codends to allow for better escapement of sub-adult fish. The effective codend mesh size in the fleet, which included foreigners, was thought to be 90 mm, although a range of mesh sizes between 70 mm and 110 mm was in use. The recommended new minimum codend mesh size was 110 mm. This measure took legal effect on 1 July 1975. Prior to this time South African operators had been regulated by a minimum codend mesh size of 102 mm (the codend mesh size in the foreign fleet comprising a mix of Japanese, Spanish and Soviet vessels was not restricted by the 102 mm regulation (prior to 1975), and their codend meshes ranged in size from 70 mm to 120 mm, with an assumed average codend mesh size for the period prior to 1975 of 90 mm).
Of course, the additional escapement of small fish associated with the use of a larger mesh size was expected to lead to substantial declines in the commercial catch rate. Coupled with this, a fairly sharp increase in the mean size of hake landed was expected. However contrary to the logic underlying these expectations, two years later the following observations were made (the larger mesh size regulations took effect in 1976).
i. The hake CPUE increased by 15 percent between 1975 and 1976 (4.66 to 5.35).
ii. Between 1975 and 1976 the mean size of captured hake declined by 27 percent.
iii. The total amount of hake landed between 1975 and 1976 increased by 61 percent, from 89 617 t to 143 894 t.
The reason behind this phenomenon was well known to management and industry personnel involved in the fishery. The economic impact of the legislated increase in the codend mesh size could not be absorbed by the industry without seriously threatening its economic viability. It was not possible to continue to use the 102 mm codends since there was effective enforcement of the minimum codend mesh size of 110 mm. The only solution for the trawlermen and their skippers, whose earnings were directly linked to their fishing performance, was to make use of so-called "liners" and "panty-hoses". These are small mesh inserts placed inside codends which reduce the intended escapement properties of the legal 110 mm mesh codends.
Of course, it would not have been possible to exactly replicate the performance of the old 102 mm mesh codends with the combination of 110 mm mesh + liner, and in all likelihood the liners resulted in an effective mesh size considerably smaller than 102. mm. It is well known that the use of liners was widespread and that the only company that attempted to comply with the new regulations went out of business. It is therefore quite conceivable that the combination of liner and 110 mm codend would result in (a) a larger catch rate than the 102 mm codend and (b), a smaller average size of hake landed, hence the observed increase in catch rate when the legal codend mesh size was increased.
The only people who were unaware of what was happening were the stock assessment scientists. For them, as is often the case, the new catch rate information was just new data. It is therefore not particularly surprising that, without knowledge of what was really happening at sea, these scientists concluded that the catchability of the resource (availability of fish to the fishery) was, paradoxically, larger at the 110 mm mesh size than at the old effective size of 90 mm (approximate value). They further concluded that no effect or benefit for the resource could be detected as a result of the use of 110 mm codends.
Although one is tempted to treat this as yet another case of scientists being mislead by poor data, the implications of this result was critical to the interpretation of future catch rate data. This is because, as a result of this analysis, the commercial catch rate time series was never corrected for the use of a mesh size considerably smaller than the assumed 110 mm. The problem for the industry was that:
i. skipper logsheets reported the codend mesh size as 110 mm or larger, despite the illegal use of codend liners and
ii. as catch rates started to improve (due to a significant cut in the TAC and the exclusion of foreign fleets from the South African EEZ after 1978) and the market demanded larger fish, the industry phased out the use of liners. This resulted in an increase in the mean size of fish caught and a dampening out of the rate of increase of the CPUE.
The result was that analytical work, oblivious to these important processes, concluded that the hake resource would not achieve certain rebuilding targets unless TAC reductions were implemented. Although, after much debate, the aforementioned TAC reductions were averted, the scientific management of the fishery has never really recovered from the impact of this debate. No amount of analytical work can undo the impact that the unreported and unauthorised use of liners had on the data used in the assessment process. Whatever corrections are implemented have to be conservative because, in the absence of real data, assumptions about when, where and for how long liners were used needs to be conservative in order to reduce the risk of attributing too much of the observed CPUE trend to this effect, thereby missing important biological signals about the resource. As a result, to date, there are still a number of rather dispirit views about the State of the South African hake resource in the local marine scientific community. This has had an effect on TAC recommendations, at great economic cost.
Interestingly, the South African hake industry is at present engaging in another codend exercise that may have profound implications for its scientific management. This time however, the action is completely legal. Some skippers, in response to demand for larger fish due to lower processing costs and better prices, have voluntarily increased codend mesh sizes to as large as 170 mm.
Unfortunately, for a range of reasons, most skippers never report the actual mesh size used, even when this is entirely legal. This unreported increase in mesh size will probably lead to a reduction in catch rate with the potential to trigger the same vicious cycle all over again. That is, fisheries scientists are likely to use catch statistics in their assessment models oblivious to significant processes that have taken place at sea. The decline in catch rate is then interpreted as a decline in resource abundance and the industry will again have to explain to scientists that they have misreported their fishing gear information, and that the decline in catch rate is most likely the result of the increased mesh size and not a decline in resource abundance. This is going to sound too much like a fisherman’s story, looks bad, causes a loss of credibility by the industry, and worse, it makes the stock assessments unreliable and unnecessarily conservative.
3.8 Trap restrictions in the South Coast rock lobster fishery
The South African South Coast rock lobster (Palinurus gilchristi) fishery began in 1973. Catches in this fishery increased dramatically from 400 t (all tonnages are in tail weight) in 1974 to close to 1 000 t in 1975 and then decreased to about 150 t in 1980. After the low catch of 150 t in 1980, catches increased, and in the 1984/85 fishing season a TAC of 450 t was set. Since the introduction of the 450 t quota in 1984/85 the fishery has been regarded as one of the most stable fisheries in South Africa despite the absence of minimum size restrictions and restrictions on the harvesting of females.
South coast lobsters are caught using small baited plastic traps attached to a long line (about 150 traps per line with line lengths of about 2 000 m). Initially each boat carried between 1 000 and 2 000 traps but this increased over time. Catches per trap in the South Coast rock lobster fishery are far less than in the West Coast rock lobster fishery and on average each trap catches about one lobster per three traps, compared to tens of lobsters per trap in the West Coast rock lobster fishery.
In the late 1970s new regulations restricting the number of traps per vessel to 1 800 were introduced. Not unlike the response by skippers in the trawl fishery (see above), skippers in the South Coast rock lobster fishery chose to ignore these regulations and continued to fish with a substantially larger number of traps. Nevertheless, as with their colleagues in the trawl fishery, skippers in the South Coast rock lobster industry only reported the legal number of traps. In 1987, following pressure by the industry, the restriction on the number of traps per vessel was removed.
With the removal of trap restrictions, effort reporting by the industry has gradually become more reliable. Since the CPUE of a set is defined as the catch divided by the number of traps, this "change of heart" by skippers has "increased" the number of reported traps with a concomitant decline in the CPUE. In 1991 this apparent decline in catch rate led the South African management authority to recommend a 10 percent reduction in the TAC. The industry were forced into the rather embarrassing situation of having to advise the authorities that the incorrect number of traps had been reported historically. Analyses demonstrated that if one uses the correct number of traps per vessel in the calculations (rather than the reported values), there is no real trend in the catch rate time series. Only after much debate and after the original skipper logbooks, accompanied by affidavits from the skippers, were used, was it agreed that the data from seven vessels, for which it was possible to verify the real number of traps used, would be used to determine CPUE trends.
This example, which is probably typical of many other fisheries, demonstrates again how skippers who have little appreciation of the role that logbook data plays in the overall management of their resource, can cause considerable damage to themselves and to the resource by trying to manipulate or "outsmart" the authorities. As you will see from the last section of this paper, the 1991 debate referred to here was just the forerunner for much more serious things to come, where again, short term economic considerations regarding the application and reporting of fishing effort almost brought this industry to its knees.
3.9 Effort reduction in the South Coast rock lobster fishery
Between 1991 and 2000 the standardized CPUE in the South Coast rock lobster resource fell by about 70 percent. During the same period the total fishing effort, measured as the number of trap-hours, where hours refers to trap soak time, increased approximately threefold. There are two main hypothesis about the processes underlying this trend.
i. Biological explanation: The escalation of effort was, and is, the industry’s response to its inability to land its quota at the pre-1990 effort level. In other words the resource did indeed decline as suggested by the CPUE data.
ii. Explanation in terms of a change in fishing practice: Following the removal of trap restrictions, the number of traps used in the fishery increased dramatically as skippers competed for a maximum share of their company’s quota. This led to effort saturation in which the efficiency of traps declined, reducing the CPUE.
The first option should not be dismissed lightly. It is quite common for fishers to explain negative trends in CPUE as anything but a decline in resource biomass. However, since the industry operated between 1984 and 1991 with a TAC of 450 t and with no indication of a decline in CPUE, and since the acceleration in fishing effort preceded the decline in CPUE (normally, in a TAC control fishery, increases in effort follow declines in CPUE, rather than the other way around), there was reason to suspect that factors other than a reduction in resource biomass may have been involved.
The case for Option 2 demonstrates how actions by the industry, which are indifferent to the scientific process and to the way data are used in management, can lead to significant costs for the industry. Option 2 is based on the premise that the removal of trap restrictions in the late 1980s, coupled with a volume-based skipper commission system, induced skippers within the same company to adopt a race-to-catch fishing strategy, similar in many ways to fisheries in which there is an overall TAC, no individual quotas and the fishery is closed when the TAC is reached.
An aggravating factor was the purchase of large vessels by one of the fishing companies, Hout Bay Fishing. Each of these vessels was capable of carrying 6 000 traps, which is about three times the average of the other vessels in the fishery. Suddenly it made economic sense for skippers to load and set many thousands of traps in order to increase their income. This proliferation of traps had a number of consequences. One of these was that although the catch-per-vessel-per-day increased by about 30 percent, the catch per trap decreased by about 70 percent. An increase in the vessel’s catching efficiency a day was the benefit sought by the skipper, but the impact on the trap CPUE had deleterious consequences for perceptions of the resource. In concept, the increase in the catch per vessel was achieved by increasing the number of traps worked per vessel. In order for this to be possible when there are declines in the trap catch rate, one simply has to outweigh any declines in trap efficiency by working a sufficiently large number of traps per day, or by increasing the soak time of traps. A common approach for a vessel working, say 2 000 traps a day using a soak time of 24 hours, is to switch to working 2000 traps per day at a soak time of 48 hours - this requires twice as many traps to be put in the water, but the additional catch due to a longer soak time offsets losses due to effort saturation effects, which may reduce the efficiency of traps.
The rationale underlying the process of effort saturation was that if the density of traps is increased, then, because more traps are competing for the same number of lobsters (assume similar areas for the purpose of a comparison), the catch per trap will decline, even though the total catch of all traps in the same area may be the same. This general effect can manifest itself if more traps are used per set, or if there are more sets in the water in an area even given the same number of traps per set, or even if sets are more frequent in time in a particular area.
In the situation where skippers start servicing many more traps than can be handled with a soak time of 24 hours by doubling, tripling or quadrupling the number of traps in conjunction with 48, 72 or 96 hour soak times, a large proportion of the ocean suddenly becomes unavailable to fishing, simply because of the physical presence of traps there already. As a result skippers are forced to start fishing more marginal areas where catch rates are not as good, or they have to continue fishing in the same area long after catch rates have declined to a low level, simply because alternative grounds are already occupied.
This effect of an increase in the number of traps on trap efficiency is referred to as effort saturation. The industry proposed that these factors may have caused a reduction in the catch per trap unrelated to changes or possible declines in resource biomass. Despite the fact that scientists failed to reach agreement on the reasons for the decline in CPUE during the 1990s, and despite the fact that a large scale experiment on effort saturation conducted during 1998 was inconclusive, all parties involved in resource management agreed that a reduction in fishing effort of between 30 and 40 percent, i.e. to its level in the 1990/91 fishing season, was desirable.
The responsible South African management agency, Marine and Coastal Management (M&CM), supported the proposed reduction in fishing effort because of their suspicion that excess fishing capacity in the fishery was being used for illegal fishing.
The industry supported it because it made economic sense (why finance an effort war between skippers), because it was clear to them that the fishery was over capitalized and because they held a strong opinion that effort saturation was negatively biasing the CPUE index.
The exact means of reducing fishing effort became a contentious issue and a number of mechanisms including a limit on the numbers of boats, a limit on the numbers of traps, closed seasons, fishing days and sea days were considered. Following a protracted process of consultation and negotiation, both the industry and M&CM agreed that each company would be allocated a fixed maximum number of sea days, calculated to be sufficient to land the company quota based on the stock assessment results obtained by assuming that effort saturation was indeed present in the fishery. Linked to this was agreement on a TAC of 340 t that was 40 t larger than the 300 t that would have been allocated based on stock assessments that ignored the possibility of effort saturation.
If the industry’s claim about effort saturation was correct, then they would experience no difficulty landing their quotas and hence easily land the entire TAC of 340 t. If, however, the industry was wrong, it would fail to catch its allocation and the sea-day limitation would become active, protecting the resource from overexploitation. As a result just before the 2000/2001 fishing season the number of sea days were restricted to about 60 percent of the previous years average.
The results were dramatic. First, the duplicity of Hout Bay Fishing, the company that introduced large vessels in the early 1990s, was exposed. This company was apparently using its excess fishing capacity to harvest extra-quota amounts of lobsters. The restriction on the number of sea days made it impossible for Hout Bay Fishing to land these additional amounts of lobsters and hence to sustain its oversized fishing fleet. They therefore challenged the new permit regulations in court. Many dramatic events accompanied this legal process. Hout Bay Fishing’s offices were searched and sealed off by police units, a number of employees and managers were arrested and charged, fisheries inspectors who aided and abetted the illegal fishing process were arrested and charged and numerous other irregularities by Hout Bay Fishing involving other resources were exposed. The company was closed and legal action was taken against its owners. On a more positive note the remainder of the fleet experienced no problem catching its share of the 340 t TAC with the considerably reduced number of sea days.
Three years later the annual TAC was increased after two years of significant increases in the annual catch rate - the first increase in the TAC in 20 years. One of the explanations for this recent increase in CPUE is that it was a response by the resource to the elimination of Hout Bay Fishing’s illegal catches, which were as much as 30 percent of the total TAC. However, the increase in CPUE seems to be more dramatic than what could be explained by a reduction in fishing mortality of this degree. While it is still not possible to conclusively prove the effort saturation theory, it cannot be dismissed, and indeed modelling scenarios which include effort saturation seem to produce a better fit than those which do not.
This last example illustrates the main points of this article, since it includes almost all the elements of previous examples. It demonstrates the critical role that good quality data, coupled with innovative analytical approaches, can play in reducing costs in the industry (a much leaner industry is still able to land the TAC), changing scientific perceptions and perhaps most importantly, prevent illegal fishing. It demonstrates (a), that fishers who are ignorant about the basic analytical principles of fisheries management can ruin a highly regulated industry simply by "tricking" the scientific management machinery and (b), that management authorities should be willing to consider and to incorporate complex logistic dynamics and processes in their analyses. Fishing is a business whose objective is to maximize profits and not catch rate. As such it is inconceivable to assume that fishers who engage in fishing activities that reduce catch rates will do so unless this increases their income. However the most important conclusion from this story is that the fishing industry has much more to gain by participating honestly in the technical management of its resources than to lose.
4. SOME CONCLUDING REMARKS
The moral of the above is simple and straightforward.
i. Fishers ...
. should stop treating operational data as a private property whose only use is to give them the edge while competing for best fishing performance.
.. should start to recognize that data play a significant role in the management of the resource which sustains their livelihood and also to understand that misreporting of data for whatever reason (carelessness, intentional, or ignorance) is likely to hurt them when decisions are made with regard to their catch allocations.
ii. Commercial managers ...
. should realize that the industry has much more to lose than gain by not reporting data accurately. Managers should adopt a greater culture of openness with regard to operational data in their possession, even if this carries a risk (often more perceived then real) of exposing themselves to their competition.
.. should encourage or enforce a culture of accurate recording and reporting among their skippers. These data should be the company’s property (not the skippers’) and should be used strategically for the company’s internal needs and scientifically for the stock assessment and management process.
.. should realize that active and accurate reporting of their data will do a lot to reduce the general hostility and distrust from the general public toward the fishing industry.
.. should start to introduce scientific information and scientific know-how into their daily decision-making process. Commercial decisions made without scientific insight can result in uneconomic investment in infrastructure and inappropriate allocation of resources.
.. should ensure that analytical techniques that are commonly used in other commercial sectors, such as data warehousing, data analysis and data mining become an integral component of the company’s management.
.. should accept that the scientific process is the only objective tool that can, and should, be used in the stock assessment process. They should engage in the scientific process in good faith and accept its outcomes.
iii. Government scientists ...
. should accept that commercial fishing is a business and is run to make profit. These do not always coincide with catch performance considerations.
.. should realize that it is not the duty of fishing companies or fishers to prove their case when their arguments could lead to a less conservative management regime. Scientists should proactively explore ways and technical methods to quantify arguments that are relevant to the scientific process, regardless of their potential outcomes.
.. should not feel threatened by the industry’s demand for a completely open analytical process. They should subject themselves to the same "rules of engagement" that they demand from the industry with regard to accountability, access to information and acceptance of the scientific outcome.
.. should not rely on modelling work as a "cheap" replacement for the on-going acquisition of accurate data and biological knowledge.
.. should make a considerable effort to translate the scientific jargon and the scientific process to a language which is understood by all stakeholders regardless of their formal training.
.. should recognize that there is a fundamental concern regarding the credibility of the scientific process due to the perception that its is often politically driven. Scientific data and scientific tools should not be used to promote political agendas when such agendas contrast with scientific understanding and experience.
.. should separate the management process from the scientific process. Government scientists should provide information and advise technically but should not be directly involved in the formulation of management decisions.
iv. Some general remarks regarding the use of new technology in the fishing industry
The fishing industry should start seeing technology not only as a means of catching more fish but as a means to:
. streamline its operation by cutting costs and making fishing operation profitable without the need to catch too many fish
.. reduce environmental damage which, in addition to the ecological benefit, will also help to give the industry respectability in the eyes of an increasingly conservation-conscious public
.. optimize targeting and gear selectivity thereby reducing unintended bycatch and un-necessary discards
.. add value to fish products so that the total catch value can be increased without increasing volume AND
.. most importantly, bring twenty-first century data technology to both sea and shore operations in order to improve knowledge and management of fish resources.
5. LITERATURE CITED
Myers, R. & B. Worm 2003. Rapid worldwide depletion of predatory fish communities. Nature 423:280-283.
Roberts, C.M. & J.P. Hawkins 2000. Fully-protected marine reserves: a guide. WWF Endangered Seas Campaign.
M. Segura, M. Ramírez, A. Guardia and J. Atiquipa
Instituto del Mar del Perú
P.O. Box 22, Callao, Perú
<[email protected]>
<[email protected]>
<[email protected]>
<[email protected]>
1. INTRODUCTION
The abundance and availability of marine resources of commercial interest was one of the main reasons for fishing activity to be considered as an activity of common use or direct access in the world. The tendency of landings through time shows constant increases from 20 million tonnes a year in the decade of the 1940s, increasing to 60 million tonnes a year in the 1970s. The following years saw an annual rate growth of 6.5 percent as catches rose to 80 million tonnes in the 1990s.
These harvests led to a shortage and decrease of the catches causing the principle of free access to marine fisheries to be subject to changes, in particuliar by special influence of developing countries in developments that defended their Exclusive Economic Zones (EEZ) and the right of jurisdiction on the resources up to 200nm offshore. This right was recognized in the 1980s through the Conference (UNCLOSIII) giving rise to the United Nations Convention on the Law of the Sea (LOSC).
2. NEED TO IMPLEMENT A MONITORING SYSTEM OF THE FISHING FLEET
The present situation of populations of some marine resources in Peru, such as anchovy and sardine, is considered to be that of full exploitation and this is the main reason for the need to undertake good management programmes. Although the Instituto del Mar del Perú (MARPE) undertakes intensive monitoring of the fishing fleet, with catch sampling in ports or observers on board, it is not possible to fully monitor the fleet to determine fishing grounds and the sizes of the different fish species that are caught in the different areas. For this reason the Ministry of Fisheries opted to establish a remote satellite system of control that allows permanent surveillance of the whole industrial fishing fleet operating in Peruvian waters. Another reason for establishing this monitoring system was the conflict or interference, between the industrial and the artisanal fleets that compete on the same fishing grounds, and the invasion of the industrial fleet into prohibited fishing areas.
3. JUSTIFICATION
The merits of a satellite monitoring system of fishing fleets is noted in the FAO Code of Conduct for Responsible Fishing and Sustainable Fishing Resources and such a system was established in Peru following the Supreme Ordinance N° 008-97-PE of the Peruvian Ministry of Fishery. It is directed mainly to the industrial larger scale fishing fleet operating in Peruvian waters under both national and foreign flags (R.M 100-2001-PE). Its purpose is to contribute to the adoption of fishing management measures and the responsible utilization of marine resources, as well as to complement the monitoring actions, control and surveillance of fish harvesting.
The service of monitoring the fleet is undertaken through the company CLS-ARGOS from France, which has a regional office in Lima, Peru. The owners of the fishing vessels assume the cost of the service. Ships are subject to fines if they enter a prohibited fishing ground. For example, the purse seine fleet dedicated to harvesting anchovy (Engraulis ringens), sardine (Sardinops sagax), jack mackerel (Trachurus symmetricus murphyi) and mackerel (Scomber japonicus peruanus) is forbidden to operate within five nautical miles of coast because this area is reserved exclusively for artisanal fishing operations. Another task is to direct and control ships with foreign flags outside of the 30mn limit from the coast and beyond a similar radius around offshore islands.
The system began in Peru in 1993 with the monitoring of the Japanese and Korean fleet operating with the Peruvian EEZ, which were targeting giant squid. The system was expanded to other fleets in 1999.
4. METHODOLOGY OF THE SYSTEM OPERATION
The fishing fleet monitoring system, ARGOS, operates using NOAA satellite platforms (Figure1). When NOAA satellites pass over the area of interest they receive data on the geographic position, tracking, course, speed of each ship, date and time sent from a transmitter installed on board the ship. The information is re-transmitted to the regional station in Lima, Peru after the passage of the satellite, approximately every 48 minutes, and is simultaneously sent to the respective users: the Vice-Ministry of Fishery, IMARPE and Coast Guard (Navy) via Internet. The data are then stored in a ORACLE database.
|
FIGURE 1
|
In IMARPE, the data are entered with software [MacPesca, MapInfo] and are classified by fleet type (purse seine, trawling, jigging, etc.). Then, different analyses are carried out for the determination of the locations of fishing areas, spatial distribution of marine resources and to correlate fishing activities with some oceanographic parameters.
At present around 985 vessels are monitored with the ARGOS system is and includes purse seiners, trawlers and squid jigging vessels, these last operate under foreign flag. It is possible for the system to handle another 350 purse seiners. In addition, the ARGOS system has available a transmitter Psion for handling reports.
5. INVESTIGATIONS RESULTS
5.1 Fisheries covered
Since 1999, when the transmitters were installed on board the first ships and the subsequent expansion of the system until the year 2000 was completed, and subsequently to date, it has been possible to store a great quantity of information about fishing grounds. This has resulted in many interesting results during these four years about the activity and behaviour of the purse seine fishery targeting anchovy, the bottom trawl fleet for hake (Merluccius gayi gayi) and vessels jigging for giant squid (Dosidicus gigas) in relation to the distribution and variability in abundance of these species and oceanographic conditions. The following section shows results for the hake and giant squid fishery between 2000 and 2002.
5.2 Hake fisheries
The information gathered between 2000 and 2002 has allowed IMARPE to estimate the catch per unit of effort (CPUE) of hake in tonnes an hour (t/h) and tonnes per distance towed in nautical miles (t/nm). These data have shown a continuous fall in yields. The results show a minimum in the CPUE to have happened in October 2002 (0.3 t/h and 0.1 t/nm). The highest CPUE for smaller tows and distances occurred in January 2001, and was 8.2 t/h and 3.2 t/nm, respectively (Figure 2).
In regards to the depth strata where the bottom trawling fleet operated, it was found that the behaviour of fishing showed a seasonal pattern throughout the year that had not been appreciated. The biggest number of fishing operations was found to be between the nearshore and the 200 m isobath. However, a slight increase in operations of the fleet was observed in the depth range starting from 200m (Figure 3). The results showed the delicate situation of the hake population during these years and that if protection measures are not adopted, the biomass of this resource would be seriously affected.
|
FIGURE 2
|
|
FIGURE 3
|
5.3 Giant squid fishery
The giant squid industrial fishery in Peru has been carried out by Japanese and Korean flagged vessels since the early 1990s. The results of the satellite monitoring of these fleets between 2000 and 2002 show that their activity has varied over the fishing grounds from north to south, as a consequence of a warming period during the years 2000 to 2002. The centres of the fishing locations for these three years was located around the coordinates (05.2°S and 81.9°W; 13.8°S and 78.5°W), (14.9°S and 76.8°W) and (1.3°S and 76.3°W) in SST average values of 18.7 °, 19.1 ° and 20.2°C, respectively (Figure 4).
The concentrations of the fishing operations were related to the locations of the coastal masses of cold waters (SST between 17° and 23°C, salinity <35.1 ‰ ups). However the fishing localizations were not related to the best areas of chlorophyll concentration but rather around the borders of these areas, mainly in concentrations of 1 to 2.5 mg/l (Figure 5).
6. CONCLUSION
As a preliminary conclusion we believe that although giant squid is a pelagic resource with a very particular vertical behavior, moving to great depths at different times of the day and tolerating wide ranges of temperature, it also shows wide horizontal migrations that are possibly associated with oceanographic changes that affect to its food distribution.
|
FIGURE 4
|
FIGURE 5. Relationship between giant squid distribution with water masses and chlorophyll a
|
[62] Catchability in this
paper refers to that fraction of the fish encountered by the gear that is
actually caught, i.e. the vulnerability to capture - Ed |
![]()
![]()
![]()
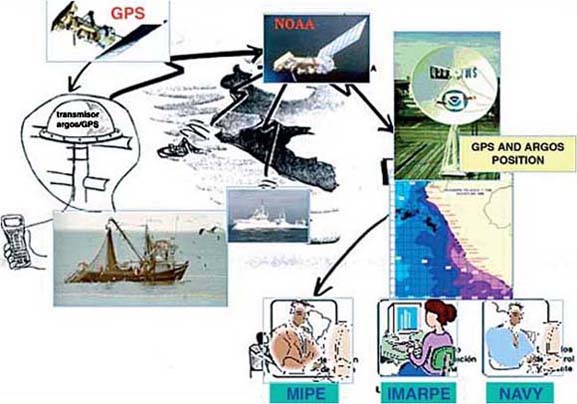
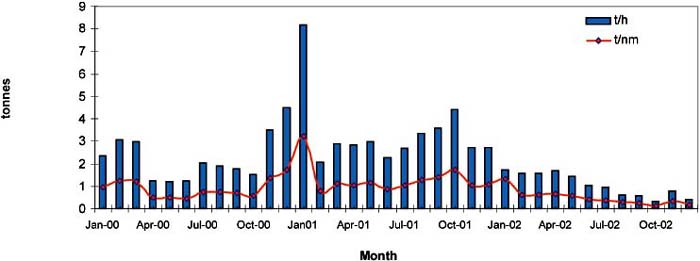

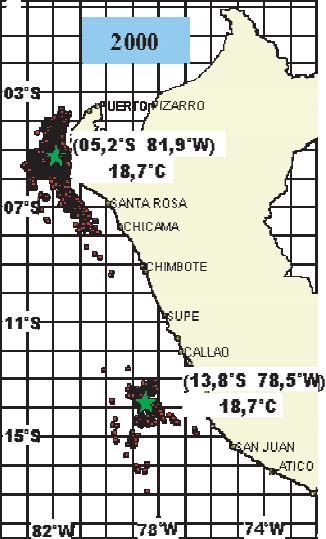
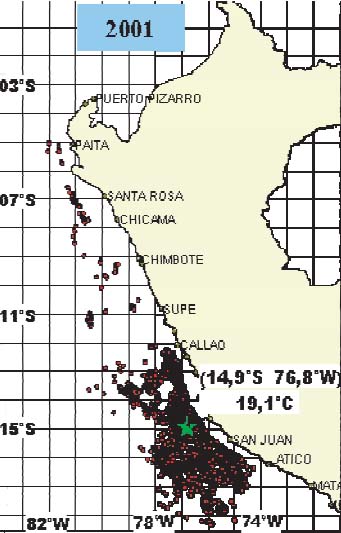

)