![]()
![]()
![]()
J.A. Boutillier and G.E. Gillespie
Pacific Biological Station, 3190 Hammond Bay Rd
Nanaimo, British Columbia, Canada V9T 6N7
<[email protected]>
1. INTRODUCTION
Developing a sustainable fishery requires that fisheries managers have a good understanding of the social, economic and biological issues and risks. There are numerous examples of fisheries developing rapidly in response to the economic factors, the "supply and demand" side of the equation, without either an understanding or plan of achieving an understanding of the social and biological consequences. This often results in a "boom and bust" type development with severe social and biological consequences. An example of this in British Columbia was the rapid growth and decline of the abalone fishery. Extraction of this resource is now prohibited to all users and the species is now listed as threatened under Canada’s recently implemented Species at Risk Act (Jamieson 1999, Campbell 2000).
In 1990, Fisheries and Oceans Canada (DFO) put a moratorium on new invertebrate fisheries on the Pacific Coast of Canada because there were not the resources necessary to ensure that new fisheries had management and assessment frameworks in place that would allow them to develop in an economic, social and biologically sustainable manner. In 1995, the moratorium was lifted and a Memorandum of Understanding (MOU) on the Development on new fisheries was signed between the Federal Government of Canada and the Provincial Government of British Columbia. The goals of this MOU (Phillips and Lauzier 1997) were to:
i. diversify British Columbia fisheries and seafood production to ensure conservation of stocks and realize the optimal sustainable use of fisheries resources and fish culture
ii. encourage a competitive business approach to fisheries and aquaculture diversification, and maximize marketing opportunities
iii. diversify the seafood sector in British Columbia to promote employment opportunities, foster community development and secure social and economic stability and
iv. encourage public and private sector cooperation in fisheries diversification, including new arrangements between regional communities, harvesters and growers.
To achieve these goals, DFO developed a Pacific Region draft policy on New and Emerging Invertebrate Fisheries. This draft policy was produced to provide staff and proponents with a consistent, inclusive approach in the development of management rules for new and emerging invertebrate fisheries. Hand in hand with the development of this policy was the adoption of a phased approach (Perry, Walters and Boutillier 1999) to the biological assessment framework. The draft regional policy along with elements of the phased approach to assessment have subsequently been incorporated into the approved national policy and a regional implementation plan for new and emerging fisheries.
This paper outlines the processes that were followed and evaluates the success of the implementation of these policies in developing management and assessment frameworks for a deep-sea fishery for the grooved Tanner crab (Chionoecetes tanneri). It will also comment on the unique problems that arise because of the deep-sea nature of this fishery.
2. MANAGING THE PROCESS
There are a number of economic, social and biological principles within the implementation framework that form the basis for a managed process for development of a new or emerging fishery. From a social and economic perspective the principles deal with issues related to aboriginal people’s access; transparency of the management procedures for allocation; and shared accountability and responsibility for insuring a sustainable fishery. The biological principles place conservation as the primary objective while ensuring that a precautionary approach is used in fishery development. In addition there is to be full accounting of all the ecological impacts of the proposed fishery. Finally, the framework requires a scientific base for assessment of the impacts of the fishery on the target species and the associated ecosystem.
The framework outlines a four-phase process to ensure that the development of a new fishery is consistent with the above biological principles. This process was originally described and adapted from work published by Perry et al. (1999). The phases of development areas follow:
i. The Review Phase. This phase entails summarization of all known biological, distributional and fisheries related information on the target species and from similar species from similar habitats. A thorough review of the literature and all available data sources should provide some of the basic parameters necessary to develop a cautious, risk-averse approach to the development of a new fishery.
ii. The Experimental Phase. This phase entails conducting experimental fisheries to assess abundance, distribution and productivity to determine if the stock and ecosystem can be exploited in a sustainable manner. This includes acquiring information either lacking or identified as potential risks during the Review Phase. This phase can be designed to meet a variety of needs including: testing assessment methodologies, evaluating the impacts of the fishery and adapting management strategies to test biological assumptions.
iii. The Exploratory Phase. This phase consists of exploratory fisheries outside the experimental areas to assess whether the stock can support an economically viable fishery.
iv. The Commercial Phase. This is the formal establishment of a fishery by developing and implementing a comprehensive integrated fishery management plan.
Upon completion of the Review Phase, a set of recommendations are sent to managers through the Pacific Scientific Advice Review Committee (PSARC). This information is then distributed to the fishing industry and First Nations’ stakeholders along with an invitation to submit requests to participate in the experimental phase. The successful candidates then work with the Provincial Government and processing sector to develop a processing and marketing strategy and enter into the Experimental Phase of the fishery. The results of the experimental components of this phase are evaluated through the PSARC and the assessment framework is modified if the information does not answer the original questions or additional questions have arisen as a result of the new information. At the end of the Experimental Phase there is either a recommendation for expansion or rejection of requests for the fishery to enter the next phase. As the fishery progresses through the successive phases, additional requests for participation are solicited. During the selection process, priority is given to those that meet the social principles outlined as well as recognition of the contribution of the initial proponents if they are still interested in pursuing the fishery.
3. THE CASE STUDY
3.1 Present status
The grooved Tanner crab fishery is presently in the experimental phase of development and as such the review can only deal with the progress to date. At this point in the process the only participants in the fishery are the Tanner Crab Fisherman’s Joint Venture Association (TCFJVA), a collective of several interested fishers and other industry proponents.
3.2 The review phase
In 1997 Phillips and Lauzier (1997) summarized the biological, habitat and distributional information as well as information from other jurisdictions on fisheries sustainability and management strategies employed for this and another congeneric species, C. angulatus. This review led to a suite of recommendations that provided the context for the Experimental Phase in the development of this fishery. Critical to the development of the Experimental Phase (Boutillier et al. 1998) were the findings and recommendations as follows.
i. Fisheries for these and other related animals have a strong history of failure.
ii. Conventional management control systems that solely depend on size, sex and season (the 3Ss) decision rules are successful with respect to growth over-fishing but do not adequately address recruitment over-fishing concerns.
iii. Assessment of fishery dependant catch-per-unit-effort data would benefit from the early imposition of standardized fishing gear.
iv. All sources of mortality must be accounted for including bycatch of crab in other fisheries in the area.
3.3 The experimental phase
A research assessment framework for the Experimental Phase of the development of a grooved Tanner crab fishery was then proposed and peer reviewed (Boutillier et al. 1998). The intent of the framework was to address the issues raised in the Review Phase and develop the fishery in a way that met the biological principles outlined in the Policy above. The FAO guidelines on the precautionary approach to capture fisheries (FAO 1995) state that "research is required to help formulate biological objectives, targets and constraints regarding the protection of habitat, the avoidance of fishing that significantly reduces population reproductive capacity, and reduces the effects of fishing on other (e.g., non-target) species." In trying to develop an assessment programme that adhered to the Precautionary Principles, the framework focused on providing a better understanding of the resource, a better understanding the fishery effects, a validation of the assessment methodologies and pre-defined decision rules.
It was important in the management of the implementation of the Experimental Phase of the fishery to have a set of pre-defined conservation decision rules. For the targeted Tanner crab fishery these decision rules included: limited entry; gear type restrictions; expected production potential estimated within defined limit and target reference points; the 3Ss restrictions; limited area openings; data and observer requirements; and a reporting structure.
An assessment framework for the Experimental Phase was designed which used four sources of data to address questions regarding
i. distribution and abundance of the grooved Tanner crab
ii. identification and, where possible, quantification of the effects of direct and indirect fisheries on the resource and its ecosystem
iii. verification of the assumptions and estimates used in establishing F-based precautionary reference points, and replication and testing of the assessment methods.
3.3.1 Data sources used in the assessment framework
3.3.1.1 Types of surveys
The four sources of data used in the assessment framework were (a) fishery independent trawl surveys, (b) fishery independent trap surveys, (c) fishery dependent observer data from the targeted trap fishery and (d), fishery dependent observer data from other fisheries prosecuted in the same area.
3.3.1.2 Fishery independent trawl surveys
Annual fishery-independent swept-area trawl surveys were planned over a four year period. Each was of three weeks duration and were planned to cover the 400 to 2 200 m depth range of systematically-determined sampling strata along the B.C. shelf slope. Gear breakdowns and other problems have prevented this work from being completed at this time. These surveys provided distributional data and swept-area biomass density estimates, which were used in the calculation of crab biomass indices. The surveys also provided important biodiversity data on the associated organisms occupying the same region. In addition, they provided unbiased biological information on size and sex of the animals as well as a better understanding of depth distribution and range of the Tanner crab by size and sexual condition.
3.3.1.3 Fishery independent trap surveys
A series of systematic fishery-independent trap surveys of the entire coast were completed by industry using standard traps, bait and where possible, soak-times. These intensive surveys provided synoptic distributional information for the crab resource. Standardized trap catch-per-unit-effort data (CPUE) provided a ratio of relative abundance indices from trawl-surveyed index sites and non-surveyed areas. These ratios were used to estimate overall biomass. This synoptic survey allowed us to obtain qualitative and quantitative information on bycatch issues associated with a targeted trap fishery.
3.3.1.4 Fishery dependent observer coverage in the experimental targeted trap fishery
Fishery-dependent trap CPUE and biological sampling data in the experimental targeted trap fishery was collected by the fishing crew and certified observers. This information helped characterize commercial fishery effort and understand what components of the crab stock and ecosystem were being affected by the targeted trap fishery. This in turn provided information on the limits of using fishery dependent data in assessing the total population. Fishery dependent information from experimental areas that are purposely heavily exploited can provide an independent depletion estimator of biomass to validate other assessment methodologies. In addition, the experimental fishery provided product for market testing and a source of income for the industry to help offset some costs of fishery management and assessment (e.g. observer costs).
3.3.1.5 Fishery dependent observer coverage in other fisheries
Bycatch monitoring in other fisheries provided estimates of total mortality for the grooved Tanner crab resource. To understand the impact of the targeted crab fishery on the ecosystem, it is necessary to quantify the cumulative effects of other activities that also affect the same system. Observer data from other fisheries were examined to qualify and quantify, where possible, the magnitude of the impacts on this slope ecosystem of the other fishing industry sectors.
3.3.2 Results to date of the experimental phase
3.3.2.1 Distribution and abundance of the animals
One of the important outcomes from the work conducted to date is a better understanding of the spatial and temporal distribution of grooved Tanner crabs by size category and sex. From initial work in the Experimental Phase, Gillespie et al. (in press) found that their depth distribution to be 400-1460m with the bulk of the adult population occupying the 600-1 200 m range during the summer months. Females tended to occupy a slightly shallower, narrower depth range than males with females not found below 1 160 m. Breeding aggregations occurred in the late winter in 600- 800 m. Juvenile animals tended to be broadly distributed over a range of 600-1 600m. There were no juvenile animals below 1600 m although juveniles of the congeneric triangle Tanner crab (Chionoecetes angulatus) occurred from 1 200-2 000 m.
Geographically, the highest abundance of crab was found along the west coast of Vancouver Island. Centres of the highest concentrations appear to be in areas off the northern portion of the west coast of Vancouver Island.
A biomass estimate was required to establish decision rules for managing this fishery. Indices of biomass were calculated by combining the results of the index site swept-area trawl surveys with the coast-wide systematic trap survey data. Swept-area trawl surveys of the index sites provided estimates of density and biomass indices for the index areas along the coast. This density information was then extrapolated to non-trawled areas using a reference trap catch-rate ratios between trawled and un-trawled areas. A linear relationship was assumed in calculating extrapolated biomass indices between reference trap catch-rate ratios and density. We also assumed that survey catchability in all these surveys remained constant over years (Workman et al. 2002, Gillespie et al. in press).
3.3.2.2 Targeted and non-targeted fishery impacts
The targeted trap fishery caught high proportions of female and undersized male grooved Tanner crab. Catches of other animals were low in most areas of the coast with the exception of the more northerly areas which tended to have a high incidental catch of other potentially commercially-valuable crab species, primarily the lithodid crabs Paralomis multispina and Paralomis verrilli.
Total catch of grooved Tanner crab is quite large in the groundfish trawl and trap fishery. In the trawl fishery, bycatch is documented with 100 percent observer coverage. The duration of tows in commercial trawl fisheries is up to 7 hours and the abrasion and crushing on these soft-bodied animals would guarantee that mortality rates are close to 100 percent. Bycatch of grooved Tanner crab in the pot fishery for sablefish (Anoplopoma fimbria) is not well documented but the small amount of observer data that are available indicate that Tanner crabs are a common bycatch in this fishery. Although there are no data on survival of catch and release animals, in general the animals are in good shape when they are brought up. One might hypothesize that discard mortality in the sablefish pot fishery is potentially low if the crabs are handled properly since Tanner crabs from the targeted trap fishery are kept alive on the boats for a number of days prior to landing at processing plants. For the purposes of harvest decision rules for the targeted Tanner crab fishery, handling mortality from all fisheries is assumed to be 100 percent. As a result, bycatch discard mortality is estimated, in some areas, to exceed initial conservative catch limits for this species.
From an ecosystem perspective, grooved Tanner crab play an important role as a major prey item. Stomach analysis of fishes taken in the trawl survey catches shows that tanner crab is a major prey component of many of the larger fishes in this region. In addition, the index ‘swept-area’ trawl survey provided a new perspective of the biodiversity of animals that were associated with grooved Tanner crab. The most interesting result was that a large number of the animals encountered were either rare, represented new records, or in a number of cases, were newly defined species. There is little information available on most of the animals and in most cases there is a problem with their proper identification, never mind their biology or role in the environment. Finding the people and resources to identify these animals has been a major challenge, but to date we have been able to identify 114 species of fish and over 230 invertebrate taxa from deepsea Tanner crab surveys conducted between 1999 and 2003.
At least 19 species of fish were recorded for the first time from British Columbia waters by these surveys (Gillespie 1993, Mecklenberg et al. 2002, Peden and Gillespie, in press). Of these, two were sculpins (Cottidae and Psychroutidae), two were eelpouts (Zoarcidae) and five were snailfishes (Liparidae). Further examination of material that has not been identified to date will add to this total. There were collections of at least 40 other fish species that either confirmed the species’ presence in British Columbia (i.e., were second or third records) or provided new distributional limits. The majority of these were eelpouts (eight species), snailfishes (five species) grenadiers (Macrouridae, five species), and skates (Rajidae, four species).
Three species of crab were recorded for the first time from British Columbia. Two of these species were galatheids (Galatheidae) and the third a decorator crab (Majidae). Additional information was also collected on the distribution and biology of two crabs known only from single records in British Columbia (Hart 1982), Oregonia bifurca (Majidae) and Paralomis verrilli (Lithodidae). Two species of the shrimp, Pandalopsis glabra and P. ampla (Pandalidae) were recorded for the first time from British Columbian water. Two species of pycnogonids were captured, but their specific identity has not yet been confirmed.
Although the trawl gear used in the survey was not designed to sample infaunal bivalves, 14 species have been recorded, including one species reported from British Columbia for the first time. A total of 16 species of cephalopods have been identified to date, including one species of deepsea octopus that had not previously been reported for British Columbia. In addition, three forms of Benthoctopus spp. were collected that have not yet been identified as to its species. The number of squid species will increase, as most gonatid squids were identified only to genus and wait until further identification can be completed.
Numerous examples of hydrozoans, anthozoans and sponges were collected and progress towards establishing confirmed identifications as to species is currently underway. Findings to data have identified at least three new species of black corals, Antipatharia, and one new species of octocoral, Paragorgia spp. Final descriptions of holotypes are being worked on by colleagues at the Smithsonian Institute.
Echinoderms were well represented in the samples with at least seven species of Holothuroidea, 47 species of Asteroidea, 20 species of Ophiuroidea, two species of Crioidea and three species of Echinoidea, which were identified at the Royal British Columbia Museum. There is still a great deal more work to be done to get basic information and complete the identification of animals that we have collected from these deep regions of the ocean.
Accurate quantification of bycatch has become an issue for all fisheries in this deepwater region, especially the trawl fishery. There are also issues with respect to the quality of bycatch information from observer reports as it does not match the biodiversity information from crab trawl index surveys. It is quite understandable that the quality of observer data is lower considering the problems with identification, and not detecting, or recording, rare or unusual animals due to sub-sampling protocols and extrusion of soft-bodied animals through the net. A review of the bycatch issues in the trawl fishery has been requested by senior DFO managers.
3.3.2.3 Verification of assumptions and estimates used in the surrogate reference points andtesting assessment methods
Working in the deep ocean environment has provided a number of new challenges for standard assessment methods. For a swept-area trawl survey in the shallower range of depths, <1 000 m, a third wire net sonar or SIMRAD ITI net monitoring system was used to measure the opening of the net and net bottom contact time and distance to better calculate the area swept by the trawl. However, in depths >1000 m, this equipment was not functional, so that the area swept was calculated from the time the net was on the bottom and the distance traveled using estimates of sink rate calculations to determine bottom contact time and assuming that the net mouth width remained constant.
The paucity of biological and fisheries information for many stocks has led us to identifying surrogate reference points for the fishing mortality (FMSY) and stock biomass level (BMSY) that produce maximum sustainable yield (MSY). A decision equating F to the natural mortality (M) of the animal was used as the decision to determine yields near the MSY (Gulland 1971). It has been suggested that the value of F should be a scaled value of M (i.e., xM) where x ranges from 0.2 (Garcia, Sparre and Csirke 1989) to 0.4 (Caddy 1986) or 0.5 (Gulland 1971). For the grooved Tanner crab fishery, we choose F at 0.2M to be used as a default proxy for FMSY.
The biological estimates of growth and age used in estimation of M for the surrogate F-based reference point were initially set at levels typical of long-lived, slow growing animals (Boutillier et al. 1998). This approach is assumed to be overly conservative but there are still a number of questions unanswered with respect to the age and growth of Tanner crabs. Of particular interest is whether deepwater Tanner crabs have a terminal moult as this is known to occur in its shallow water congeners (Tester and Carey 1986, Somerton and Donaldson 1996) or whether they show some other form of growth pattern including ‘skip molting’ and it may be possible to use radiometric methods to estimate shell age (Nevissi et al. 1996). This biological information is critical to calculating an estimate of M for use in establishing an appropriate F-based reference point using the modified Gulland method.
It was hoped that biomass assessment procedures could be validated during the experimental phase, however, effort to date has been insufficient to produce a depletion estimate that can be compared to the trawl and trap index estimates.
3.3.2.4 Other findings
An examination of the health of the crabs from the trawl index area surveys has found a high prevalence of Bitter Crab Disease caused by infection with a parasitic dynoflagellate, Hematodinium sp. Although infection rates are relatively low in adult crabs, they are high in juveniles and as such could have a significant effect in determining year class strength (Gillespie et al. in press).
3.3.3 Recommendations and modifications to experimental phase
Distribution and abundance information has been used to set the location and timing of the fishery to ensure that the potential impacts are managed in a way that minimizes risks. Targeted and non-targeted fisheries impacts are used to modify quotas and limit the areas of impact to prevent capture of bycatch species of concern. In the targeted fishery, we have recommended evaluation of gear modifications to reduce bycatch of female and undersized male crabs. In the non-target fisheries, focussed attention on the need to coordinate management and develop an ecosystem approach to all the fisheries in this region that affect the continental slope. We are still seeking information for evaluating model assumptions and assessment methodology and will use this information to redesign the assessment framework as necessary. New information on the incidence of disease may provide information on stock structure as well as assist in understanding a mechanism that may control year- class strength.
As a result of this additional information gathered to date, the following modifications to the fishery were recommended.
The targeted fishery be restricted to the west coast of Vancouver Island. This leaves large areas of the British Columbia coastal waters free of impacts from the directed trap fishery, allows the trap fishery to take place in areas that are lightly affected by non-targeted trawl fisheries and focuses the fishery on a relatively small area so that the effects of fishing on population dynamics can be assessed more quickly. It also excludes areas where there are concerns regarding bycatch of other crab species by the trap fishery.
Commercial trap gear modifications will be evaluated to determine if the location of the escape ring or the use of collars is a practical solution to reducing the incidental catches of female and undersized male crabs.
The season will open earlier to evaluate the impact on the stock as well as markets.
Tagging will be evaluated to determine if it can be used to evaluate biomass estimation procedures or provide new life history information related to age, growth and moulting patterns.
A depletion experiment will be attempted in an area to validate the swept-area trawl abundance estimation procedures.
Senior managers have directed stock assessment personnel to assess bycatch and ecosystem impacts of the other fisheries in this region. The objective of this assessment is to provide the basis for an ecosystem-based management framework for all the deep-sea continental slope fisheries.
Repeated annual swept-area trawl assessments will be carried out in fished and unfished reference areas.
Effort standardization studies will be designed to examine the relationship between soak-time and catch-rate.
All other restrictions and decision rules outlined above will remain the same.
4. EVALUATION
4.1 Criteria
The fishery was evaluated against the conservation principles in the National Policy on New and Emerging Fisheries to assess the effectiveness of this phased approach to achieving a sustainable industry. As the fishery is still in the Experimental Phase of development, the following is an interim assessment. The criteria used in the evaluation framework included:
conservation not to be compromised; key scientific requirements include estimates of abundance, distribution, productivity
all potential impacts or interactions to be assessed and
prior to commencement of a fishery, fisheries managers to establish conservation standards, set conditions for harvest and monitor their application.
4.2 Conservation will not be compromised
Management of the targeted fishery addresses conservation in a manner that is consistent with the precautionary approach. Until the stock structure of Tanner crabs is better understood, the fishery is managed on a fairly fine scale to ensure that sequential overfishing does not occur. Tanner crab distribution is better documented and the experimental targeted fishery will only be allowed to exploit a small portion of the available stock. Selection of the location of the fishery will depend on achieving commercially viable catches of grooved Tanner crabs while reducing the potential impacts of bycatch of other species. Other control (non-fished) areas will be monitored with fishery independent surveys in conjunction with the exploited areas to evaluate the fishery impacts. However, there may be a problem with harmonizing decision rules in the other trawl and trap fisheries in these control areas to ensure that the exploitation of grooved Tanner crab is stopped or significantly reduced, if necessary.
4.3 All potential impacts or interactions will be assessed
In general the potential impacts or interactions of the fishery are being measured but the ecosystem impacts have yet to be fully assessed. A detailed record of the identity, density and location of all species encountered is being made as part of the trawl survey. It will not be possible however to distinguish the impact of a targeted grooved Tanner crab fishery from the impacts of other fisheries occurring in the same areas. Information from this assessment framework can only be used to monitor ecological effects in the area from all fisheries combined. It is planned to present managers of other fisheries with biodiversity information from this assessment so that they can develop information standards that provide a more accurate assessment for partitioning ecosystem impacts by fishery.
The total weight of Tanner crab bycatch in other fisheries is accurately accounted for in fisheries that have mandatory observer coverage, however, crab bycatch will have to be estimated from historical observations for unmonitored fisheries. These data will be combined with the total landings and estimates of bycatch mortality from the targeted fishery to estimate total mortality. Estimated total removals are accounted for in the establishment of decision rules for the targeted fishery. Some areas are not available to a targeted fishery as bycatch from other fisheries meet or exceed the present estimates of production potential. Bycatch in the non-targeted fisheries are not controlled and so, total catch in some areas from these trawl and other trap fisheries often exceed the recommended allowable catch.
Although no formal data have been gathered to date, limited qualitative examinations indicate that Tanner crab is a major component in the diets of many of the fishes inhabiting the continental slope. No modeling (e.g. EcoSim or EcoPath) of the implications of removals of Tanner crab from this ecosystem is planned at this time.
4.4 Establishment of conservation standards, setting conditions for harvest and monitoring their application
Prior to commencement of the experimental targeted Tanner crab fishery, decision rules for harvest rates were established. These decision rules were based on the most conservative estimates of natural mortality and crab production characteristics. In developing fishing plans the removal of animals from all sources were accounted for and mortality was assumed to be 100 percent from all sources. These decision rules will not change until there is greater certainty that the productivity and resilience of these animals is higher than initially estimated.
Harvest conditions for the targeted fishery were established and monitored. Monitoring of the targeted Grooved Tanner crab fishery revealed problems of bycatch of female crab and the harvest conditions have been modified to address this issue through the use of more effective escape and, or, exclusion mechanisms.
Within the assessment framework, the decision rules for the fishery are to be tested by comparing multiple biomass estimation procedures, evaluating the population responses to experimental fisheries using various exploitation rates and monitoring large non-fished control areas to explore natural variability of Tanner crab population dynamics.
A series of more intensive surveys are planned to compare assessment methodologies such as depletion experiment and tagging studies, and monitor and compare populations in both fished and unfished control areas.
5. CONCLUSIONS
This approach for the development of the grooved Tanner crab fishery has a number of benefits. Clear policy statements for this programme provide both a forum for fair and open decision making and unambiguous objectives that are understandable to both industry and government. This resulted in industry understanding and accepting the risks and true costs of fishery development and the efforts needed to control their fishery impacts. The programme compels industry to develop a business plan that takes the policy objectives and associated costs into consideration. The result is that capitalization and fishery development are slowed to a more cautious pace. Industry has been intimately involved in providing the assessment information required to ensure a sustainable fishery and there has been good interaction between the Tanner Crab Fisherman’s Joint Venture Association and the Department of Fisheries and Oceans. Most importantly, the programme has allowed collection of organized and detailed biological information for grooved Tanner crabs prior to the onset of exploitation and allowed for experimental approaches in the earliest stages of development.
Some of the drawbacks to the phased approach are not unique to harvesting of Tanner crabs, but are common to most new and developing fisheries (Perry et al. in press). The slow pace of development may be frustrating to industry, but it also allows fishery development to proceed over a time frame needed to demonstrate variability in market price, an important aspect of a business plan. The requirement that development be cost-neutral to the DFO has resulted in delays inherent in finding new funds and hiring and training new staff for the programme. It is perhaps unrealistic to assume that industry can support all of the development costs, thus it is imperative to the proper functioning of this system that sampling protocols are effective and cost efficient.
Major problems in the development of assessment information for this fishery have arisen because the deep-sea environment provides a unique and difficult ecosystem to work in. To date we have had difficulties in adapting standard assessment tools (trawl standardization, tagging, etc.) to working in this environment. In addition, the identification and biology of the animals and their function in this deep-sea ecosystem are poorly understood. At the most basic level, the taxonomic expertise necessary to identify the array of marine organisms that has been encountered is scarce and widely distributed throughout the world. There is a huge need to recognize this problem and push forward coordinated programmes to address gaps in taxonomic expertise at national and international levels.
The other major problem specific to this targeted fishery has been the inter-industry conflicts that exist in relation to fisheries on the continental slope of British Columbia. Inter-industry conflicts occur when management plans for different fisheries are not integrated. This generally occurs when policies and implementation plans are not well integrated between the different gear sectors. If left unresolved, these inter-industry conflicts can result in social, economic and biological issues that ultimately result in conservation problems and unsustainable fisheries.
6. ACKNOWLEDGEMENTS
We would like to recognize the contributions that the British Columbia Ministry of Agriculture, Food and Fisheries have made to make this work through their help to both the industry and the Department of Fisheries and Oceans. We would like to thank the many taxonomic experts from around the world that have helped in the identification of these animals. In particular we would like to recognize Phil Lambert, Steven Cairns, and Dennis Opresko for their efforts. And last, but not least, we would like to thank the scientific and vessel crews that have contributed to the collection of information that is critical to our understanding of sustainable industrial development in these deep ocean environments.
7. LITERATURE CITED
Boutillier, J.A., R.B. Lauzier, A.C. Phillips & L. Barton 1998. Framework for a Tanner crab (Chionoecetes tanneri and C. angulatus) fishery in waters off the west coast of Canada. CSAS Res. Doc. 98/125. 29 pp.
Caddy, J.F. 1986. Stock assessment in data-limited situations - the experience in tropical fisheries and its possible relevance to evaluation of invertebrate resources. in Jamieson, G.S. & N. Bourne [eds] North Pacific workshop on stock assessment and management of invertebrates. Can. Spec. Publ. Fish. Aquat. Sci. 92:379-392.
Campbell, A. 2000. Review of northern abalone, Haliotis kamtschatkana, stock status in British Columbia. Can. Spec. Publ. Fish. Aquat. Sci. 130: 41-50.
FAO 1995. Precautionary approach to fisheries. Part 1: Guidelines on the precautionary approach to capture fisheries and species introduction. Elaborated by the Technical Consultation on the Precautionary Approach to Capture Fisheries (Including Species Introductions). Lysekil, Sweden, 6-13 June 1995 (A scientific meeting organized by the Government of Sweden in cooperation with FAO). FAO Fisheries Technical Paper. No. 350, Part 1. Rome, FAO. 52 pp.
Garcia, S., P. Sparre & J. Csirke. 1989. Estimating surplus production and maximum sustainable yield from biomass data when catch and effort time series are not available. Fish. Res. 8: 13-23.
Gillespie, G.E. 1993. An updated list of the fishes of British Columbia, and those of interest in adjacent waters, with numeric code designations. Can. Tech. Rep. Fish. Aquat. Sci. 1918. 116 pp.
Gillespie, G.E., K.H. Fong, A.C. Phillips, G.R. Meyer & J.A. Boutillier 2004. Development of a new fishery for Tanner crabs (Chionoecetes tanneri Rathbun, 1893) off British Columbia: 2003 Status Report. Can. Science Advisory Secre. Res. Doc. 2004/132. 87 pp.
Gulland, J. A. 1971. The fish resources of the ocean. Fishing News (Books), West Byfleet. 255 pp.
Hart, J.F.L. 1982. Crabs and their relatives of British Columbia. B.C. Prov. Mus. Handbook 40. 267 pp.
Jamieson, G.S. 1999. Review of status of northern, or pinto, abalone, Haliotis kamtschatika, in Canada. CSAS Res. Doc. 99/190. 22pp.22 pp.
Mecklenberg, C.W, T.A. Mecklenberg & L.K. Thorsteinson 2002. Fishes of Alaska. American Fisheries Society, Bethesda, Maryland. 1037 pp.
Nevissi, A., J.M. Orensanz, A.J. Paul & D.A. Armstrong 1996. Radiometric estimation of shell age in Chionoecetes spp. from the eastern Bering Sea, and its use to interpret shell condition indices: preliminary results. pp. 389-396. In: High latitude crabs: biology, management and economics. Alaska Sea Grant College Program Report 96-02.
Peden, A.E. & G.E. Gillespie 2003. Marine fishes. Vertebrates of British Columbia: Scientific and English names. Standards Components of British Columbia’s Biodiversity No. 2. Ver. 4.0. Ministry of Sustainable Resource Management, Victoria, B.C.
Perry, R.I., R. Purdon. G.E. Gillespie&E. Blewet 2005. Canada’s phased approach to new and developing fisheries: concept and practice. In: Assessment and management of new and developing fisheries in data-limited situations. Univ. of Alaska, Alaska Sea Grant.
Perry, R.I., C.J. Walters & J.A. Boutillier 1999. A framework for providing scientific advice for the management of new and developing invertebrate fisheries. Rev. Fish Biol. Fish. 9: 125-150.
Phillips, A.C. & R. Lauzier 1997. Biological background for the development of a new fishery for the grooved Tanner crab (Chionoecetes tanneri) of British Columbia. CSAS Res. Doc. 97/148. 81 pp.
Somerton, D.A. & W. Donaldson 1996. Contribution to the biology of the grooved and triangle Tanner crabs, Chionoecetes tanneri and C. angulatus, in the eastern Bering Sea. Fish. Bull. (U.S.) 94: 348-357.
Tester, P. & A. Carey 1986. Instar identification and life history aspects of juvenile deepwater spider crabs, Chionoecetes tanneri Rathbun. Fish. Bull. (U.S.) 84: 973-980.
Workman, G.D., A.C. Phillips, F.E. Scurrah & J.A. Boutillier 2000. Development of a fishery for Tanner crab (Chionoecetes tanneri) off the coast of British Columbia. CSAS Res. Doc. 2000/169. 71 pp.
Workman, G.D., A.C. Phillips, F.E. Scurrah & J.A. Boutillier 2002. A new fishery for grooved Tanner crab (Chionoecetes tanneri) off the coast of British Columbia, Canada. pp. 439-456. In: Crabs in cold water regions: biology, management and economics. Univ. Alaska, Alaska Sea Grant, AK-SG-02-01.
1. INTRODUCTION
In 2001 the New Zealand hoki fishery was awarded Marine Stewardship Council (MSC) certification under its Fisheries Certification Programme. This was awarded after an independent assessment of hoki fishery management practices against the MSC’s Principles and Criteria for Sustainable Fishing. As part of its ongoing certification commitments, the Hoki Fishery Management Company (HFMC)[52] was required to undertake an ecological risk assessment (ERA) of its fishing activities.
This paper reports on the process of developing and applying a comprehensive ERA methodology, including the extensive stakeholder engagement process adopted by the HFMC. The more technical aspects of the risk analysis framework and the specific outputs of the ERA are available on the HFMC website <www.hokinz.co.nz>.
2. THE NEW ZEALAND HOKI FISHERY
The hoki fishery is by far the largest of New Zealand’s commercial fisheries representing more than half of the total tonnage fished under the New Zealand Quota Management System (QMS). It is a valuable resource for local and export markets earning over NZ$300 million in annual exports and amounting to approximately 20 percent of the total annual exports from the sector. The major markets for hoki are the United States and Europe, while Japan and Australia are also important markets.
Hoki are found throughout New Zealand waters, but the main catching grounds are off the West Coast of the South Island, in Cook Strait and on the Chatham Rise. The fishery is managed under the QMS, which is designed to ensure sustainable use of fisheries resources while allowing economic efficiency in the industry by prescribing a strict limit on the amount of quota species that can be taken each year. This limit, the Total Allowable Commercial Catch (TACC), is based on biological data of the size of the resource and its productivity along with other information provided to the Government by stakeholders in the fishery. The TACC for the hoki fishery was set at 200 000 t for the 2002/2003 fishing year - the year that the ERA was undertaken.
3. THE ECOLOGICAL RISK ASSESSMENT CONTEXT
While the primary purpose of the ERA was to meet MSC requirements, it also provided a opportunity to advance the environmental aspects of the proposed hoki fishery management plan - a new tool that provides for fisheries stakeholders to identify the objectives they want to achieve for a fishery, set out how they want to achieve those objectives and submit a plan to the Minister of Fisheries for approval.
Because of the emphasis on stakeholder engagement (under both the MSC and fishery plan frameworks) the ERA was viewed from the outset both as a structured way of assessing the impacts and ecological risks associated with the fishery and as a key vehicle for stakeholder participation in management of the fishery. The specific aims of the ERA were:
i. to identify and characterize the ongoing impacts of the New Zealand based hoki fishery
ii. to identify and characterize the ecological risks created by the ongoing impacts and
iii. to engage hoki fishery stakeholders in the development and conduct of the ERA to ensure a comprehensive understanding of the relevant impacts, effects and risks associated with the fishery.
4. COLLABORATIVE DEVELOPMENT OF THE ERA METHODOLOGY
Despite requiring an Ecological Risk Assessment of the fishery, the Marine Stewardship Council provided the Hoki Fishery Management Company with little guidance on exactly what constituted an ERA. In addition, there were no off-the-shelf models that the HFMC could use to assess the wider ecological risks associated with trawl fisheries. This meant that the detailed methodology had to be developed by the HFMC with the assistance of contracted expertise[53].
In order to facilitate collective learning and foster stakeholder support for the Ecological Risk Assessment the methodology was developed through a collaborative process led by the ‘Hoki ERA Group’. This group was convened by the HFMC and comprised representatives from HFMC, the New Zealand Seafood Industry Council, WWF New Zealand and WWF Australia, Ministry of Fisheries, Ministry for the Environment, Department of Conservation, Te Ohu Kai Moana and research expertise from independent science providers, including the National Centre for Fisheries and Aquaculture of the National Institute of Water and Atmospheric Research, a New Zealand crown-owned research institute.
The process took several months and involved a series of meetings where feedback on various drafts was provided to the consultants who refined the methodology to reflect the group’s increasing understanding of what would be required to complete the ERA. Where required, the consultants also met with group members on a one-on-one basis to enable frank discussion of critical aspects of the methodology. At the end of the process all members of the group were able to support and endorse the selected methodology, which proved critical to the successful completion of the ERA.
Development of the ERA process followed the underlying risk management process as described in Australia/New Zealand Standard for Risk Management (AS/NZS4360). This standard gives a high level management process that defines the essential stages of risk assessment as context setting, scope, hazard identification, risk analysis, risk evaluation, risk treatment and review. This methodology was refined and adapted to reflect the need to assess risk to marine ecosystems and ecological processes.
The development process was informed by experience gained from a range of risk management and risk analysis projects in other industries and sectors, as well as fishery ERA work carried out in other countries. A number of important factors were determined that were essential for success. These included the following
An ERA is not an environmental risk assessment and as such, the scope of the project and the definition of ‘ecological processes’ should be clearly stated and agreed to by the appropriate stakeholders.
The risk methodology should include processes that document and justify the conclusions reached and clearly explain the underlying analysis including the veracity of the information, the relative and absolute levels of certainty, and list all assumptions made and simplifying steps used.
Risk management responses should be determined by specific hoki fishery management objectives and remain independent of the risk assessment.
For complex systems such as fisheries, a basic conceptual model for the various system interactions should be constructed.
Stakeholders need to understand and accept the chosen methodology and process so that they can support both the process and the subsequent findings (and ideally, they will directly contribute to developing the methodology).
Stakeholders who participate in workshops, expert panels, or other forms of consultation should be briefed adequately and have sufficient information to usefully contribute to the process.
Stakeholders and others invited to participate in workshops should be sufficiently representative of the major stakeholder groups and between them should have the full range of required expertise.
5. SCOPE AND NATURE OF THE ERA
5.1 Risk assessment scope
The scope of the Ecological Risk Assessment was limited to identifying and characterizing effects and risks of fishing activities on the aquatic environment. The outputs sought were the identification of direct impacts, a relative ranking of those impacts and a characterization (with a relative ranking where possible) of ecological risks, rather than specific numbers or values attributed to risks.
It was agreed that the ERA should reflect the New Zealand regulatory environment and the QMS under which the fishery is managed. This resulted in a number of assumptions, for example, that the TACC for the fishery is set at a sustainable level. As a result the ERA considered the impacts on the hoki target stock and fish bycatch species in regard to the sustainability provisions of the QMS. Clearly a different set of assumptions may be required for fisheries not managed under a QMS environment.
Because specific management responses and mitigation options could only be identified after impacts and risks had been clearly identified and characterized, they were excluded from the scope of the ERA. In addition, it was important that the ERA focused on risk identification and characterization, and avoided prejudging the process by prematurely identifying management responses. Moreover, discussing mitigation responses too early in the process would confuse the characterization of risk as it is, rather than what it may be, or become, following mitigation responses. For these reasons it was decided that management responses would be determined by specific hoki fishery management objectives and that these should be determined in the context of the wider hoki fishery management plan and remain independent of the ERA.
Interestingly, as the process developed it became clear that the separation of mitigation responses greatly improved full stakeholder engagement and participation. This was largely because stakeholders did not feel that they were necessarily supporting, even if by association only, any subsequent management plan developed by the HFMC.
5.2 Biophysical scope
The biophysical scope of the ERA was set to include all biological components (i.e. hoki, bycatch species, marine mammals, seabirds, benthic environment and communities, etc.) within the hoki fishery marine environment. The ERA therefore included all marine mammals, sea birds, and the benthic environment and associated communities within the vicinity of the fishing grounds, as well as the hoki fish stock and associated fish bycatch species.
5.3 Characterization of impacts and risks
The ERA needed to address the full spectrum of impacts and risks associated with the fishery. For the purposes of the ERA a useful framework for understanding this broad spectrum of effects and risks was described as moving from the micro through to meso and finally to a macro scale as follows.
Micro: Generally spatially and temporally discrete and not overly complex or uncertain attributes that can typically be ascribed to individual populations and species.
Meso: More complex and less easily defined aspects that may be dispersed and exhibit longer term reaction to stress. Habitats, communities and other similar aspects tend to fall into this category.
Macro: Multifaceted, complex, interrelated, spatially and temporally diffuse aspects that have inherently high levels of uncertainty and ‘ignorance’ associated with them. Ecosystems and ecological processes tend to fall into this category.
The broad range of components, interactions and systems required the application of a range of information processing methods. For the purposes of the ERA the information processing spectrum was described as follows.
Deductive analytical processes - generally applied at the micro level where it is more likely that there will be relatively complete, and in some cases quantifiable, information.
Expert judgement - generally applied at the meso level where information will tend to be weaker and there is likely to be little if any quantifiable information, and only a broad understanding of the inter-relationships and cause and effect.
Best endeavour - generally applied at macro levels where high levels of uncertainty and possible ignorance requires drawing on best available information about the fishery, its interactions and our knowledge of ecological processes.
6. THE ERA METHODOLOGY
The ERA methodology is illustrated in Figure1. It comprises two steps: an impact characterization followed by an ecological risk characterization. An impact characterization must be carried out prior to the risk characterization because there needs to be an understanding of the scale of immediate and on-going impacts directly and indirectly caused by the fishery, before the ecological risks associated with the hoki fishery can be assessed.
The hoki ERA therefore consisted of two distinct phases.
i. Impact characterization. This considered the level and nature of the impact of the fishery on individual components associated with the fishery (i.e. hoki and bycatch fish species, marine mammals, seabirds, benthic environment and communities, etc.). A qualitative assessment process using an ‘order of magnitude’ type scale was employed to enable the determination of the impact level. Uncertainty was covered by the use of an alternative ‘precautionary’ scale where confidence in the characterization was low.
ii. Ecological Risk Characterization. This phase aimed at building on the information gathered in the impact characterization to identify and consider the potential cumulative effects of the range of impacts on ecological processes and associated ecosystems, and the associated probability of those effects occurring. A range of possible impact scenarios were identified, each with a given probability of occurrence and a semi-quantitative analysis model employed. This enabled the total risk associated with each scenario to be systematically deduced.
FIGURE 1. Hoki fishery Ecological Risk Assessment Methodology
An important documentary resource for both workshops was the report "Potential interactions between New Zealand’s hoki fishery and key components of the marine ecosystem and associated processes" (Livingston 2002). This report provided a conceptual overview of the fishery and its interactions. It comprised a summary of the key aspects of the fishery, relevant oceanographic features of New Zealand waters, life cycle and stock movements of hoki, an overview of the hoki fishery and associated ecological processes, the role of hoki in the fish community, and feeding and food web interactions.
7. THE WORKSHOP APPROACH
7.1 Execution of workshop
The impact and risk characterization phases were largely carried out in two technical workshops- an impact characterization workshop and a risk characterization workshop. As with the overall methodology, the specific workshop format and processes (including the impact and risk scales) were developed collaboratively with the ERA group. Both workshops were facilitated by the consultants, who also provided record keepers and technical risk expertise.
The workshop approach was chosen because it enabled the use of "expert" or professional judgement in the absence of detailed information on marine ecosystems and ecological processes and (especially) cause and effect relationships. The philosophy that underpins the "expert workshop" approach is that, by bringing together a range of professional expertise and creating an environment in which facilitated and structured discussion can take place, judgement based information can be generated.
For both workshops, all of the participants were fully briefed prior to the workshop to ensure that they had a good understanding of the ERA methodology and the role of the workshop. They were also provided with a range of resource material on the species or components and processes to be assessed at the workshop.
Workshop participants were asked to familiarize themselves with key information relating to their area of expertise prior to the workshop, but they were not required to undertake any additional information collection or research prior to the workshop.
7.2 Provision for observers at workshops
A crucial aspect of each of the workshops was the selection of workshop participants on the basis of their technical knowledge so that the required tasks could be completed. However, to enable full stakeholder involvement in the ERA, provision was also made for formal observers to attend the workshops. Observers did not participate directly in the workshop but were given the opportunity to make formal comment on the process by way of post workshop reports or comments on the day’s business. Feedback after the workshops confirmed that inviting observers to the technical workshops substantially enhanced the ability of stakeholders to observe and comment on the process and to better understand and interpret the impact and risk characterizations.
8. IMPACT CHARACTERIZATION WORKSHOP
8.1 Workshop methodology
The workshop to characterize impacts of the fishery bought together knowledge of the hoki target stock, bycatch fish species, marine mammals, seabirds, and benthic environment and communities. This knowledge was drawn from
observed impacts
targeted research and science relating to the various components of the hoki fishery
hoki fishery operational and management practices and
other evidence as available.
The composition of the impact characterization workshop was determined by a mix of expertise, knowledge and experience (observed impacts, scientific, fishery operations) and, as far as possible, drawn from all stakeholder and sector groups (e.g. industry, environmental NGOs, government, etc.). The aim was for the overall group of participants at the workshop to reflect the full range of technical expertise required to address the nature of enquires being undertaken in the workshop. Special effort were made to include individuals with at-sea experience such as skippers and fishery observers, as well individuals with scientific backgrounds.
Workshop participants were provided list of seabird, marine mammal, fish and other species for consideration at the workshop. This list had been developed with input from the ERA group, along with advice from additional science providers recommended by the group. For each of the species under consideration at the workshop participants were asked to complete the following steps.
i. Broadly describe the current level of knowledge.
ii. Broadly describe the status and trend of the species component to the extent that this was possible.
iii. Assess the mortality resulting from the all potential sources of hoki fishery effects (hazards)[54]; for example, fishing gear, fishing operations, pollution, etc. The assessment of the group was then recorded using the agreed component impact scale (see Figure 2). This provided for an assessment of the overall current impact of the hoki fishery on each species or components in terms of extent, intensity and reversibility of impact. Where there was significant lack of certainty, a low confidence ranking was used. Critical and important comments on the nature and scope of impacts were also recorded.
iv. Identification of any gaps or omissions, e.g. additional species likely to be affected by the fishery. These were then assessed using the above methods.
An important feature of the workshop was that participants were asked to identify peer reviewers with specific expertise where this was considered necessary, and particularly where some individuals with specific technical experience had been unable to attend the workshop. The nominated peer reviewers were asked to review the workshop output to ensure that the best expertise was bought to bear on the issues under consideration.
The workshop output was formally recorded as a series of excel spreadsheets, which captured comments for each of the assessed components and their impact ratings[55]. Impacts were recorded for nine species of seabirds, the benthic environment and associated communities and the New Zealand fur seal. Impacts on the hoki target stock and fish bycatch species were considered in regard to the sustainability provisions of the New Zealand QMS, but were not formally characterized.
8.2 Impact scales and analysis
Impact and effect scales were used during the impact and risk characterizations (see Figure 1). The impacts were assessed in terms of extent, intensity, and reversibility (see Figure 2).
A 5-level ‘order of magnitude’ scale is used to designate the various descriptive summaries of the possible impacts (E to A). A second series of designations, applicable for component impact only is included for use where the workshop group feel that they have low confidence to the extent that a higher impact is conceivable. This second scale effectively results in a precautionary characterization of the ‘component impact’. Any lack of confidence at the risk characterization stage is accounted for by the use of a probability function.
|
FIGURE 2 |
|||||
|
Features that can be affected: |
Function, relative abundance, composition, structure, dynamics, behaviour, variation (beyond natural variation) |
||||
| |
Description on level of impact |
Designation |
|||
|
Descriptor |
Extent |
Intensity(degree) |
Reversibility |
Confident |
Low |
|
Catastrophic |
Across the whole of the component (species population, community or habitat) |
Effective extinction, eradication or destruction of the component (species, population, community or habitat) |
Irreversible highly uncertain recovery of the component or recovery inconceivable over a very extended time frame |
A |
A* |
|
Severe |
Across a substantial proportion of the component |
Severe disruption or damage to the component |
Long-term recovery of the component (many decades or so) |
B |
A* |
|
Major |
Across a large proportion of the component |
Significant disruption or damage to the component |
Component recoverable over a decade or so |
C |
B* |
|
Slight |
Across a small but discernable proportion of the component |
Partial disruption or damage to the component |
Rapid recovery of the component (within a year or so) |
D |
C* |
|
Insignificant |
No discernible impact on the component |
E |
D* |
||
8.3 Key fishery impacts
The impact characterization workshop identified the following impacts.
Seabirds - Northern giant petrel, Campbell albatross, Black-browed albatross, White-chinned petrel, and Sooty shearwater all rated D; Chatham albatross rated D*; Salvin’s albatross, Buller’s albatross, White capped albatross were all rated C.
New Zealand fur seal rated C*
Benthic environments and associated communities[56] - rocky bottom rated C**; Sands, shingles and sediments, Seamounts, and Canyons all rated C** when using bottom or near bottom trawls over existing trawls paths with gear not touching the bottom and A** for areas disturbed when the bottom is impacted. Mid-water trawls for all benthic environments were rated D**.
The remaining seabird, marine mammal and other species considered at the workshop all received an E rating. Thus a key outcome of the workshop was the identification of a relatively narrow suite of impacts that required mitigation.
9. RISK CHARACTERIZATION WORKSHOP
9.1 Workshop objectives and process
In essence, the risk workshop needed to consider long-term progressive consequences of the impacts identified and ranked in the first workshop; that is, the cumulative effects caused by the ongoing impacts. Because we could not predict future changes to the nature of fishing operations it was assumed that, for the purpose of the workshop, risks would be identified in regard to current fishing practice and activity, i.e. that over time there would be no change to fishing practices, areas, gears and amount of fishing effort.
The specific objectives of the workshop were
i. to build on the impact workshop by identifying and assessing the potential risks relating to key ecological processes and interactions associated with those component impacts that were identified and assessed at the impact workshop as having higher than "insignificant" impact and
ii. to identify information and, or, conceptual gaps that needed to be addressed in order to undertake a more comprehensive ecological risk assessment in the future.
The workshop progressed through a series of tasks as follows.
i. identification and description of key ecological processes and, or, systems and major interactions relevant to the fishery
ii. consideration of some potential impact and effect scenarios, based on current fishing activity and impacts[57] and
iii. preliminary characterization of the likelihood and potential ecological effect of some scenarios.
An important focus of the workshop was to identify any information or conceptual gaps that might limit the ability to fully characterize risks. This approach acknowledged that knowledge gaps were likely to result in an indicative or preliminary (rather than definitive) risk characterization.
9.2 Barriers to comprehensive ecological risk assessment
Not surprisingly, the workshop identified a number of barriers to completing a comprehensive risk assessment. Key barriers included the following.
Lack of a relevant (and nationally accepted) ecologically-based spatial characterization of the hoki fishery. The absence of an agreed and accepted spatial characterization of the fishery proved a significant barrier to agreeing on an appropriate lens through which to assess effects on and risks to key processes. The difficulties of treating the fishery as a single entity meant that by default we were trying to assess the entire New Zealand marine environment as a single ecosystem and this became overwhelming for the group. In the absence of any other available framework the group elected to characterize risks in the context of fishery management areas (i.e. Chatham Rise, Cook Strait, West Coast South Island, etc.), while acknowledging the limitations of this approach. Further consideration needs to be given to the relevant scale and definition of ecosystem boundaries in the context of ecological risk assessment. For example, can fishery management areas be meaningfully overlain on ecosystems? And, if not, how should the relevant scales be determined?
Lack of an agreed framework for considering ecological processes, the interactions between these processes and the key cause and effect relationships. Again, in the absence of an accepted framework the workshop group elected to draw on the ecological process categorisation developed in the context of the Australian Oceans Policy work (i.e. energy sources, nutrient flows and biological production; energy flows and food webs; population dynamics; dispersal and migration; and physical and biological processes). Clearly further work is required to characterize and describe ecological processes in relation to the fishery; however, questions remain as to how far this can progress given the limitations in knowledge about critical aspects of ecosystem structure, integrity and health.
Lack of an agreed reversibility time frame. Different workshop participants had different views as to what constituted an appropriate reversibility or recovery time frame in relation to the identified impacts. There were also different views on the extent to which current fishing practices have shaped the ecosystem and the likely effects of stopping the relevant practices on those ecosystems.
Given these significant barriers, the group agreed that only preliminary and indicative risk characterizations could be completed in the workshop and the focus should be on identifying gaps in our understanding, rather than completing definitive risk assessments. In this light, it was agreed that the impacts identified in the previous phase would constitute the formal findings of the ERA.
9.3 Next steps
Despite the barriers identified above, the risk characterization workshop marked an important milestone in terms of completing the ERA. In particular, it provided an opportunity to determine more clearly the information and conceptual gaps in our knowledge of ecological processes.
An important next step will be to compile a more comprehensive ecological description of the fishery, beginning with reviewing and interpreting existing information in the light of the requirements of ecological risk assessment. Areas that could usefully be developed further from the work undertaken at the risk workshop include identifying and describing
marine ecosystems associated with the hoki fishery, including appropriate (ecological) spatial scales and
major ecological processes associated with the hoki fishery.
In considering the risk evaluation process it became apparent that it may be useful to focus on building a broader information base for all middle-depth species, rather than just hoki, especially given the interrelationships between different fish species and the interconnectedness of the middle depth fisheries. This may also open the way for more comprehensive impact and risk assessment of closely related middle-depth fisheries such as those for squid (Nototodarus sloanii and N. gouldi), ling (Genypterus blacodes)..hake (Merluccius australis) and southern blue whiting (Micromesistius australis).
10. ECOLOGICAL RISK ASSESSMENT FINDINGS
The hoki ERA demonstrated that impact assessment is a useful tool for fishery management. The impact characterization phase of the ERA provided a robust process for determining, assessing and ranking fishery impacts. However, full ecological risk assessment in the marine environment continues to push the boundaries of current knowledge of complex and poorly understood ecological processes. Thus, while various components recorded an impact rating in the impact characterization phase of the ERA, the potential ecological effect of these impacts is still unclear and will remain so in the absence of better information, or until we are better able to interpret the information we do have.
The ERA therefore concluded that management responses should be precautionary in nature and directed at mitigating the impacts identified in the impact characterization phase of the ERA (i.e. impacts on some species of seabirds, fur seals, and benthic environments and communities) with the aim of reducing or eliminating any potential ecological risks at source. The underlying assumptions are that any component impact may have a potentially harmful effect on associated ecosystems and processes.
11. CONCLUSIONS
New Zealand hoki is the world’s first large trawl fishery to gain MSC certification. To some extent the fishery has served as a test case for the MSC in developing certification requirements for trawl fisheries and especially for assessing the wider environmental impacts and associated ecological risks of these fisheries.
The ERA was an important first step in gathering together knowledge on the broader ecological impacts and risks associated with the fishery. The hoki experience provided an opportunity for all stakeholders (including government agencies, environmental NGOs, industry and the MSC itself) to participate in designing and applying a comprehensive ERA methodology.
The challenge now is to continue working to implement robust management responses aimed at mitigating the identified impacts and that are supported and endorsed by the various stakeholders in the fishery. The hoki fishery plan will serve as the vehicle for translating the increased understanding of ecological impacts gained through the ERA into specific operational responses within the New Zealand regulatory framework. For example, a seabird bycatch management strategy has been developed to respond to impacts identified in the ERA and it will also guide the HFMC’s response to the government’s recent National Plan of Action to Reduce the Incidental Bycatch of Seabirds in New Zealand Fisheries (MoF 2003), as well as forming a component of the hoki fishery plan.
The HFMC has demonstrated that it is committed to sustainable environmental practices in managing the hoki fishery. In doing so it is providing for effective stakeholder participation in the management of the fishery. However, running a truly multi-stakeholder process has at times proved challenging and has required the on-going commitment of all parties to the process. Moreover, ongoing changes to the domestic regulatory framework (e.g. the parallel implementation of management measures such as fisheries plans, environmental management strategies, seabird mitigation plans of action, etc) has at times dissipated the HFMC’s ability to focus on implementing the outcomes of the ERA. For this reason the HFMC is now seeking to streamline its operational requirements under the MSC process and the domestic management regime through a single business planning process.
Despite the various challenges encountered in developing and applying the ERA, and in moving through to the implementation phase, it is clear that the ERA has provided a useful mechanism and, perhaps even more importantly a process to examine the wider environmental impacts of the fishery. Certainly, the ERA has proved an excellent vehicle for identifying the key impacts of the fishery and providing for broad stakeholder engagement in the management of the hoki fishery.
12. LITERATURE CITED
Australia/New Zealand Standard for Risk Management
(AS/NZS4360).
See <http://www.activeaustralia.org/business/riskstandard.htm>.
Livingston, M.E. 2002. Potential interactions between New Zealand’s hoki fishery and key components of the marine ecosystem and associated processes. NIWA report prepared for. URS New Zealand Limited. 39pp.
MoF 2003 Draft National Plan of Action to Reduce the Incidental Bycatch of Seabirds in New Zealand Fisheries, NZ Ministry of Fisheries and NZ Department of Conservation, August 2003. 58pp.
N.J. Bax[58], R. Tilzey[59], J. Lyle[60], S.E. Wayte[58], R. Kloser[58] and A.D.M. Smith[58]
1. INTRODUCTION
All over the world, in marine and freshwaters, on continental shelves and in deepwater, fisheries have been found, established and overfished. Recent statistics indicate that 18 percent of the world’s fisheries are overexploited and a further 10 percent are significantly depleted (FAO 2002). Deepwater fisheries seem particularly prone to a boom and bust cycle (Miller 1999, Moore 1999). Overfishing does not seem to be limited by the stage of a country’s development, the political system or the level of scientific advice. Indeed many examples of overfishing have occurred in the world’s most developed countries under the auspices of well-established management structures and in spite of high standards of stock assessment.
One of the core reasons why we have often failed to manage fisheries for sustainability is uncertainty. It is the objective of this paper to examine how scientific uncertainty and mistakes in judgement, combined with management and implementation shortcomings, led to the decline of the Australian orange roughy fisheries, and in particular the Eastern Zone fishery. This is not to suggest that this fishery is a unique example of uncertainty and mistaken judgement. Unfortunately, there is no reason to believe that similar shortcomings do not exist in the management of all fisheries, other natural resources and any endeavor where humans are required to predict future events and their part in controlling it.
2. ORANGE ROUGHY
Orange roughy is a long-lived species with a maximum age of over 100 years. It is distributed throughout the temperate regions of the world’s oceans at depths of 450 to 1 800 m (Branch 2001). They form dense spawning and non-spawning aggregations on topographical features such as seamounts, but are also widely distributed at low densities in other areas. Commercial fishing for orange roughy first began in New Zealand in 1979 and now trawl fisheries for orange roughy occur in Australia, New Zealand, the North-East Atlantic, Namibia and Chile, as well as on the high seas (Branch 2001).
3. THE AUSTRALIAN FISHERIES
Australian orange roughy fisheries can be conveniently divided into the five following categories. The examples provided do not include all Australian orange roughy fisheries but are representative of the scientific, industry and management issues that are faced.
i. Exploratory fisheries, characterized by government subsidies and limited management controls, e.g. Sandy Cape 1986/87, Kangaroo Island 1988, Port Lincoln 1989, St Helens 1989-1992 (Figure 1)
ii. Fishing for catch and reserve sustainability, characterized by well-defined strategies and performance criteria to be achieved through controls on total allowable catch (TAC) (e.g. Eastern, southern and western management zones 1993 - until 2004 or fishery failure)
iii. Recovery, characterized by fishing at low levels to allow stock rebuilding while funding a well-defined monitoring strategy (proposed for St Helens 2004-?)
iv. Precautionary management, characterized by caps on total catch prior to the fishery and fishing at a level that is unlikely to lead to produce an unregulated fishdown (e.g. Cascade Plateau 1996-ongoing) and
v. Management under the 1982 United Nations Law of the Sea Covention (LOSC), characterized by internationally-agreed management of stocks that straddle national borders (e.g. South Tasman Rise 1997-ongoing).
|
FIGURE 1 Between 1984 and 1989 the South east Fishery was divided into three sectors, with roughy primarily being caught in the South West Sector that included, the Western, Southern, Southern remote zones and the eastern Zone as far north as the north east tip of Tasmania.
|
In this paper we first provide the background to the fishery - the Type 1 exploratory fisheries - and then concentrate on the eastern zone (including St Helens) for a discussion of the failure to fish for sustainability (Type 2). Development of a Type 3 fishery - as against a failed Type 2 fishery where the hard decision to close has not been taken - will not be discussed here. The Cascade Plateau is discussed briefly as an example of precautionary management (Type 4). Type 5 fishery management, under the LOSC did not eventuate before 2001 because of lack of ratification by a requisite number of countries. This delay in ratification led to failure to cap South Tasman Rise catches with Australian vessels taking advantage of delays in the bilateral agreement to continue fishing. In 1999 the agreed bilateral TAC (between New Zealand and Australia) was exceeded by New Zealand vessels, while unregulated fishing occurred by two South African and one Korean vessels. The South Tasman Rise fishery has not recovered to date.
3.1 Management objectives, strategy and performance criteria
Up to the mid-1980s fisheries off Southeast Australia were managed by the states, primarily through input controls. In 1985, the Australian Fisheries Service (AFS), a division of the Department of Primary Industries, took over management of the fishery for the Commonwealth. The South East Trawl Management Advisory Committee (SETMAC), which has participants from industry, management, science and (more recently) the World Wildlife Fund for Nature (WWF), was established.
Principal Commonwealth objectives in the management plan for the southeastern trawl fishery were (Australian Fisheries, August 1984):
ensuring through proper conservation and management measures, that the living resources of the Australian fishing zone are not endangered by over-exploitation and
achieving the optimum utilization of the living resources of the Australian fishing zone.
There was no formal assessment group for the South East Fishery (SEF) and the Demersal and Pelagic Fisheries Research Group (DPFRG) - an unfunded research advisory group - was asked to take on this task. But perhaps the most significant aspect of the Commonwealth plan, as presaged by a ministerial announcement on 6 July 1981, was that the fishery would become closed to operators without a licence, effective on 31 March 1985; licence applications would be judged on "a demonstrated commitment to the fishery"(Australian Fisheries, August 1981). New licences would only be available for particular development or exploration programmes at least until 1987. However, restricted temporary licences would be provided to three large trawlers to determine viability of deepwater trawling off Tasmania; they would not be able to fish in other parts of the South East Fishery. This restriction did not last for long and by 1990, 67 vessels would report catches of orange roughy from the southwestern sector (Wayte and Bax 2002), while the number of tows in the sector trebled between 1986 and 1990 (Tilzey 1994).
In December 1991 management of the SEF changed from primarily input controls to output control in the form of an individual transferable quota (ITQ) system. Again, the AFS relied for control on the DPFRG to provide stock assessments prior to establishing TACs for the 16 species placed under quota. For orange roughy, different TACs apply to the zones in the fishery where substantial catches of orange roughy had been taken (Figure 1). In 1992, management of the fishery passed from the AFS to a statutory authority, the Australian Fisheries Management Authority (AFMA). In 1993 AFMA developed general management objectives, strategy and performance criteria for the South East Fishery and established formal assessment groups to provide scientific advice to managers. Specific objectives - a target reference point of 30 percent pre-fishery biomass and a limit reference point of 20 percent - for the orange fishery were developed in 1994 following input from the assessment group and were applied to manage the eastern, southern and western zones. The 30 percent target reference point was endorsed by an international review (Deriso and Hilborn 1994). In 1995, a time frame for recovery to 30 percent pre-fishery biomass of 5-10 years was established by the AFMA and this time frame was made even more specific in 1996 so that recovery was required by 2004 (i.e. 10 years from the first strategic plan; Bax 1995). At the same time the action of closing the fishery, if the limit reference point of 20 percent was reached, was removed. Closure became an option for the assessment group to consider and there was no agreed management action if 20 percent was reached. Also, a 1993 performance criterion, that industry would generally accept the assessment and TACs, was removed by the AFMA, although it remained a unspoken rule for the assessment group (which was run on consensus) and became critical in delaying implementation of the results from the 1997 assessment.
The 1993/95 strategies and performance indicators remain unchanged despite their being impossible to achieve with the 2002 eastern zone biomass being estimated at 7-13 percent of the prefishery biomass (Wayte and Bax 2002) - there appears to be no formal mechanism to change them. In 2003 the AFMA Board asked SETMAC why the eastern zone orange roughy fishery should remain open. This is a difficult question to answer in the absence of achievable management objectives. While international reviewers recommended the formal evaluation of management procedures to identify one that has a high probability of stock rebuilding - i.e. one that is robust to data and model uncertainty (Francis and Hilborn 2002) - there is no funding for this work. In lieu of this, the assessment group provided estimated time to a detectable increase or recovery of the fishery under different assumptions and TACs and provided a plan that would monitor recovery on a three-yearly interval, while providing semi-quantitative monitoring in the other years so that any further precipitous decline would be detected (Wayte and Bax 2002). It was agreed that monitoring would be funded by industry based on the success that the orange roughy industry had had with industry-funded research and assessment for the Cascade Plateau fishery, and given that other funding sources were no longer available for ongoing monitoring. The strategies and indicators for this approach have not been defined.
3.2 Exploratory fisheries
The exploratory period of orange roughy fishing in Australia extended from the mid-1970s to 1992. It was a time of significant changes for the South East Trawl (SET) fishery. Starting in the mid-1970s, and especially since the declaration of the 200- mile exclusive economic zone in November 1979, the Commonwealth Government developed a range of policies to provide Australians with increased opportunities to exploit fishery resources. These ranged from boat building subsidies to exploratory fishing programmes, particularly in the SW Sector (Eastern, Southern, Southern Remote and Western zones, shown in Figure 1) where, following the New Zealand experience, it was hoped orange roughy aggregations would be found (Commonwealth Minister for Primary Industry, Peter Nixon in Australian Fisheries, October 1982). Fishers were well aware that quotas were being used in New Zealand to protect orange roughy stocks from overexploitation. Many would have concluded that they had better be seen to be in at the beginning of any promising new fishery if they were to be assigned quota later. Meanwhile, new research catches of orange roughy produced headlines in Australian Fisheries (e.g. Wilson 1982a). The first promising catches of orange roughy were taken off western Tasmania by the R.V. Challenger in late 1981 (Wilson 1982b). Using commercial and survey data, Wilson (1984) estimated the orange roughy resource to be 51 600 t with an annual yield of 4 125 t ± 1300 t.
Exploratory commercial fishing for orange roughy commenced in 1982. Increased effort was produced by the granting of three restricted temporary licences to large trawlers (>32 m long) to encourage greater exploratory activity in the SW Sector (Tilzey 1994).The first substantial catches of orange roughy were taken off Sandy Cape, western Tasmania, in 1986 when a non-spawning aggregation was found (Figure 2). Several other non-spawning aggregations were found in this area and fished from 1986 to 1988. The number of shots increased by 50 percent over the same period as vessels moved in to the SW Sector from other areas of the SEF where overall the number of tows declined 5 percent (Tilzey 1994). Based on area-swept methods it was concluded that 16 percent of the Sandy Cape and about 50 percent of the Beachport aggregations were removed in one year (Anon. 1988). These aggregations did not reappear a second year. Together with catches of dispersed orange roughy, landings ranged between 4 200 and 8 500 t per annum between 1986 and 1988. Early Australian catches were compared favourably with early New Zealand catches and the deepwater fishery was seen as entering a particularly "exciting phase"(Williams 1987). Scientific biomass estimates of hundreds of thousands to millions of tonnes in a small part of the area (Harden Jones 1987, Kenchington 1987) that would later be found to be mistaken can only have fueled the speculative fervor.
In June 1987, the AFS announced a 20 000 t catch limit, proposed a quota system and made an urgent request for an assessment of the resource. A preliminary ("inspired guesswork") assessment, critically based on fishers’ observations and theoretical assumptions of packing density, suggested a biomass of 500 000 to 700 000 t between Sandy Cape and Cape Grim (Kenchington 1987). But because it was also assumed that roughy were more likely to be slow growing and long-lived (maximum age of 150 years; natural mortality = 0.03), and recognizing that the biomass could be off by a factor of 10 in either direction, Kenchington (1987) recommended an annual quota of 2500 t and cautioned that optimum yield could be less than 1 000 t or more than 10000t. He recommended that the South East Trawl Management Advisory Committee (SETMAC) consider limiting catches during the fishing down phase[61], rather than having to face the disruption of a 90 percent reduction in quotas in five years time when the biomass built up over many years had been reduced and the fishery was reduced to the sustainable yield. He did however conclude that "this (limiting catches) is not a matter for biological analysis." Kenchington’s 1987 assessment would never have an impact as after 5 000 t of roughy was taken from the Sandy Cape ground, primarily during a 90-day period in the summer of 1986/87, when catch rates remained at over 10-15 t/hr for 40 days (Merryl Williams in Anon. 1988). The fish did not return in numbers the following year and catch rates never went above the 1t/hr background level.
|
FIGURE 2
|
Further orange roughy ‘hotspots’ were discovered in the Great Australian Bight. In 1988, seven vessels fished the Kangaroo Island aggregation; next year 27 vessels fished the Port Lincoln aggregation. Fishers experienced a short duration of good catch rates and depressed prices and the approach was characterized as a "gold rush" (Australian Fisheries, July 1989). Orange roughy catches in the entire Great Australian Bight have rarely reached a quarter of the 1988/89 catches since 1990 (Wayte and Bax 2002).
Australian scientists reviewing the small early fisheries off Sandy Cape and Beachport (the latter was rapidly fished down following a research vessel getting higher than average catch rates during a scientific survey (Anon. 1988) expressed concern that apparently significant fractions of the virgin biomass had been removed and that the current fishing process could be expected to rapidly deplete an unproductive population. "The management implications of this should be examined in more detail" (Anon. 1987). Scientists went on to recommend that a further build up of catching power during this period of transient high catches was to be avoided making the point that, given the low mortality rates, "very little catch is forgone by slow development of the fishery"(original emphasis, Anon. 1988). A feedback management policy was suggested to quickly recognize signals from the fished resource and modify management actions accordingly.
By 1989 the expected large sustained catches had not eventuated, leading the Australian Bureau of Agricultural and Resource Economics (ABARE) to conclude that the rapid increase in fishing capacity, resulting from industry expectations of a greater sustainable yield than had so far been justified, was likely to remain a major long-term problem with fish stocks put under greater fishing pressure than could be sustained (Smith 1989).
The situation changed rapidly and six months later it became clear that the fishery was just beginning. The discoveries of non-spawning aggregations on hills off southern Tasmania and a major spawning aggregation on a seamount off St Helens on the east coast of Tasmania led to a dramatic increase in catches to 37 000 t in 1989 and 58 600 t in 1990 (catches corrected for misreporting and loss) (Figure 2). It was heralded as an "orange roughy bonanza" (Australian Fisheries December1989), and represented the first aggregations in Australia that were not fished out in the first year (Lyle et al. 1989). Catches were substantially higher than the 20 000 t limit introduced in 1987, and the 15 000 t TAC introduced as an interim management strategy by the AFS in 1989 (Tilzey 1994) for which there was no Commonwealth monitoring or enforcement. Following intervention by the Tasmanian minister for primary industry, and amid concerns over the apparent fragile biology of this deep-sea species, management controls on orange roughy fishing were introduced by the AFS. The Government Industry Technical Liaison Committee (GITLC) was established to promote closer cooperation between industry and scientists and in so doing to develop a stock protection strategy (Ross and Smith 1997). Further increases in catch were then prevented by the creation of the Eastern and Southern Management Zones (Figure 1) and associated TACs.
Catches in the Eastern Zone were ‘limited’ by a 15 000 t TAC in 1989 which was designed to achieve a "safe fishing-down rate (5 percent of the initial stock size per annum)."(SETMAC 20, 9 November 1989). Unfortunately the biomass estimate of 300 000 t used to set the TAC was unsupported by either scientific opinion or GITLC, although it did result in a TAC approximately equal to the catch taken that year. The TAC was reduced to a contingency level of 12 000 t in 1990 (until further scientific information became available). Scientists did not consider this to be biologically conservative given that yields for south eastern Australia were likely to be substantially less than New Zealand’s total sustainable yield estimates of 15 000-20 000 t and unlikely to exceed 8000-10 000 t (DPFRG 1990a). However, the 12 000 t limits caused some controversy with many fishermen concerned that their decreased share of the TAC due to more boats entering the fishery and low prices might make it impossible to keep their boats at sea (Australian Fisheries June 1990). The number of boats landing orange roughy in Australia had increased 50 percent from 44 in 1988 to 67 in 1990 (Wayte and Bax 2002). In the same Australian Fisheries article, fisheries managers defended the TACs as being far better to ‘err on the side of conservatism’.
The first quantitative acoustic estimates of the St Helens spawning aggregation were obtained in 1990 by CSIRO (Kloser, Koslow and Williams 1996). The spawning aggregation was estimated at 57 000 t (range 30000 to 150 000 t), with an annual production of 2 700 t (range 1 300 to 5 500 t). Scientific advice was that the fishdown was almost complete (DPFRG 1990b). The group stressed the need for caution as only 1 to 3 percent of the adult virgin biomass might be able to be taken on a sustainable basis. The group drew attention to the severe depletion of the Challenger Plateau in New Zealand and consequent reduction in catches, and reiterated the need for caution in setting TACs, especially considering that TACs set too high would lead to collapse of the stock, while TACs set too low would result only in deferral of catch with little overall loss due to the long-lived nature of the species. TACs were reduced slightly to 10 700 t in 1991.
The 1990 acoustic survey result was reinforced by the 1991 survey and an independent egg- production estimate (Koslow et al. 1995). Survey results were independently reviewed at industry’s request and led to the conclusions that the stock was depleted to between 34-67 percent of the initial biomass (i.e. potentially already below the then target level of 50 percent unfished biomass) and that the sustainable yield was likely to be in the range of 1 700 to 2 600 t (DPFRG 1991). The Group reiterated the need for caution given the long time required to recover from overfishing, whereas fish not taken this year would remain in the stock for many years. The 1992 TAC was reduced further to 7 423 t. This ended the exploratory stage of this fishery. The 1991 acoustic and egg production surveys of the St Helens spawning stock were repeated in 1992. The acoustic target strength estimate was revised downwards following advice from the independent reviewer, and the backscatter estimation algorithm adjusted following advice from the manufacturer. At the same time the area of the survey was increased to include fish echoes received away from the St Helens hill. The acoustic backscatter from other species was removed based on their abundance in a trawl survey and estimated target strength. Together, these four adjustments led to an overall 37 percent decline in the previous years’ St Helens biomass estimates. An acoustic survey also took place in the Southern Zone (DPFRG 1992). Maximum likelihood stock reduction analysis models were developed based on Mace and Doonan (1988). These would later develop into a full Bayesian approach, which theoretically can take into account the full range of uncertainties related to models and parameter values, and enables the application of a formal decision-analysis approach to fishery management (Punt and Hilborn, 1997). Biomass for the Eastern Zone was estimated at 24-40 percent of pre-fishery biomass and sustainable yield at 1 200-1 500 t. If the fish in the Eastern and Southern zones were considered one stock then biomass was reduced to 12-40 percent pre-fishery biomass and sustainable yield to 2 100-3 000 t. The Group concluded that the 50 percent fishdown target that they had recommended for orange roughy in 1990 (DPFRG 1990b) had already been exceeded at St Helens.
Subsequent analyses of the catch data and discussion with industry suggested that catches (including that with burst nets, discarding and misreporting) for the four years 1989-1992 were 26 236, 23 200, 12 159 and 15119 t, or 68 percent higher than the TACs (Wayte and Bax 2002). Subsequent analyses would also show that the fishing down target of 50 percent of virgin biomass repeatedly recommended by scientists had been exceeded. For example, at the end of 1992 the Eastern Zone biomass was 25-30 percent of prefishery biomass. The Australian Fisheries Management Authority (AFMA), a statutory authority, replaced the Australian Fisheries Service, a division of the Commonwealth Department of Primary Industries, in 1992. SETMAC remained the management advisory committee responsible for orange roughy. An AFMA-appointed advisory group - often named the Orange Roughy Assessment Group (ORAG) - was initiated and included scientific, management and industry members. DPFRG, an independent group that had specifically excluded management and industry members, reverted to the review and coordination of research in 1993 - its original objective. One of AFMA’s first objectives for Australia’s South East Fishery was to ensure continuation of a sustainable fishery.
3.3 Management for sustainable yield
Eastern zone TACs were reduced markedly in 1993 to what was the upper range of the estimated sustainable yield - 1 500 t. Sustainable yields were less than had been previously estimated following downwards revision of the acoustically-derived biomass estimates. Allocated TACs would be a third higher after accounting for carryovers (uncaught TAC) from the previous year. This decrease in eastern zone TAC was substantially compensated by starting an "adaptive management experiment" or pulse fishdown in the southern zone, following the recommendations of the industry consultant. This resulted in a combined TAC of 13 000 t in comparison to a recommended sustainable yield of 2 100 to 3 000 t. The adaptive management experiment would ultimately prove unsuccessful because of misreporting of where catches were taken and the lack of a monitoring programme capable of tracking the fishdown, but southern zone TACs would remain well above the estimated sustainable yield for three years. The high TACs decided upon for the southern zone also ignored the risk that the fish in the eastern and southern zones were a single stock. As of 1993, the advice was that there was some mixing between zones, and a single stock could not be ruled out. The estimated catch in 1993 from the eastern zone was three times the estimated maximum sustainable yield and agreed TAC (Figure 2).
Precision of scientific advice improved slightly in 1993 with an extra year’s acoustic survey and inclusion of an egg production survey (Koslow et al. 1995). The 1994 TACs allocated for the eastern zone fell within the estimated yield. However a special orange roughy workshop in early 1994 (CSIRO and TDPIF 1996) detailed the uncertainties associated with the assessment and industry requested an external review of the 1994 assessment. This occurred later the same year (Deriso and Hilborn 1994). The reviewers suggesting some improvements, but overall concluded that "the methods used to measure abundance and calculate stock trajectories are consistent with the best methods used elsewhere in the world" and the assessment itself was "much less ambiguous" than orange roughy assessments elsewhere (as all indices and assessments were consistent). Importantly, the new AFMA strategy of maintaining the stock at 0.3 of virgin biomass was found to be "consistent with what is known of ecologically sustainable development" and the reviewers recommended that the AFMA adopt a policy that would be expected to keep the stock above the 0.3 level 50 percent of the time in a five-to-ten year time horizon. This led to the codification of the management strategy of there being a = 50 percent chance that the biomass was above 30 percent of the original spawning biomass, which later was refined to providing a 50 percent chance that the biomass would be above 30 percent of the original biomass in five-to-ten years (1995 assessment, Bax 1995), subsequently tightened to a 50 percent chance by 2004 (1996 assessment, Bax 1996). This was a significant departure from the original DPFRG advice that the target biomass should be "not less than half the virgin biomass", but appeared to have some support in the fisheries literature, which suggested that a limit reference point of 20 percent was not unreasonable (FAO 1993). Importantly, industry agreed to the assessment after this review, accepting in the process the much lower TACs than had been set at the start of the fishery. The concerted exploration of new areas, such as the Cascade Plateau, was triggered by the reduced TACs for the eastern and southern zones.
In 1994, following on from the new management strategy the assessment group estimated the catch levels that would give a 50 percent probability of being above 30 percent pre-fishery biomass in 2004. The catch level of 2 000 t recommended by the assessment group for the eastern zone was adopted by AFMA as the 1995 TAC, while the combined-zones TAC remained double the recommended level, being still part of the, by now, discredited adaptive management experiment. By 1995 it was estimated that there was a 73-75 percent probability of the stock being below the 30 percent of prefishery biomass target (if the fish in the two zones were one stock). TACs in both the southern and eastern zones were set at the level required to reach the target biomass in 2004.
The 1996 assessment process raised further uncertainties. The industry consultant attending the meetings questioned the values of natural mortality being used in the assessment, especially as there appeared to be some bimodality in the only catch at age curves available. The assessment group could not determine which of the two natural mortality rates was correct (0.045 or 0.064) and henceforth it was decided that both would be reported in assessments. This had the unfortunate effect that under one scenario, reduction in the combined eastern and southern zones TAC to 2 800 t was essential if the strategic objectives were to be met, while under the other scenario no reduction from the 1996 TAC of 6 000 t was acceptable. The southern zone TAC 1997 was reduced to 4 000 t, above the 3 200 level recommended by the assessment group.
There was increased concern among scientists during the 1997 assessment that the 2004 target could not be met (Bax 1997). These concerns were due to a recently completed study on otolith shape, which added to the probability that fish from the eastern and southern zones were from a single stock (Robertson et al. unpublished ms). In addition, refinement of earlier acoustic abundance estimates, due to a redefined survey area (based on improved topography), manufacturer calibration error, and corrections to inconsistent assumptions of acoustic deadzone height for the earlier surveys led to reduced biomass estimates in recent years, but a higher biomass estimate for 1990 (Bax 1997). Further complicating the assessment was the apparent redistribution of fish between St Helens (the traditional main ground), and the nearby St Patricks Head so that catch and effort at the two areas was approximately equal (Figure 1). This cast doubt on the 1996 acoustic biomass estimate of the fish at St. Helens derived from the first acoustic biomass estimate since 1992. Future population projections were no longer provided for the eastern zone alone and under the assumption of a lower rate of natural mortality a reduction in catches of more than 50 percent was required to meet management goals for the combined zones. Estimates using the higher rate of natural mortality indicated that no decrease in catch levels was necessary. Industry disagreed with the 1997 assessment results and included a separate position statement in the annual assessment report (Bax 1977). As a result, eastern zone TACs would not be reduced until 2001. Southern zone TACs were reduced to 1000 t but remained far above the catches taken.
Stock assessments were halted in 1998 and 1999 while the available assessment group resources were redirected to address industry concerns over the 1997 assessment. There was a continued shifting of effort to St Patricks Head and since 1999 catches there have been double those on St Helens (Wayteand Bax 2002). The assessment in 2000 had the agreement of industry that all that could be done had been done to address their concerns. However the assessment did not indicate the resource was in any better condition than estimated in 1997. Assuming natural mortality of 0.048, a zero catch (combined zone) or a maximum of 1 000 t (eastern zone alone) was all that could be taken. Under the higher rate of natural mortality (0.064) the existing catch of 2 000 t (eastern zone) or 2 350 t (combined zones) would meet the agreed management goals for the fishery. TACs for 2001 remained unchanged at 2000 t for the eastern zone and 2 700 t for the combined zones.
Some of the ambiguity from reporting on two possible levels of natural mortality was reduced in 2001 by fitting the assessment model to the age composition data and, with catches being maintained at the same level as previous years, the outlook became steadily worse. While under some scenarios it was still possible that strategic objectives could be met, overall it was "increasingly unlikely that AFMA’s performance indicator can be met without a substantial reduction in the Eastern Zone TAC" (Wayte and Bax 2001). TACs for the following year were reduced by 10 percent following a SETMAC policy of not reducing TACs by more than 10 percent to reduce disruptions to industry and concerns over what effect displaced effort, especially from the larger vessels, would have on other already fully or over-exploited inshore fish species.
An additional age composition sample taken in 2001 further reduced assessment ambiguities (Mwas now estimated at between 0.039 and 0.042, instead of the range of 0.045 to 0.064 that had been used since 1996) and the 2002 assessment made it clear that, with less than 15 percent of prefishery biomass remaining, "the AFMA performance criterion for this fishery will not be met even with a zero catch."(Wayte and Bax 2002). Additional modelling indicated that the eastern zone performance criterion would not be met for 6-17 years even with a zero catch, or 9-27 years with continued catches of 800 t. The 2002 TAC was set at 800 t, but notice was given that this would not necessarily be continued. Given the implications for industry of the 2002 assessment, a second international review was requested (this time by the assessment group). While the reviewers had specific recommendations on how the assessment could be improved, overall they found the assessment to be "consistent with world best practice", and the stock to be "at a level of biomass that most biologists would consider too low"(Francis and Hilborn 2002). The reviewers gave support to 40 percent of prefishery biomass being a commonly accepted target biomass level, but stressed that what was most important was that the stock be demonstrated to be in the process of rebuilding.
Between 1993 and 2003, scientists had recommended that in aggregate between 10 000 and 18000 t could be caught if AFMA’s performance criteria were to be met. Resulting TACs were always closer to the upper end of the range than the lower end. Over the same period, aggregate TAC was 20 000 t and actual catch 3 000 t higher.
3.4 Precautionary management
The Cascade Plateau is a rocky seamount 125 nm ESE of Hobart, Tasmania that has been fished consistently since 1996. A 1 000 t precautionary quota had been set for this fishery by SETMAC before consistent fishing began. As TACs for eastern and southern zones declined, a few operators (with larger vessels) started to explore the Cascade Plateau. In 1996 863 t were caught and in 1997 the 1 000 t trigger was reached by late April. AFMA closed the fishery and requested that the assessment group consider the Cascade Plateau stock status. In May of the same year a research and fishing proposal was developed by ORAG and submitted to AFMA to support development of a long-term management strategy for this fishery.
The research and fishing proposal was designed to be precautionary, in effect requiring demonstration that fishing on the Cascade Plateau would be ‘safe’ for the stock, instead of scientists having to prove that it would have an adverse effect. It was proposed that a controlled level of ongoing commercial fishing would be allowed monitored closely by scientific observers. A levy base was established to support a range of scientific studies leading to an acoustic or egg production biomass estimate of the spawning aggregation (e.g. Prince and Diver 1999, Prince and Diver 2001). Given this cooperative research approach, the 1000t trigger was increased to a 1 600 t TAC. To increase knowledge on the dynamics of orange roughy on the Plateau, the 1 600 t TAC was divided into four 400t quarterly TACs providing year-round information and reducing the potential for fishing to concentrate on the spawning aggregation if the fishery were to start to decline.
From 1998 to 2003, the 1 600 t TAC has been caught, the spawning aggregation defined and delimited and a type of acoustic monitoring by industry vessels developed. Acoustic biomass estimation was not practical with the equipment available, although estimates of school volume gave some reassurance to ORAG that the aggregation was not in precipitous decline (Wayte and Bax 2002). As increasingly sophisticated acoustic equipment became used in the fishery, an acoustic estimate of the spawning biomass was made in 2003 using methods comparable to earlier scientific surveys in other Australian fisheries. The results of that survey will be available before the 2005 Cascade Plateau TAC is set.
4. DISCUSSION
Exploitation of Australia’s orange roughy fisheries has been characterized by uncertainty in stock structure, standing stock and sustainable exploitation rates. Looking forwards, uncertainty is a somewhat benign and intellectually stimulating, if sometimes frustrating aspect of interacting with complicated systems. Looking backwards, uncertainty is error, misjudgment and wishful thinking.
Uncertainty is often understood as implying that there is range of possible values around the best estimate, and that this range is somewhat symmetrical, although not perhaps on an arithmetic scale. For this fishery, uncertainty has been characterized almost uniformly by overly optimistic interpretations of the present and future states of the fishery. Looking back at the history of scientific advice during the exploratory stage of the fishery, starting with Kenchington (1987) for the Sandy Cape fishery through to DPFRG for the St Helens fishery (DPFRG 1990a) catches of several thousand tonnes were recommended. TACs were set an order of magnitude higher and were either not enforced or failed to take into account lost and discarded fish, so catches were considerably higher.
At various and repeated, times during the exploitation of these fisheries fishery scientists and managers have made mistakes on where we were, where we were going, and how we were going to get there. In the exploratory stage of the fishery, misinterpretation of bottom features as fish shoals, taken together with high short-term catch rates, and a goldrush mentality to fishing in an almost unregulated fishery, led to unrealistic expectations and excessive transfer of capital into the fishery. This was no doubt influenced by the large orange roughy stocks that had been previously found and fished in New Zealand, declining catches elsewhere in the South East Trawl fishery and by the understanding among fishers that if quotas were introduced they would be based on catch history, so there was no time to lose in getting into their orange roughy fishery. Subsequently, during what should have been the sustainable fishery - after industry had agreed to much lower, but sustainable TACs - errors in acoustic biomass estimates and new data on stock structure and age composition led to recommendations for further decreases in TACs, that were implemented only after several years’ delay.
The assessment group responsible for providing orange roughy advice still does not know where it is going with this fishery. At the start of the fishery, scientific advice was clear that biomass should not be reduced below 50 percent of prefishery biomass (DPFRG 1990b). This limit was soon passed and in 1994, AFMA, acting on advice from the assessment group, determined that 30 percent of prefishery biomass was the target, which was subsequently endorsed by international reviewers (Deriso and Hilborn 1994) and a timeframe to reach it was established (for fisheries already below 30 percent). Following revised scientific advice and the failure to manage to this target level, a rebuilding target of 40 percent of initial biomass was put forward by the assessment group and again endorsed by international reviewers (Francis and Hilborn 2002). This target has yet to be accepted by AFMA.
Last, even if there was agreement on a rebuilding target, there has been doubt about how to get there. Total allowable catches have been consistently set at, or above, the highest levels recommended by scientists and estimated catches consistently exceeded the TAC at the start of the Eastern Zone fishery. In addition, and despite DPFRG concluding that the "greatest danger to the resources and industry is... from a build up of catching power during the transient period of high catches" (Anon. 1988), there seems to have been no restriction on permits given to develop the orange roughy fishery and the number of shots trebled between 1986 and 1990 (Tilzey 1994). Scientists expressed their concern that their advice was often seen as overconservative, while Australia’s record on managing fish resources at the time did not seem overly conservative given that most resources were maximally exploited and some had collapsed (Kearney 1989). Either the scientists had not been conservative enough, or else managers, because of the uncertainty in advice, had not accepted that short-term gains or stability should be sacrificed in the interest of long-term resource conservation (Kearney 1989).
Part of the process of delivering effective management advice is to ensure that decision makers recognize the full range of uncertainty before they make decisions. Scientific uncertainty is just one component of epistemic uncertainty that incorporates the perceptual, intellectual, and linguistic processes by which knowledge and understanding are achieved and communicated. It is an important part of the process of how scientific advice (and associated uncertainty) on the status of a fishery gets translated into management action. Fisheries management is not unique in the difficulty of making reliable predictions. A recent paper spells out a story for business executives that will be only too familiar to those involved in managing the world’s fisheries:
"When forecasting the outcomes of risky projects, executives all too easily fall victim to what psychologists call the planning fallacy. In its grip, managers make decisions based on delusional optimism rather than on a rational weighting of gains, losses, and probabilities. They overestimate benefits and underestimate costs. They spin scenarios of success while overlooking the potential for mistakes and miscalculations. As a result, managers pursue initiatives that are unlikely to... ever deliver the expected returns" (Lovallo and Kahneman 2003).
It might be considered unrealistic to believe that we are able to predict the future with any accuracy - at least if we base our predictions solely on our own understanding of the local system. One way to bring in additional information and potentially improve our accuracy could be to bring in information from outside sources. In providing stock assessment advice, this could involve basing forecasts on how successful similar forecasts (by species, region or jurisdiction) have been in the past. In fisheries management, a precautionary approach would be to take best (unbiased) estimates from stock assessments and then adjust them on the basis of how successful others’ best estimates have been in the past. How would the history of Australia’s orange roughy fisheries have been different if we had taken the New Zealand prior experience in overfishing orange roughy, decided that their assessment science was not dissimilar to our own and therefore concluded that we should be more conservative than our best science recommended? Unfortunately this outside view is rarely popular, often being viewed as a crude analogy to superficially similar instances and is usually rejected in favour of the inside view which is seen as a serious attempt to come to grips with the complexities of a unique challenge. Neither approach can be expected to be perfect, however the outside view has repeatedly been shown to be more accurate in systematic research (Lovallo and Kahneman 2003). Looking towards the future we recommend that both the inside and outside views be used in providing management advice for deep-sea fisheries. In this way we can learn from the costly lessons that constitute much of our history in deep-sea fisheries management.
5. ACKNOWLEDGEMENTS
The paper profited from the recollections of scientists involved in the early stages of the fishery, particularly Howell Williams and Richard McLaughlin. Peter Thompson reviewed and improved the manuscript.
6. LITERATURE CITED
Anon. 1987. Minutes of the orange roughy workshop held at the Marine Science Laboratories, Queenscliff: 22-23 October 1987.
Anon. 1988. The very ad hoc orange roughy working group meeting - 15-17 June 1998. Unpublished ms.
Bax, N. 1995. Orange Roughy 1995. Stock Assessment Report, South East Fishery Assessment Group. Australian Fisheries Management Authority, Canberra. 73pp.
Bax, N. 1996. Orange Roughy 1996. Stock Assessment Report, South East Fishery Assessment Group. Australian Fisheries Management Authority, Canberra. 36pp.
Bax, N. 1997. Orange Roughy 1997. Stock Assessment Report, South East Fishery Assessment Group. Australian Fisheries Management Authority, Canberra. 64pp.
Branch, T.A. 2001. A review of orange roughy (Hoplostethus atlanticus) fisheries, estimation methods, biology and stock structure. South African Journal marine Science. 23: 181-203.
CSIRO 1995. Orange roughy 1995. Stock assessment report. South East Fishery Assessment Group. Australian Fisheries Management Authority, Canberra. 73pp.
CSIRO & TDPIF 1996. Orange roughy 1994. Stock assessment report. South East Fishery Assessment Group. Australian Fisheries Management Authority, Canberra. 204pp.
Deriso, R. and R. Hilborn 1994. A review of the 1994 stock assessment for orange roughy. Unpublished ms. 28pp.
DPFRG 1988. Demersal and pelagic fish research group. Minutes of the 26th meeting, 4-5 July 1988. State Government Convention, Adelaide. Unpublished ms. 12p.
DPFRG 1990a. Report of DPFRG Meeting No. 29: Queenscliff,. 2-4 May 1990. Unpublished ms., 6pp.
DPFRG 1990b. Report of DPFRG Meeting No. 30: Bureau of Rural Resources, Canberra. 3-7 December 1990. Unpublished ms., 12pp.
DPFRG 1991. Minutes/Report of the Demersal and Pelagic Fisheries Research Group meeting No. 32: CSIRO Division of Fisheries, Hobart 8-11 October 1991.
DPFRG 1992. Report of the Demersal and Pelagic Fisheries Research Group Meeting No. 33: FRI, Cronulla - 19-23 October 1992. Unpublished ms., 15pp.
FAO 1993. Reference points for fishery management: their potential application to straddling and highly migratory resources. FAO Fisheries Circular. 864. FIRM/C864.
FAO 2002. The state of world fisheries and aquaculture, 2002. Rome (Italy). Fisheries Dept. 168 pp.
Francis, C. & R. Hilborn 2002. Review of the 2002 Australian Orange Roughy Stock. Unpublished ms for Australian Fisheries Management Authority, Canberra. 4 September 2002.
Harden Jones, F.R. 1987. Orange roughy (Hoplostethus atlanticus) on the west coast of Tasmania: report on a trip in the MT Seamount Enterprise 31 January to 3 February 1987. Unpublished report. Marine Laboratories, Division of Fisheries Research, CSIRO, Tasmania. Final revision, 31 March 1987.
Kearney, R.E. 1989. Is fisheries management becoming harder? Australian Fisheries. March 1989: 34:37.
Kenchington, T.J. 1987. Through a glass darkly: a preliminary assessment of an orange roughy resource off Cape Grim. Unpublished ms presented to DPFRG in February 1987, and again at the DPFRG Workshop on Trawl Fish Resources, Sydney 25-26 June 1987.
Kloser, R.J., J.A. Koslow, & A. Williams 1996. Acoustic assessment of the biomass of a spawning aggregation of orange roughy (Hoplostethus atlanticus, Collett) off Southeastern Australia from 1990-1993. Marine and Freshwater Research. 47: 1015-1024.
Koslow, J.A., C.M. Bulman, J.M. Lyle & K.A. Haskard 1995. Biomass assessment of a deepwater fish, the orange roughy (Hoplostethus atlanticus), based on an egg survey. Marine and Freshwater Research 46: 819-30.
Lovallo, D. & D. Kahneman. 2003. Delusions of success. How optimism undermines executives’ decisions. Harvard Business Review. July 2003: 56-63.
Lyle, J., J. Kitchener & S. Riley 1989. Orange roughy bonanza off Tasmania. Australian Fisheries. December 1989: 20:24.
Mace, P.M. & I.J. Doonan 1988. A generalized bioeconomic simulation model for fish population dynamics. New Zealand Fisheries Assessment Document 88/4.
Miller, R.J. 1999. Courage and the management of developing fisheries. Canadian Journal Fisheries aquatic Science. 56: 897-905.
Moore, J.A. 1999. Deep-sea finfish fisheries: lessons from history. Fisheries. 24:16-21.
Prince, J. & G. Diver 1999. Industry survey of the Cascade Plateau orange roughy fishery. Final report. Biospherics Pty Ltd., P.O. Box 168, South Freemantle, Western Australia. ISBN 09585910 4 0.
Prince, J. & G. Diver 2001. Industry survey of the Cascade Plateau orange roughy fishery in 2000. Final report. Biospherics Pty Ltd., P.O. Box 168, South Freemantle, Western Australia.
Punt, A.E. and R. Hilborn 1997. Fisheries stock assessment and decision analysis: the Bayesian approach. Reviews in Fish Biology and Fisheries. 7: 35-63.
Robertson, S.G., D.C. Smith & A.K. Morrison (unpublished). Insights into the stock structure of orange roughy off southeastern Australia using Fourier shape analysis. Unpublished manuscript submitted to the Orange Roughy Assessment Group (Bax 1997) by Marine and Freshwater Research Institute, Queenscliff, Victoria, Australia.
Ross, D.M. & D.C. Smith 1997. The Australian Orange Roughy Fishery: A Process for Better Resource Management. In D. Smith (Ed.) 1997. Proceedings of the 2nd World Fisheries Congress.
Smith, P. 1989. Australian Fisheries. March 1989: 22-29.
Tilzey, R. 1994. The South east Fishery. A scientific review with particular reference to quota management. Bureau of Resource Sciences, Canberra, 360pp.
Wayte, S. & N. Bax 2001. Orange Roughy 2002. Stock Assessment Report, South East Fishery Assessment Group. Australian Fisheries Management Authority, Canberra. 32+xxvi pp.
Wayte, S. & N. Bax 2002. Orange Roughy 2002. Stock Assessment Report, South East Fishery Assessment Group. Australian Fisheries Management Authority, Canberra. 31+xxiv pp.
Williams, M. 1987. Biological research on orange roughy steps up. Australian Fisheries. June 1987: 2-5.
Wilson, M. 1982a. Tasmanian survey finds spawning orange roughy. Australian Fisheries. November 1982: 2-5
Wilson, M. 1982b. Challenger reveals potentially important roughy resource off Tasmania. Australian Fisheries. May 1982: 2-3.
Wilson, M. 1984. An assessment of the lightly exploited trawl fish resources of the developing zone. DPFRG Workshop on trawl fish resources, Sydney 27-29 March 1984: 266-287.
|
[50] Enfocus Consulting
Ltd |
![]()
![]()
![]()
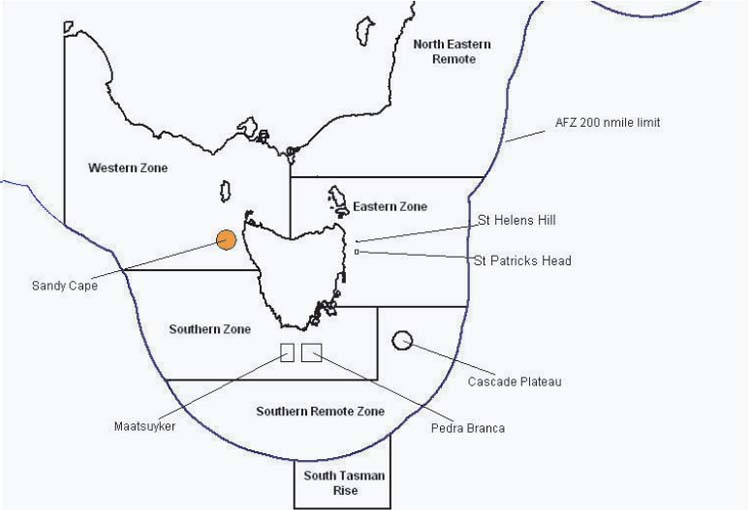

)