![]()
![]()
![]()
D.S. Butterworth and A. Brandão
Marine Resource Assessment and Management Group
Department of Mathematics and Applied Mathematics
University of Cape Town
Rondebosch 7701, South Africa
<[email protected]>
1. INTRODUCTION
The mid-1990s saw the development of an interest among South African and Namibian fishing companies in exploration to discover deepwater fisheries resources. However, no economically viable fishable concentrations were found off the South African coastline. In nearly a decade, only two fisheries of any substance have developed:
for orange roughy (Hoplostethus atlanticus) off Namibia and
for Patagonian toothfish (Dissostichus eleginoides) off the Prince Edward Islands, sub-Antarctic islands belonging to South Africa.
At first glance, neither of these fisheries appears a management success story. Severe declines in catch rates (CPUE) suggest greatly reduced abundances as a result of inappropriately high catch levels, primarily a consequence of IUU fishing in the toothfish case.
More recent evidence and analyses suggest, however, that the status of the resources in both fisheries may well be considerably better than the bleak picture painted by such earlier appraisals. This paper summarizes the history of the changing perceptions over time concerning the status of these resources, together with the resultant management responses and concludes with a brief discussion of the implications of these experiences for the management of deepwater fisheries in general.
2. THE NAMIBIAN ORANGE ROUGHY FISHERY
2.1 The developmental stage
Exploratory fishing for orange roughy in Namibia commenced in 1994. Although the species is present over the full length of the Namibian coast, primarily in the 500-1 100 m depth range, only four consistently fishable aggregations have been found (see Figure 1). Hotspot was located early in 1995, followed later by Johnies; the following year Frankies and then Rix were added. (Actually Rix was first located in 1995, but only confirmed to be consistently fishable the following year.)
Management controls on catches were first imposed in 1997. A biomass estimate of some 300000 t was obtained from trawl data using the swept area method (Branch 1998). The associated 90 percent probability interval of some 200000, 500 000 t took account of assessed extents of uncertainty in the various inputs required to compute the estimate. Some 60 percent of this biomass was estimated to be located outside the aggregations.
|
FIGURE 1
|
These results, coupled to population model projections of abundance under alternative possible future catch scenarios, led to an annual total allowable catch (TAC) of 12 000 t being set for 1997 (1998). The long- term fishing strategy intended at that time is shown in Figure 2: over a 14-year period the TAC would be reduced from 12 000 to 5 000 t (90 percent of MSY as estimated at that time) as the resource abundance was fished down towards its MSY level. This was seen at the time as a fairly conservative approach, because the population projections suggested that the "risk", taken to be the probability the resource would be reduced to less than half its original size by 2010 (the end of the planned 14-year fishing down period), was only a few percent (Branch 1998).
A year later, at the start of 1998, the best estimate of abundance provided by the swept area method had been revised down to 225000t, and an independent estimate of 150000t from acoustic surveys had also become available (Boyer et al. 2001). Although these revisions increased the level of "risk" compared to that computed a year earlier, it was argued that the 14-year fishing down period (Figure 2) could be reduced if need be, and the TAC was maintained at 12 000 t.
2.2 Resource collapse
Figure 3 shows the catches eventually realized by the fishery. It is evident that these did not turn out to match intentions at the start of 1997 (Figure 2). In 1999 the TAC was reduced to 9000 t, but was heavily undercaught. A year later the TAC was brought down to 1875 t. Further, the Frankies aggregation had been closed to fishing in 1999 as an experiment designed to assist in discriminating between different hypotheses (discussed below) for the decline in the fishery (Boyer et al. 2001, Branch 2001).
|
FIGURE 2 Over a 14-year period, a "soft landing" at a TAC of 90 percent of the estimated MSY was envisaged, with resource abundance still in excess of the level at the end of the period.
|
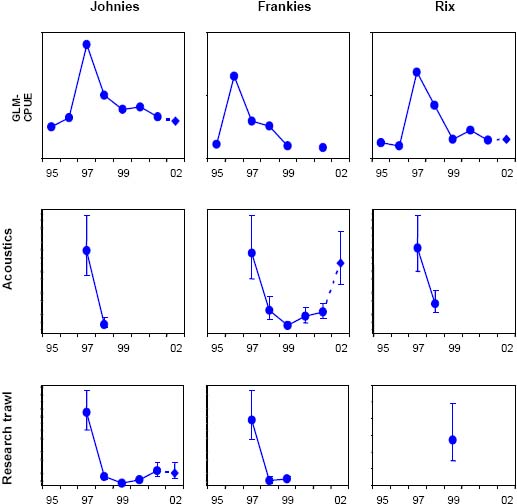
What scientific evidence underpinned this drastic action by management? Figure 4 shows the abundance indices available for the three major aggregations at the start of 2000. (Note that the Hotspot aggregation is appreciably smaller than the other three; the individual fish at Hotspot are larger and likely belong to a different population than do the fish at the more southerly aggregations.) A consistent appreciable decline in these indices from 1997 to 1999 is evident for all three aggregations; the industry’s difficulty in catching the TAC in 1999 is not surprising, given the large drop in catch rate (I.E. CPUE).Three hypotheses were put forward to explain these declines.
i. Fishing down: lower index values reflected reduced abundance as a result of removals by the fishery.
ii. Intermittent aggregation: the proportion of the population to be found at an aggregation varies from year to year (although fish are present on the aggregations throughout the year, densities increase in the July-August period when spawning takes place).
iii. Disturbance: Repeated trawl tows over small areas (the sizes of the aggregations range from about 400 to as little as 50 nm2) discourage continued fish aggregation, either because of disturbance to the fish caused by the trawls themselves, or damage done to the habitat by trawling.
|
FIGURE 3 The split years shown here refer to the July-June period; this is as now used for assessments so that the July-August spawning period, when scientific abundance surveys take place, corresponds to the start of the "assessment year". in contrast, TACs apply to an April-march year, and in the text are referred to by the earlier of the two calendar years concerned.
|
Clearly the reductions shown in Figure 4 could reflect some combination of all three of these mechanisms. The decision to close Frankies to fishing had the intent of providing a better basis to assess the relative roles played by each. However, in deciding upon the 2000 TAC, a precautionary approach was adopted: it was based on assessments conducted under the assumption that the drops in the abundance indices were the result entirely of catch-induced reductions of actual abundance.
There were reservations about the defensibility of such assessments at the time. The acoustic surveys provided estimates of biomass in absolute terms. Even when allowance was made for plausible errors in values of the factors contributing to these estimates, the declines from their absolute (tonnage) values in 1997 (see Figure 4) were too large to be statistically compatible with the hypothesis that fishery removals alone were responsible. Nevertheless the TAC was kept low in following years pending independent evidence becoming available to support the alternative hypotheses ([2] or[3]).
2.3 A brighter future
Abundance indices maintained their generally low values in 2000 and 2001. However the 2002 acoustic survey of Frankies produced a remarkable result: an estimate almost at the same level as the 1997 high point (see Figure 5). This provided the independent evidence sought that the actual declines in abundance caused by fishing removals could not be as great as earlier trends in abundance indices had suggested.
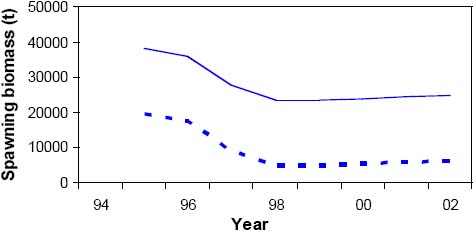
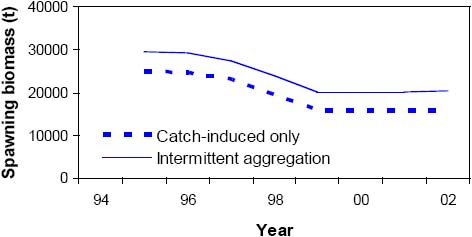
Since Frankies was the fish aggregation at which fishing had been (almost entirely) suspended, this new evidence did not permit an hypothesis of intermittent aggregation to be distinguished from one of disturbance. Nevertheless assessments were revised using a method that made allowance for different proportions of overall abundance being present at an aggregation each year (Brandão and Butterworth 2003) and under the assumption that the distribution of these proportions estimated for Frankies applied also for Johnies and Rix. The results of these revised assessments are compared to those under the "catch-induced only" hypothesis in Figure 6, which shows that these revisions lead to a much more optimistic picture of the current state of the resource.
Acoustic surveys have continued only at Frankies because of target identification problems at the other aggregations; the swept-area trawl surveys have proved practical only at Johnies as Rix has insufficient trawlable area and the high degree of aggregation of schools at Frankies leads to high variance estimates.
Table 1 lists results from these revised assessments, which reflect an increase in the estimated overall MSY from 1620 to 2750 t. In consequence the TAC for 2003 was increased to 2650t and a part of the Frankies aggregation has been reopened to fishing.
|
FIGURE 4 The CPue indices are GLM-standardized (glazer and Butterworth 2001) and cover a 12 month period of fishing. The scientific surveys (acoustics and swept-areas trawl) take place in the July/August spawning period. The error bars shown for the scientific surveys reflect a single standard error associated with survey sampling variance (i.e. further systematic errors associated with uncertainties in factors required to obtain the acoustic results in absolute tonnage terms are not incorporated here).
|
TABLE 1
Fishing area biomass and yield
estimates
|
Estimates obtained for pre-exploitation spawning biomass (Binitial), spawning biomass at the start of 2002 (B2002), their ratio and MSY under two hypotheses: (a) that declines in indices of abundance reflected only catch-induced reductions in true abundance, and (b) that differing proportions of overall abundance are present at aggregations each year. units are in tonnes. |
||||||||
|
Aggregation |
Catch-induced only |
Intermittent aggregation |
||||||
| |
Binitial |
B2002 |
B2002/Binitial |
MSY |
Binitial |
B2002 |
B2002/Binitial |
MSY |
|
Johnies |
19 300 |
3 900 |
0.20 |
470 |
46 800 |
31 200 |
0.67 |
1 040 |
|
Frankies |
19 700 |
6 400 |
0.32 |
470 |
38 300 |
24 800 |
0.65 |
880 |
|
Rix |
25 100 |
15 900 |
0.64 |
580 |
29 500 |
20 400 |
0.69 |
670 |
|
Hotspot |
4 300 |
400 |
0.10 |
100 |
8 000 |
4 000 |
0.50 |
160 |
|
Total |
68 400 |
26 600 |
0.39 |
1 620 |
122 600 |
80 400 |
0.66 |
2 750 |
|
FIGURE 5
|
3. PATAGONIAN TOOTHFISH OFF THE PRINCE EDWARD ISLANDS
3.1 Devastation by IUU fishing
The sub-Antarctic Prince Edward Islands are located to the southeast of South Africa (Figure 7). Figure 8 shows the estimated catch history for the toothfish fishery in the region (Brandão et al. 2002). Even given the inevitable uncertainties associated with estimating the size of illegal catches, it is starkly obvious that these operations have had a major impact on the resource, effectively before legal South African operations commenced.
The CPUE trend from legal operations shows a marked decline, and an assessment based upon these data indicates the resource to be reduced to less than 10 percent of its pre-exploitation spawning biomass. At best the resource would be able to sustain an annual catch in the vicinity of a few hundred tonnes for only the immediate future (Figure 9).
Why allow any legal fishing to continue on a resource that seems so depleted? The answer lies in the need to deter further illegal fishing. Frequent visits by patrol vessels to an area so far from South Africa would be too expensive. Thus the only practical deterrent is the presence of legal operators in the area. The scientific and management challenge, therefore, is to set a TAC that is small enough not to further deplete the resource, but large enough to offer South African companies sufficient economic incentive to send their vessels to the area.
|
FIGURE 6 Johnies
Frankies
Rix
|
3.2 Is the resource really so depleted?
There are a number of reasons why the current stock status indicated by Figure 9 may be overly pessimistic. For example, sperm and killer whales have learnt to remove fish from the longlines as they are hauled, which renders more recent CPUE values lower than appropriate for direct comparison with earlier levels.
|
FIGURE 7
|
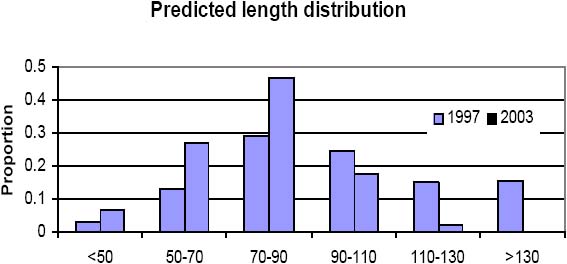
The most important caveat arises from the information available on the length structure of the legal catch. The top panel of Figure10 shows the catch-at-length distributions predicted by the population model underlying the calculations for Figure 9. As a result of the heavy early fishing, the reduction in numbers of older (larger) fish should have produced a shift towards smaller fish in the catch from 1997 to 2003. Yet when the actual observations are compared (Figure10, lower panel), there is little indication of such a shift.
If these catch-at-length data are taken into account when assessing the resource, an appreciably more optimistic appraisal of current status emerges. For the most straightforward forms of assessment, the CPUE and catch-at-length data are fundamentally incompatible. A better understanding of how fish size varies with location (notably depth), and of how fishing areal distribution patterns may have changed over time, is needed before it may become clearer whether it is the CPUE or catch-at-length data that are providing a more reliable picture of current resource status. Further analyses are also required to investigate whether the trends in catch-at-length data could perhaps be explained by a period of poor recruitment shortly before the fishery commenced, or by density dependent somatic growth.
4. GENERAL LESSONS
|
FIGURE 8
|
Deepwater species are typically long lived so that annual productivity may be no more than a few percent of their biomass. This means that recovery from appreciable resource depletion will be slow (see for example Figure 9).Even though annual sustainable yield levels are therefore only small percentages of resource abundances, it is important that these levels not be exceeded by too large an amount in the early stages of a fishery to avoid unintended excessive depletion. This suggests the need to be conservative in setting TAC levels during these early stages, as initial estimates of abundance will inevitably be subject to large errors. With the wisdom of hindsight, the opening TACs in the Namibian orange roughy fishery were likely set too high.
|
FIGURE 9 The solid line shows the trend in exploitable biomass obtained by fitting an age-structured production model to these data. Future projections under annual catches of zero, 400 and 800 t are also shown.
|
On the other hand, for a variety of reasons, catch rate declines in these fisheries may well overestimate the extent to which fishing has reduced abundance. There is now clear evidence that this has been the case for the Namibian orange roughy resource and some suggestive indications that the same may apply for the toothfish fishery off the Prince Edward Islands. Further hindsight-assisted wisdom suggests that the TAC reductions in the Namibian orange roughy fishery as abundance indices dropped, although unquestionably necessary, were perhaps overly severe.
|
FIGURE 10 The upper panel compares the length distribution of the toothfish catch predicted by the model of Figure 9 for 1997 and 2003. The lower panel shows the corresponding distributions actually observed. The length units are in cm. Predicted length distribution
Observed length distribution
|
The possibility of intermittent aggregating behaviour, as seems to be the case for Namibian orange roughy, also has other important implications for management. Normally, situations where an industry is unable to catch its TAC in a year are interpreted as providing evidence that the resource is in trouble and that the TAC needs to be reduced. To the contrary, given intermittent aggregation, failure to land the full TAC should be the expectation rather than necessarily a concern. Pressures that may force the industry to increase their available fishing effort to be able to land the TAC in years of low catch rates, and hence achieve only poor economic returns, need to be avoided. Instead, management flexibility is required so as not to preclude greater catches in years when a greater proportion of the fish aggregate.
5. ACKNOWLEDGEMENTS
We thank colleagues from the National Marine Information Research Centre, Namibia and Marine and Coastal Management, South Africa for provision of and advice concerning data used for these analyses. Financial support for this work from the responsible Government Departments of Namibia and South Africa, the South African National Antarctic Programme and the Namibian Deepwater Fishing Industry is also gratefully acknowledged.
6. LITERATURE CITED
Branch, T.A. 1998. Assessment and adaptive management of orange roughy off southern Africa. M.Sc. thesis, University of Cape Town: 204 pp.
Branch, T.A. 2001. A review of orange roughy Hoplostethus Atlanticus fisheries, estimation methods, biology and stock structure. In Payne, A.I.L., Pillar, S.C. & R.J.M. Crawford (Eds). A Decade of Namibian Fisheries Science. S. Afr. J. mar. Sci. 23:181-203.
Brandão, A. & D.S. Butterworth 2003. Stock assessment of Namibian orange roughy populations using an age-structured production model and all available indices of abundance from 1994 to 2002, and making allowance for annually variable aggregation of the stocks. Unpublished report. National Marine Information and Research Centre, Namibia. DWFWG/Wkshop/Mar03/doc3: 39pp. (mimeo)
Brandão, A., D.S. Butterworth, B.P. Watkins & D.G.M. Miller 2002. A first attempt at an assessment of the Patagonian toothfish (Dissostichus eliginoides) resource in the Prince Edwards Islands EEZ. CCAMLR Sci. 9:11-32.
Boyer, D.C., C.H. Kirchner, M.K. McAllister, A. Staby & B.I. Staalesen 2001. The orange roughy fishery of Namibia: lessons to be learned about managing a developing fishery. In Payne, A.I.L., Pillar, S.C. & R.J.M. Crawford (Eds). A Decade of Namibian Fisheries Science. S. Afr. J. mar. Sci. 23:205-221.
Glazer, J.P. & D.S. Butterworth 2002. GLM-based Standardization of the Catch per Unit Effort Series for South African West Coast Hake, Focusing on Adjustements for Targeting Other Species. S. Afr. mar. Sci. 24:323-339.
![]()
![]()
![]()