![]()
![]()
![]()
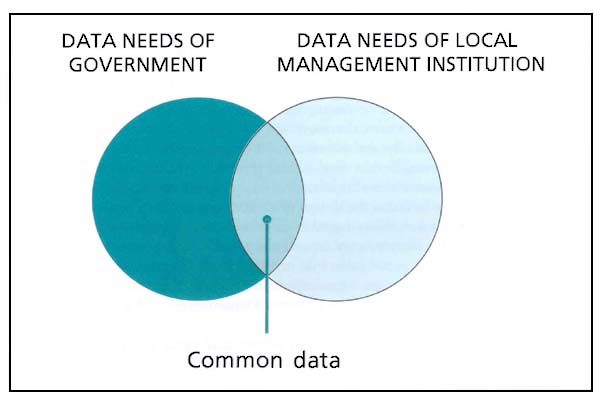
Co-managers will have overlapping data needs to support their roles (Figure 12). For example, many of the data types required for policy and development planning and evaluation may be similar to those required by local managers to evaluate the performance of their local management plans. The greater the overlap the more opportunities will exist to share data and information and the responsibility for collecting it.
Key stages in designing an effective and efficient data collection and sharing system are therefore identifying and maximizing this overlap, and reaching agreement on who should collect and share data to generate this information based upon their capacity and motivation. Responsibility for collecting the remaining data will also have to be reached. In some cases, the Government and LMI may be happy to collect these data independently of one another (often informally in the case of the LMI) but then later share them with one another. In other cases they may agree to collect data on behalf of one another provided they are sufficiently motivated to do so.
This chapter describes a participatory process for undertaking these key and other important stages when designing a data collection and sharing system for co-managed fisheries. The key elements of this chapter also form the basis of the accompanying Part1 of this paper: Practical guide.
FIGURE 12
Common data needs of co-managers
This design process should be integral to the formulation or revision of the management plan. It is at this stage when the overlapping data needs of important stakeholders' will become evident having established or clarified their roles and responsibilities, objectives, planned activities or strategies, rules and regulations, and performance evaluation criteria.
Participatory (and supporting conventional) monitoring programmes can subsequently be designed to meet these needs following an examination of the incentives and capacity of each stakeholder to collect and share the data, alongside information relating to the operational characteristics of the fishery. Integrating the design of the system with the management plan formulation, formalisation or revision process also provides opportunities to revise or re-negotiated iteratively elements of the management plan and/or the data collection and sharing strategy as the potential scope of any monitoring and evaluation activities becomes evident. Relevant activities required for formulating or reviewing management plans are therefore included in the eight-stage design process we propose in below.
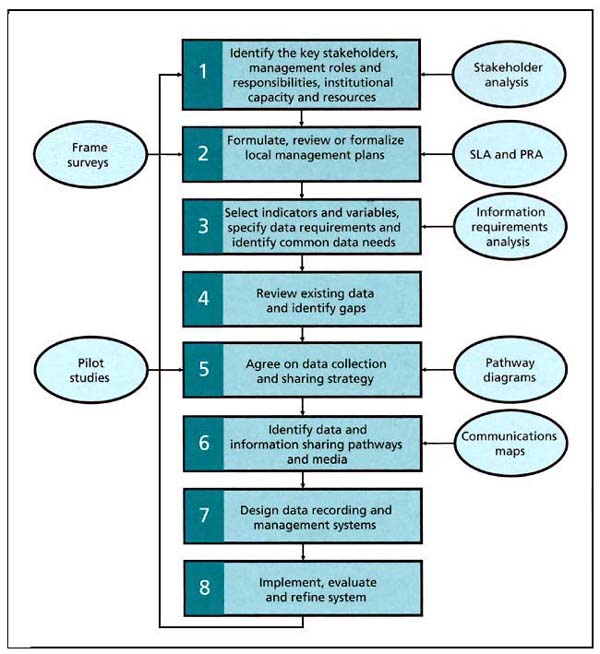
The eight-stage process we propose below is based around a general strategy of identifying stakeholders and their information requirements, identifying overlap in these requirements, and then designing a strategy for data collection and sharing based upon stakeholder incentives and capacity (Figure 13).
The first step is to identify the main stakeholders involved in management of the resource, and their responsibilities and capacities (Stage 1) which will help define their potential roles in the system. Management planning (Stage 2) is key to designing successful data collection and sharing systems because the management objectives and strategies will be defined in the plan. Based on the objectives in the plan, the data that will need to be collected can be identified (Stage 3). Existing data that are already collected by different institutions are then reviewed (Stage 4) and gaps are identified, so that for the remaining data that are required by the stakeholders, a strategy can be identified to collect those data (Stage 5). Pathways and methods to share those data between stakeholders are agreed in Stage 6, and ways of recording, storing and managing the data are identified in Stage 7. Finally in Stage 8, the system is implemented, evaluated and refined. A scaled-down pilot system could be implemented at first, involving a reduced number of data variables and stakeholders, so that all involved can get a feel for the system and which ideas will work well or not in practice.
The process is likely to require the participation of the main stakeholders in a series of focus group discussions and planning workshops, possibly at different spatial or administrative levels, for example, district, regional, national, depending upon the administrative structures of the co-management institutions. The location and timing of meetings, the facilities where the meetings are held, and facilitation should be arranged to make sure that all stakeholders are able to participate in the process in ways that are important to them. Berkes et al. (2001) provide useful guidance in respect to planning field working activities of this nature.
Facilitators can help facilitate the design process. They can help organize meetings or workshops, bring stakeholders together and help lead the discussions and drive the process forward. Facilitators may be external - either independent facilitators or from an outside organization not otherwise involved in the data collection and sharing system, or they may be from an organization involved in the process, for example, from the lead organization, such as the Fisheries Department, local government office or an NGO or project.
Each of stage in the process is described below, with tools and ideas for how to facilitate each part.
FIGURE 13
A proposed eight-stage process for designing data collection and sharing systems for
co-managed fisheries. The light green ovals in the diagram represent possible tools
that can help carry out the stages.
The main purposes of this exercise are to:
Stakeholder analysis provides a systematic means of identifying these key stakeholders and is the starting point of most participatory work and/or social assessments. As well as providing an understanding of power relationships, influence and interests of stakeholders, it can provide essential information about who will be affected (positively and negatively) by selected management strategies or interventions (see below), which individuals, groups, or agencies need to be involved in the management, and how; and whose capacity needs to be built to enable them to participate. Stakeholder analysis might also be used to identify current systems of information flow, where constraints lie and where new linkages can be made (see later).
Even if the co-management arrangements are already well established and management plans already formulated, this exercise may still be useful to clarify these issues or update knowledge and understanding in preparation for designing the data collection and sharing system.
Practical guidance for conducting a stakeholder analysis is provided in Part I of these Guidelines. Further guidance can be found at http://www.iied.org/forestry/tools/four.html or Annex D of IFAD (2002) http://www.ifad.org/evaluation/guide/index.htm. Using these techniques it should be possible to identify the main stakeholders belonging to the three main categories described in 2.3.1 as well as specific information on these groups, their interests and relationships. Depending upon the local context, stakeholders belonging to other categories or administrative levels of government may also be identified and described.
Properly formulated and clearly recorded management plans will greatly aid the identification appropriate indicators and data variables for inclusion in monitoring programmes as well as appropriate sources and methods.
The information contained within the plan will also be required to help coordinate management plans and activities and thereby minimize conflict among local managers (Section 3.3.10) and may also provide a rich source of variables for explaining the performance of both local management activities (Section 3.5.2) and co-management policy (Section 3.5.8).
In spite of the importance of the management plan not only in terms of designing monitoring programmes but also for coordinating and evaluating management activities, few examples of local management plans were identified during the preparation of this document. It is therefore highly likely that it will be necessary to formulate or at least formalize the management plan.
Broadly speaking, the formulation of the plan (excluding the design and development of monitoring and data sharing activities or programmes) is likely to involve the following steps:
Guidance on how to undertake each step is given by Hoggarth et al. (1999; in press). Intermediaries may be able to help facilitate the formulation of the plan between the relevant administrative levels of government and the LMI. Visualization techniques including “cognitive mapping” may facilitate these processes (Berkes et al., 2001; Guijt et al., 1998). In Cambodia, the MRRF project uses SWOT (Strength, Weaknesses, Opportunities and Threats) analysis to review and adapt the management plan for the following year (MRC, 2004).
Much of the baseline data and information can be readily compiled using Rapid Rural Appraisal (RRA) (Pido et al. 1996) and PRA approaches (see http://www.iied.org/sarl/pla_notes/ or Annex D of IFAD (2002), http://www.ifad.org/evaluation/guide/index.htm and Maine et al. (1996)) involving the LMI and resource users, as they will often know what actions or management control measures would sustain local catches (e.g. establishing fish sanctuaries in particularly locations). Intermediaries such as NGOs, research institutions or donor projects may be an important source for the socio-economic and institutional baseline data and information. In addition, formal stock assessments or the application of analytical frameworks (Section 3.5) may be employed where feasible and appropriate to investigate the biological, social and economic implications of different harvesting strategies and control measures (and their combinations) designed to control fishing mortality, and interventions such as stocking or habitat rehabilitation programmes.
| BOX 14 The challenge of identifying stakeholder roles and responsibilities |
| “Decentralisation of management responsibility for fisheries management to the municipalities has resulted in a situation where there are more than 800 autonomous entities in charge of managing the fishery” (Felsing, 2004b) |
| “In Vietnam the Ministry of Fisheries has a very complex institutional structure and the sharing of management responsibilities with local management bodies is vague” (MRC2004). |
| “The difficulties in classifying the roles and responsibilities of various stakeholders in a collaborative management system (as a basis for identifying information needs) should not be underestimated” “Many of the roles and responsibilities in the systems are still evolving” (Purvis, 2004). |
| BOX 15 The application of logical frameworks |
| Significant scope exists for employing logical frameworks (logframes) to formulate management plans. The logframe is a powerful participatory tool that can be used to help define the roles of different stakeholders, and provide an explicit and objectively verifiable schedule of the actions that will need to be undertaken. It can also be used as the focus for discussions about amendments and alterations to an activity in the light of experience, while the activity is under way. Guidelines for developing logframes are available at http://62.189.42.51/DFIDstage/FOI/tools/chapter_05.htm. Berkes et al. (2001) describes the application of logframes for developing management plans for small-scale fisheries in Barbados (see http://web.idrc.ca/en/ev-28061-201-1-DO_TOPIC.html). The Mekong River and Reservoir Fisheries (MRRF) programme has used a logframe type approach in the context of planning management activities in reservoirs in Cambodia and Laos, and for planning and implementing participatory impact monitoring surveys in Thailand (see MRC, 2004 for further details). |
5.2.2.1 A sustainable livelihoods approach to management planning
Poverty alleviation or reduction is often the central theme of national policy and development plans, as well as local management plans. The Sustainable Livelihood Approach (SLA) offers an effective means of identifying interventions or strategies in support of these policies and plans. The Department for International Development (DFID) formally adopted the approach in 1997 and defines the concept of sustainable livelihoods as:
“…the capabilities, assets (including both material and social resources), and activities required for a means of living. A livelihood is sustainable when it can cope and recover from stresses and shocks and maintain or enhance its capabilities and assets both now and in the future, while not undermining the natural resource base”.
Several international development agencies are now applying a “livelihoods approach”, each applying a somewhat different version and for a range of different purposes (see Krantz [2001] for further details). Most approaches reject the usual sectoral entry point (fisheries, agriculture, water, etc.) and instead begin with an analysis of people's current livelihood systems to identify appropriate interventions. They also place their emphasis on involving people in the identification and implementation of activities (ibid).
| BOX 16 The sustainable livelihoods approach to local management planning |
| The formulation of these management plans, programmes and activities are likely to be ”…enriched if they build upon information gathered in a livelihoods analysis…by improving understanding of the “…interactions between different sectors and the importance of developing inter-sectoral links to maximise impact” (DFID, 1999). |
| Policy and practice would be improved “…by recognising the seasonal and cyclical complexity of [fisheries-dependent] livelihood strategies, helping to remove access constraints to assets and activities, and identifying ways of making livelihoods, as a whole, more able to cope with adverse trends and shocks” (Allison and Ellis, 2001 p.378). |
The micro or meso scale of most co-management initiatives lends itself well to the application of the SLA. Not only can more effective management plans be formulated using this approach taking account of the importance and impact of different sectors, but such initiatives also provide ‘entry points' for other, (inter-) sectoral management and development interventions including poverty reduction strategies (PRS) (See Section 3.2.3.2).
As well as providing a means of identifying context appropriate strategies and interventions including both technical and institutional type, the application of the SLA may also help facilitate the design the data collection strategy by:
A central element of DFID's SL approach is the SL framework (Figure 14). The framework is not an exact model of reality, but an analytical structure or tool to improve understanding of livelihoods. It aims to provide a broad and systematic understanding of the various factors that constrain or enhance livelihood opportunities. It can be used in both planning new development or management activities and interventions, as well as assessing the contribution to livelihood sustainability made by existing activities. It is built around five principal categories of livelihood assets depicted as a pentagon. An important stage of the analysis is to identify people's access to different types of assets (physical, human, financial, natural and social) and their ability to put these to productive use. It also facilitates an understanding of how organizations, policies, institutions and cultural norms shape livelihoods by determining who gains access to different assets and defining the range of livelihood strategies available and adopted (ibid). It does not take a sectoral view but rather seeks to understand the contribution made by all sectors to the assets upon which people can draw from. In essence, it aims to encourage users to take a broad and systematic view of the factors that cause poverty, whether these be shocks or adverse trends, poorly functioning institutions and policies, or a basic lack of assets, and to investigate the relations between them.
FIGURE 14
The sustainable livelihoods framework
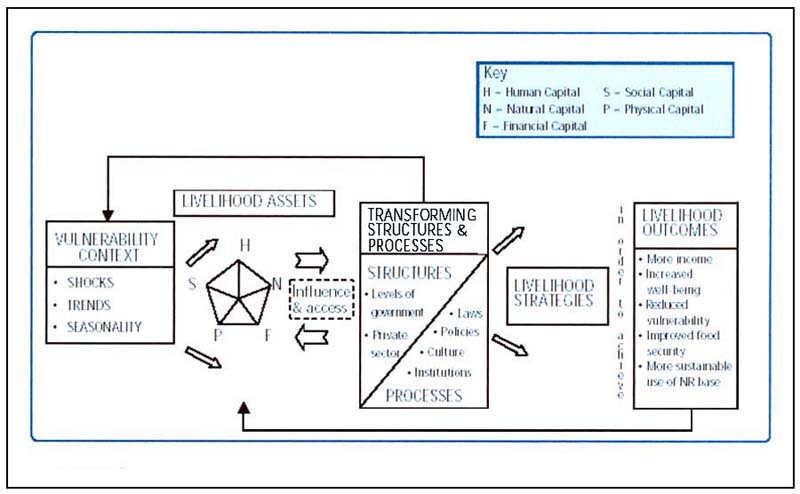
Source: http://www.livelihoods.org/info/info_guidancesheets.htm
In doing so, appropriate interventions can be identified on the basis of threats or constraints to livelihoods such as providing people with better access to assets or supporting more effective functioning of structures and processes (e.g. management institutions, policies etc) that influence access to assets and available livelihood strategies. A full description of the SL concept, framework and application is available at http://www.livelihoods.org/info/info_guidancesheets.html. Hoon et al. (1997) examines appropriate indicators for SL analyses.
Poverty and Development Planning Applications
Norton and Foster (2001) conclude that the asset/vulnerability component of the framework has considerable potential to improve the PRSP, particularly in terms of the diagnosis, the design of the strategy, and the monitoring framework (see Box 17). DFID (2001) advocates that these benefits also extend to other country level development strategies including CDF and NSSD (See Section 3.2.3). Section 6 of DFID's Guidance Sheets available at http://www.livelihoods.org/info/info_guidancesheets.html describes a host of other opportunities where the application of SL approach, particularly its core principles can complement and support country-level policy and development planning.
| BOX 17 What can an SL approach add to the PRS and other country-level development strategies? |
| Analytical or Diagnostic Work: Integrate household survey, environmental, social and political analysis to identify livelihood groups; identify trends, threats to existing livelihoods (supplementing expenditure/income analysis with information on trends in assets held by the poor, the returns obtained from them, the costs required to sustain them). Identify issues poor groups themselves prioritise. |
| Formulation of the Strategy: Integrate asset/vulnerability information with economic analysis, to identify which interventions have biggest sustainable impact on most poor people at affordable cost; and which interventions have most positive impact on identified poorest and most vulnerable groups. An SL approach could help to bring household expenditure/income data into a common frame with information on assets, including what is required to maintain and enhance them, and what returns might be. Participatory and historical analysis might be used to identify how different groups may react to new conditions, threats, opportunities. In moving the SL framework from local to national concerns, some sacrifice of the detailed, holistic approach will be required, but the analysis can inform decisions on where the main variations lie, and what features are important. |
| Approval: By identifying the importance of heterogeneity, an SL approach might help promote a more decentralised and locally responsive approach, in which the centre is approving a process by which resources are allocated but with greater discretion for adaptation through local level planning and budgeting processes. |
| Implementation: The SL approach can inform the development of frameworks for setting objectives and designing monitoring systems that capture early-warning indicators of poverty, including asset sales. |
| Impact Assessment: Recognition of need to assess longer-term trends in assets, especially environmental assets. |
| Norton and Foster (2001). |
5.2.2.2 Participatory Action Plan Development (PAPD) approach
Participatory Action Plan Development (PAPD) is an approach to management planning that was developed by the Center for Natural Resource Studies (CNRS), and a team from Newcastle and Durham Universities (Barr and Dixon, 2001). The method has been developed in Bangladesh but has been adapted and tested in Viet Nam (see Sultana and Thompson, 2003; 2004). The planning approach involves holding a series of linked local workshops where different stakeholders and users of a floodplain participate separately and in plenary to develop a management plan for the common resources they use.
The key features of PAPD
Each category of stakeholders works separately to identify and rank their problems regarding natural resource management (NRM). Later, all stakeholder groups come together to jointly agree on the priority problems. The stakeholder groups separately analyze possible solutions and their impacts, before meeting in plenary to share their analysis and form a consensus on win-win solutions and actions. The participants prepare in more detail an action plan for natural resource management. PAPD is designed to encourage participants to express their views, while avoiding a process that is dominated by locally-powerful and vocal people, and to develop a shared framework of understanding about resource management. It is based on certain principles such as the desirability of consensus, the need for all stakeholders to be involved in the process, neutrality and the sharing of information. However, it does not focus on negotiation or resolving existing direct conflicts between two parties over resources. PAPD focuses on problems, needs and potential solutions that are shared, and the differences and similarities in views of stakeholder groups over them. Many methods like Participatory Rural Appraisal (PRA) aim to raise individual awareness of resource management problems; PAPD as a process raises collective awareness of the problems and leads towards collective action that can tackle them effectively. PAPD is designed to enable the voices of the disadvantaged and less powerful to also be heard.
Methodology for PAPD
As originally conceived, PAPD was seen as a two-stage process comprising a problem census (listing of problems and ranking of their importance by different stakeholder groups) followed by stakeholder and plenary planning workshops. However, through the process of applying and testing the PAPD process, it has evolved into three phases that lead into continual or long-term participatory resource management (Sultana and Thompson, 2004). Each phase has a number of different stages and activities (Figure15).
- Scoping phase
- Participatory planning phase
- Implementation phase
At the heart of the process are stages four to eight that involve participatory workshops with separate stakeholder groups and combined plenary sessions. These stages have been the main focus of the action-research, as it is here that the substantive consensus is built. However, this should be seen as one important phase in a larger process. In the more general sense, action research addressing problems of the community has its focus on steps 9 through 13 where both institutional arrangements and fishery management actions are tested and evolve through the efforts of the community with advice and facilitation from non-governmental organizations (NGOs), government agents and researchers.
Participation issues
There is an inverse relationship between people's willingness to express their views frankly, and the number and diversity of people participating. Individuals tend to discuss issues more freely on an individual basis than in public. Some reasons why people may not contribute ideas to a public discussion are: they do not consider their ideas valuable; they do not want to upset the status quo; they want to avoid offending others; and it is not traditionally or culturally acceptable for them to speak in a public meeting (e.g. women and young people) when it is for others (e.g. male elders).
Building relations with a few key individuals can help obtain information of the real workings of society. This can be validated by triangulation with what other individuals say. However, it is a slow process and involves no explicit public consultation or planning objective.
An alternative is for people to express their ideas in a less judgmental forum where they feel comfortable, like with friends or with people of similar background. The drawback, however, is that these views are not aired in public and do not contribute to shared understanding and mutual learning, and so there is no change in the status quo.
The PAPD method takes into account these issues through a series of linked separation and aggregation steps that together can result in a balanced view. The separation steps are exercises undertaken by each stakeholder group. The aggregation steps are facilitated plenary sessions where all groups are represented.
These principles and the PAPD method can be adapted for participatory reviews and improvements in management as well as for initial planning. The process shown in the figure is consistent with the CBOs that result from PAPD designing management systems as part of the PAPD in sessions where government co-managers are actively involved with the primary stakeholders, these systems can include data sharing and reviewing.
FIGURE 15
Thirteen stages and three phases of the PAPD process
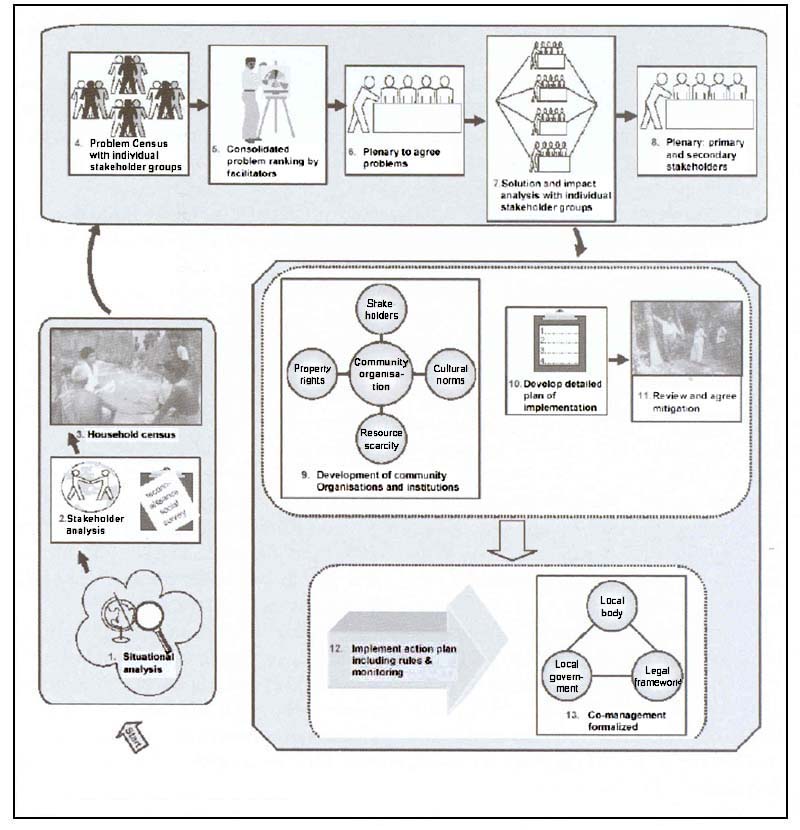
Source: Sultana and Thompson (2004).
5.2.2.1 Frame surveys
Frame surveys are used to generate important information required both for management planning purposes and for helping design data collection strategies or systems.
In particular, they are used to define the water bodies and areas that will be included in the plan or monitoring programmes and to describe the operating characteristics of a fishery or (co-)management unit including information relating to the environment, fishers, boats, gear, markets, fisher communities, and institutional arrangements etc (see Section 5.2.2). Because the types of data and information collected using frame survey approaches may be similar to those generated for SL analyses, opportunities may exist to integrate survey and appraisal activities where appropriate.
In the context of designing data collection strategies, the frame survey will provide important information relating to the infrastructure and characteristics of the fishery that can be used to guide the selection of data sources and tools, sampling strata, and information for raising sample estimates. At a minimum the frame survey should aim to include:
Additional information might include:
Examples of typical data types collected for frame surveys are given in Section 6 of DFID Project Report ref. R7042 which can be downloaded at http://www.fmsp.org.uk/r7042.htm.
Frame surveys often draw upon information from numerous sources including directly from the LMI or resource users using Rapid Rural Appraisal (RRA) (Pido et al. 1996) and PRA techniques (Maine et al. (1996) and Annex D IFAD 2002, http://www.ifad.org/evaluation/guide/index.htm), and by direct observations, dedicated surveys or censuses, and other government departments or ministries.
Information is often usefully summarized in the form of thematic maps (Figure 16) or cognitive maps (see Berkes et al. 2001). Further guidance on frame surveys can be found in FAO (1997) Caddy and Bazigos (1985), Bazigos (1983) and Mahon and Rosenberg (1988). Meaden and Do Chi (1996) (see http://www.fao.org/DOCREP/003/W0615E/W0615E00.HTM) describe the application of GIS systems for creating thematic maps. De Graaf et al. (2003) illustrate the application of GIS for creating thematic maps for the fisheries of Lake Volta.
5.2.2.2 Recording the management plan
A checklist of the categories of information that might be included in each local management plan is provided in Section 3.3. Agreeing a common format will facilitate the coordination of individual management plans and activities (Section 3.3.10) and ensure that explanatory variables common among all LMIs or co-management units are available for comparative analysis purposes (Section 3.5.2). The plan will usually be presented in a report format, and should be made available to all stakeholders. Graphical or pictorial summaries of the plan, possibly based upon thematic frame survey maps (see above), may help to ensure understanding among stakeholders. Alternatively, it may be necessary to produce two versions of plan: a technical version that includes all the information in detail, and a less technical version that includes information in a form that all stakeholders can understand (see Berkes et al., 2001 and Box 18).
At this stage, each stakeholder group will identify their own information needs which will later be compiled to identify common data needs in Stage 5.
Once the stakeholders have a formulated or revised management plan that describes the environment, resources and fisheries defines local management objectives, strategies and actions to take, and outlines roles and responsibilities for its implementation (i.e. Category 2 information), it should now be possible for each key stakeholder group to identify a provisional list of data needs or interests in relation to the remaining information Categories 1, 3 and 4.
FIGURE 16
Example of a thematic map illustrating the location of important landing sites and
numbers of fishing vessels by category in Antigua, Caribbean
Source: Mahon and Rosenberg (1988).
| BOX 18 Management plans depicted by maps? |
| The experiences of the Aga Khan Rural Support Programme (see Guijt et al., 1999) suggest that maps could be an effective means of preparing and recording local fisheries management plans, as well as evaluating their performance. The maps, prepared by local people, depict the available resources, how they are used, ownership, problems and constraint are used as the basis for local planning and decision-making. The maps are displayed in convenient locations that are accessible for all members of the community and used to monitor project activities and resolve problems. |
Stakeholders do not need to think of all the information needs at this stage. As plans change and as stakeholders develop their ideas and their understanding of the plan, the data and information needs will change also and can be updated. This means that the data collection system and management plan should evolve and improve together through time as they are revised or reviewed.
5.2.3.1 Identify data for Category 1 and 4 information
Guided by explicitly defined objectives, both government and each LMI should be able select a list of performance indicators and corresponding data types and variables for monitoring and evaluating policy and development plans (Category 1), and local management plan performance (Category 4). Sections 3.2 and 3.5 provide typical examples of what might be selected for monitoring.
Identifying indicators for each information category can be done by fishers, LMI members, local government officers and national fisheries officers (for example) working in separate groups to identify their information needs, or they can work in mixed groups and identify the information needs for all groups. This may be done through a workshop and may need to cover basic concepts.
To maximize acceptable data variable overlap, the stakeholder groups should be encouraged to identify several alternative indicators. Stakeholders should then indicate how important each indicator is to them by ranking or scoring the indicators according to their overall importance. Scoring can be done using a scale of 1 to 5.
A provisional list of explanatory variables corresponding to each performance indicator should also be identified at this point for inclusion in either routine monitoring programmes or to be fully documented and described in the management plan. This list should include variables to explain both the performance of local management plans and policy and development activities. Intermediaries may be well placed to help the main stakeholders identify these variables. Discussions and presentations based around ‘Bio-resource’ flow-diagrams and other conceptual models of the fishery, and the construction of a hypothesis matrix may help facilitate this process (Section 3.5.2).
5.2.3.2 Develop alternative indicators if required
It is unlikely that the indicators described in Chapter 3 will meet the needs of all stakeholders in every context. In these cases, stakeholders will need to select or develop alternative indicators that meet their requirements. Differences in the perception of appropriate indicators even at the community level (according to gender, age, occupation, wealth status etc) may also exist and therefore negotiation even at this level may be required. Alternatively several different indicators may need to be monitored to reconcile differences in perceptions or understanding of individuals.
The UNDP identify a number of desirable characteristics that any indicator should:
| BOX 19 The critical design stage |
| Identifying what to monitor is the most critical stage in the process of designing and implementing PM&E programmes or activities and often requires a lengthy process of negotiation and collaborative decision-making among various stakeholders, particularly if the data and information generated by the programmes are to be shared between stakeholders at different management levels. |
Further details can be found at http://www.undp.org under “Sustainable Livelihoods: Concepts, Principles and Approaches to Indicator Development”. Abbot and Guijt (1998, p. 41) suggest similar criteria.
The selection of relevant indicators for monitoring performance in relation to objectives can be guided by performance questions (IFAD, 2002, Section 5, downloadable at http://www.ifad.org/evaluation/guide/index.htm). Performance questions help focus the selection of appropriate indicators by addressing what is necessary to know if the management plan or policy is performing as planned. Once you have your performance questions, you can more easily decide what information you need to monitor. The following question can help find a good performance question: “What questions would you need to answer to know the extent to which you are achieving the objective?” After the performance questions are agreed, it is then much easier to decide what information you need to answer them.
Be sure to avoid duplication. Organizations such as national statistical bureaux, census bureaux, statistical offices or ministries of agriculture etc) may already be monitoring relevant indicators or data variables (see Section 5.2.4). Rai (1998) describes how indicators can be developed in a participatory manner on the basis of pictures depicting goals or management activities.
5.2.3.3 Identify the data needed
The next step is for the stakeholders to identify, for each quantitative (numerical) indicator, what data they would actually need to collect to be able to calculate the indicator. To do this, firstly identify the types of data required for each indicator. For example, to calculate indicators of fish abundance such as catch per unit effort (CPUE), the data types required will be catch and effort.
Next, groups should identify several possible data variables that could be collected for each data type. For example, catch data can be collected in several ways: as the weight of the catch, the number of fish caught, or the number of baskets or boxes of fish. Part I illustrates this process using a series of tables.
To maximize the opportunity for sharing data and the responsibility for collecting it, each group should attempt to identify several alternative acceptable data variables for each quantitative indicator. For qualitative (non-numerical) indicators and explanatory variables, stakeholders should discuss and negotiate as many common indicators and explanatory variables as possible. Grass roots indicators derived by individuals, households or communities (Abbot and Guijt, 1998) may not always be compatible with the needs of other stakeholders. Thus indicators will need to be selected or developed that integrate these different perspectives. This will involve discussing their significance and relevance with each stakeholder group. While a common set of indicators is desirable, bear in mind that different quantitative indicators selected by stakeholders may rely on the same data variables for their calculation. In these cases the emphasis should be on negotiating indicators that share common data variables.
Also bear in mind that the process of negotiating indicators requires developing a common understanding of success that is likely to differ among stakeholders. Negotiations of this type are beneficial since they can reinforce a shared vision for management and development. Interestingly, Abbot and Guijt (1998) report that stakeholders are often keen to work toward standard national procedures for monitoring and data handling. Note that even if local managers are not involved in data collection activities, selected indicators must be relevant and palatable.
5.2.3.4 Agree data specification
Having identified acceptable indicators and data variables for their calculation, the specification of each indicator or explanatory variable should be agreed among each stakeholder group and stated explicitly. This information is required to help design the data collection strategy (see Stage 5) including the selection of appropriate data sources, data collection tools, sampling units and sampling strata; and the identification of the required sampling intensity (sample size and sampling frequency) and coverage (sample or complete enumeration).
These specifications should aim to include details of the required frequency, accuracy and precision of the indicator or explanatory variable as well as details of any required standards (Sections 3.1.2. and 4.5). Some basic concepts related to accuracy and precision are presented in Box 20.
The required minimum level of accuracy (1- β) is typically 80–90 percent, but precision requirements will depend largely upon the how the indicators and variables are analysed and used. For example, catch data might need to be monitored with high precision (e.g. δ=10 percent) and accuracy to adequately evaluate the performance of different management strategies or stocking programmes (see Section 3.5.1.1). For policy and development planning purposes however, less precise (e.g. δ=20 percent) and less frequent estimates may be acceptable thereby providing opportunities to collect the data using less costly indirect methods and sources such as infrequent national censuses (see Section 4.6.1). Further guidance on data specification is available in Sections 3.1.2 and 4.5.
Stakeholders should be encouraged to clearly justify the reason for the data specification. This exercise can be very enlightening and may encourage managers to review or re-consider their roles and responsibilities as the purpose of management data and information becomes clear.
FAO have produced a number of very useful manuals and handbooks on the subject of sampling design including Stamatopolous (2002; 2004) and Sparre (2000) that should be consulted at this stage of the design process. These include detailed guidelines on how to achieve required levels of accuracy and precision, and on the design of data collection strategies, methods and forms. The FAO's ARTFISH software (see Section 5.2.7.2) also contains routines to help managers plan and design sample-based surveys.
5.2.3.5 Identify data and information to implement the management plan
Data and information required to implement the plan, particularly with respect to the enforcement of local rules and regulations and resolving conflict i.e. Category3 information (Section 3.4) might also be identified at this point, particularly if government is expected to take full or partial responsibility for these roles and responsibilities. Remember, most information required for helping to resolve conflict will already be contained in the management plan.
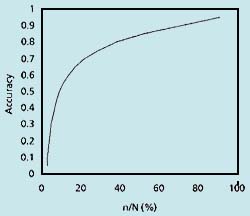
| BOX 20 Accuracy and precision concepts | |
| Accuracy (A) is a measure of how close the estimated value (m) is to the true value (μ) and can be expressed as: | |
 | |
| where R denotes the population range (ymax-ymin). | |
| Generally speaking, accuracy increases sharply with increasing sample size n expressed as a proportion of total population size N and then much slower beyond a certain critical sample size (equivalent to √N ) up to a maximum of 1 (or 100 percent). The figure below illustrates the form of this relationship based upon an arbitrarily selected population variance. | |
 | For a given population variance estimate σ2, the minimum sample size to achieve a maximum allowable difference d between the estimated mean and the true value is given by |
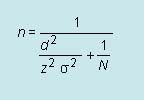 | |
| where Z is the upper α/2 point of the standard normal distribution (approx equal to 2). Stamaltopolous (2004) provide estimates of n when σ2 is not known or cannot be estimated. | |
| Precision | |
| Precision refers to the closeness of a sample estimate to the expected value and, like accuracy, is a function of population variance, σ2. Estimates can be precise but not accurate when samples are not representative (biased). Precision is often expressed in terms of confidence limits around the estimate. Precision increases (the confidence interval becomes narrower) with decreasing population variance and increasing sample size. Precision determines the minimum differences detectable between means sampled between sites or periods of time. This Minimum detectable difference (δ) is therefore an important concept when evaluating the performance of different management strategies. The minimum detectable difference between two samples is a function of both the pooled population variance estimated by the pooled sample variance (S2p) and the sample size, n (Zar, 1984) given by: | |
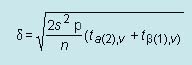 | |
| where tα(2),v is the critical value of the t-distribution for a two-tailed test corresponding to the probability (α) of committing a Type I error (typically 5% or 0.05) with v degrees of freedom (2(n-1)), and where tβ(1),v is the critical value of the t-distribution for a one-tailed test corresponding to the probability (β) of committing a Type II error (typically 10 percent or 0.10) with v degrees of freedom. | |
| Population variance will vary among different types of data variable. For example monthly CPUE estimated on the basis of catch per fisher will have a higher variance (be less precise) than catch per trap because individual fishers may own different numbers of traps and may not always fish the same numbers of days each month. A trade-off will therefore exist between the types of variables selected for monitoring and the required sample size. Larger samples sizes will be required for less precise data variables. Less precise variables may however be easier and less costly to collect. These trade-offs should be carefully weighed up when designing the data collection strategy (see below). Sampling the population prior to the design of the data collection strategy may provide useful estimates of the (pooled) population variance estimate σ2, i.e. the (pooled) sample variance, s2. | |
Check that another institution or organization is not already collecting the data. Other government agencies, universities, research organizations, NGOs and other stakeholders will often have or be routinely collecting indicators or data variables of interest. It might be useful to start by asking whether reporting mechanisms at the village, district or national levels already exist for relevant information such as population, boat ownership, poverty indicators etc that may be generated by a range of methods such as national statistical or census or specific research methods. It is often helpful to compile an inventory, possible in tabular format, of existing information collection detailing what information is collected, who collects it, how, and for what purpose, and where the information is held (see Table 7 in Part 1 and Table 6-3 in IFAD, 2002).
Also determine how the information was collected, and whether it is reliable for the needs of each stakeholder. Remember, it may be possible to modify data gathering by other agencies to better support the needs of stakeholders (see Section 4.6.1).
Co-managers should now be in a position to be able to begin designing the collection and sharing strategy to meet their data needs. This will involve identifying possible sources and methods for each data variable, identifying an appropriate sampling strategy and agreeing who will take responsibility for collecting the data and sharing it with whom.
5.2.5.1 Summaries needs and options
To facilitate this process, options to meet the requirements of each stakeholder identified above might to be considered in a tabular format similar to the type illustrated in below (Table 12). The table might initially include, for each stakeholder, details of:
5.2.5.2 Identify common data needs and agree responsibilities
Next, identify and highlight common data types or variables in the “Acceptable data variables” column of the table. In the example table below this has been done by highlighting common data variables with circles of the same colour.
For these common data needs, stakeholders should then discuss and agree who will collect that data, how and from where by selecting from the available options. Also agree with whom the data can be shared with. Consideration should be given to stakeholder capacity and their incentives to collect and share information (Section 5.2.5.5). In the table, open circles have been used to indicate who will collect the data, how and from where. The arrows connecting the coloured circles show how the data will be shared.
Having agreed a provisional data collection and sharing strategy, estimate the sample size and sampling frequency needed to meet the specified levels of accuracy and precision corresponding to each data variable. Another column should be added to the table to record this information. This may require pilot sampling programmes to find out the sample variance and if there is any sampling bias.
If stakeholders are unable to sample the population at the required intensity (sample size and frequency) to meet the common needs of the stakeholders then alternative sources and data collection methods may need to be selected. Sampling strata (Section 4.4.1) may be used to improve the precision of estimates, and may also be required for reporting or administrative purposes. Appropriate sampling strata to might be identified on the basis of the frame survey results. A further column may be added to the table to record any strata selected or required.
If proposing to use data that other institutions are already collecting, it will be necessary to negotiate the use of their data with them and agree how the stakeholders involved will access it. This will be particularly important if the data will be needed either more frequently or in a different format from that usually made available to the public.
Stakeholders will need to agree on the form in which the data or information will be shared. How will the collected data be compiled or analysed, and who will do what? This will depend on the level of detail required by each stakeholder and the capacity of each stakeholder to analyse and compile the data. Stakeholders should refer to the data specification for details of what is required by each group.
If necessary, in order to come to agreement on the data collection and sharing strategy, re-negotiate indicators, identify alternative data variables and adjust sample sizes until all stakeholder needs are met. Improvements to precision and accuracy may be achieved by selecting alternative data variables, and sources and methods. Where stakeholder needs in terms of accuracy and frequency do not coincide, each group will have to carry out their own data collection to satisfy their requirements.
A minimum ‘need-to-know’ approach may help make sure that the most important information is collected with enough accuracy and at the lowest possible cost. Once it is set up, the system can be expanded to include more detail on species, value, products and other factors (MRC, 2004).
If a mutually agreeable strategy cannot be identified, it may be necessary to create further incentives or re-negotiate the respective roles and responsibilities of each stakeholder. When considering alternative strategies, always bear in mind operational constraints such as the cost of salaries, training, capital costs (e.g. transport, computers, office equipment) establishing and maintaining information sharing networks (see Section 5.2.6) and any recurrent costs. Further advice on preparing budgets can be found in FAO (1999 p70); Sparre (2000, p159) and IFAD (2002 p7–36) that lists more that 40 potential cost items. Particularly for catch data, the selection of tools and sources may be guided by the use of fish disposition pathway diagrams that draw upon information gathered during the frame survey or PRA activities (see Section 4.6.2).
5.2.5.3 Uncommon (unique) data needs
Once stakeholders have agreed how to collect and share their common data needs, they should consider who might collect the remaining data needs. It may be that the government and LMI are happy to collect their own remaining data needs and can select appropriate sources and tools accordingly using the approaches described above. Alternatively, incentives may be offered to stakeholders, particularly the LMI or resource users, in exchange for the task of collecting data. Examples of incentives that governments are likely to be able to offer LMIs in return for collecting and sharing data and guidance on encouraging participation and data sharing are described below.
TABLE 12
Example of a tabular format to help identify common needs among key stakeholders and possible data collection and sharing strategies
Arrows indicate how variables might be shared to meet the requirements of other stakeholders. S-Sampling; CE-Complete enumeration.
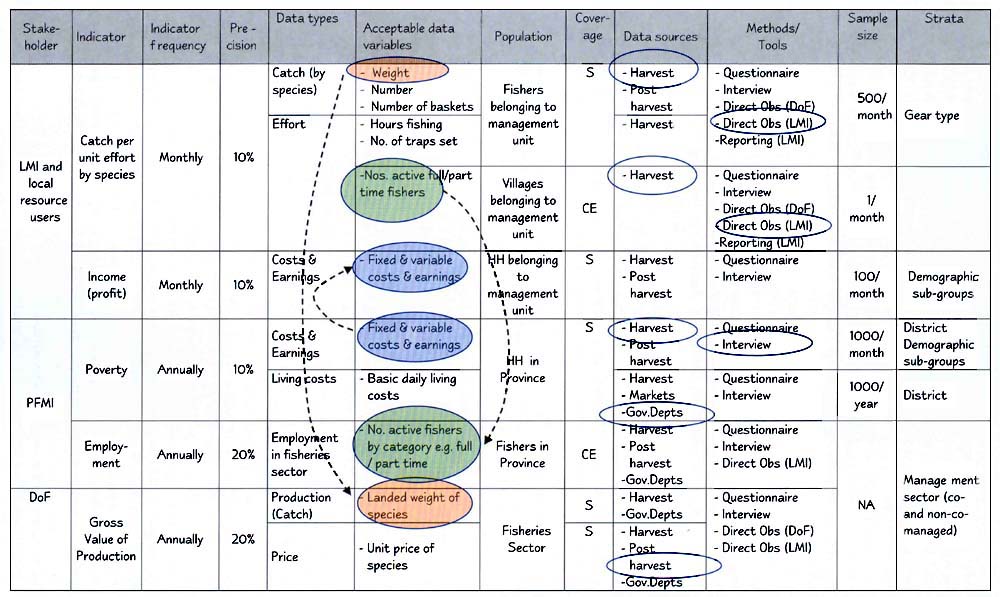
5.2.5.4 An example
In the simple example illustrated in Table 12 below, an LMI has identified an interest in monitoring both CPUE and profit and has identified, with the help of other stakeholders, corresponding levels of precision for each indicator expressed in terms of minimum detectable difference (MDD) (see Box 20). It has also identified data variables that would be acceptable or collectable given its capacity and requirements, possible data collection sources and methods and corresponding sample sizes to meet its data specifications. The Provisional Fisheries Management Institution (PFMI) and the DoF identify poverty, employment and GVP as important indicators for policy and development planning and evaluation purposes. They also specify their own required levels of precision for these indicators, shortlist possible data variables, identified possible data sources and methods and estimated required sample sizes.
During a process of consultation and negotiation, the LMI agree to monitor catch weights and numbers of active fishermen in each month by direct observation and agree to share these data with both the PFMI and the DoF who can use these data variables to help determine levels of employment and calculate GVP. Sample sizes that can be collected by LMI were found to be adequate the meet the needs of both stakeholders. If this was found not to be the case, then it may have been necessary to negotiate larger sample sizes with the LMI or encourage the LMI to collect more precise measures of effort such as total fishing hours. In return, the PFMI agrees to share income data with the LMI that they plan to collect by means of interview methods on a monthly basis from households including those belonging to members of the LMI. The DoF offer incentives of the type described in Section 5.2.5.5. The outstanding data needs to construct the poverty and GVP indicators required by the PFMI and the DoF (i.e. living costs and price data respectively) have been identified as being available from other government agencies (Section 5.2.4).
5.2.5.5 Stakeholder capacity and incentives to collect and share
Local managers have an incentive to collect data to evaluate the performance of their own management plans allowing them to see for themselves the benefits or impacts of their management activities. Having been involved in data collection activities, fishers and other local stakeholders are more likely to believe the results of any evaluation. Indeed, the research activities described in Preparation of this document in Part1revealed that local managers have an interest in monitoring their management plans in a more objective and systematic manner. Local managers should not, however, be expected to collect data, such as that required for policy and development planning purposes (Category 1 information), simply to relieve the workload of the fisheries department. Likewise, it would be unrealistic to expect the administrative levels of government to collect data on behalf of local managers solely for the purposes of local management plan evaluation.
In addition to providing any necessary training and capacity building programmes, a number of further incentives exist that could be offered or made explicit to the LMI by the administrative levels of government, in exchange for agreeing to participate in local monitoring programmes, maximizing data overlap and sharing data and information. These incentives may be financial but providing local managers with support to formulate, implement and evaluate their other local management plans may be more attractive, sustainable, as well as mutually beneficial:
As well as encouraging local participation in monitoring programmes, involvement in local management planning also provides opportunities for government departments to ensure that local management objectives are consistent with policy goals or objectives, and that the content of the plan is compliant or consistent with national legislation (Section 2.3.1).
As well as encouraging local participation in monitoring programmes, these activities may also help government evaluate their co-management policy (see Sections 3.2.2.11 and 3.5.8).
5.2.5.6 Disincentives to participation
As well as promoting the incentives described above, government should also recognize and attempt to minimize any disincentives faced by local fishers and other stakeholders to participate in local monitoring programmes. Typically, these disincentives will centre on the opportunity costs associated with their participation, often, though not exclusively in the form of lost earnings. For example, earnings may be lost by fishers because part of their day must now be spent monitoring and recording leaving less time for fishing and related activities such as maintaining their gear. Earnings may also be lost if the value of their catch is diminished as a result of participation. Delaying the transportation to markets or sale to fish traders may result in the deterioration of their catch and subsequent loss of value, or the attainment of less favourable prices. These types of opportunity costs are often overlooked by designers of participatory monitoring programmes.
| BOX 21 The importance of feedback |
| Where data collection is carried out locally but the data are analysed elsewhere, it is important to give regular feedback about the results of the monitoring. Data collectors need to see the results of their hard work to understand how the data they collect contributes to the larger scheme of things. Providing regular feedback helps maintain motivation and ensure the data continue to be collected well. |
| BOX 22 Lessons from Cambodia |
| “[In Cambodia] the CFDO uses a great deal of participatory methods, including PRAs and focus group discussions. However … villagers sometimes find it difficult to spend time participating in these processes if they are not compensated, which can be done through the payment of transportation costs and the provision of snacks” (Felsing, 2004a). |
| BOX 23 Benefits must exceed costs |
| To be effective and sustainable, participatory monitoring programmes must ensure that the incentives or perceived benefits of participation exceed the cost of participation. |
For example, on Lake George in Uganda, the opportunity costs of participation compared to the perceived benefits may be threatening the sustainability of the Catch Assessment Survey (CAS) (Lamberts, 2004). With poor preservation facilities, fisherman experience a decline in the value of their catch as they queue at “weighing check-points” to have their catches sampled. In addition, the time forgone waiting could have been used for other income generating activities. Opportunity costs should also be considered when co-designing data and information sharing systems and other co-management activities.
5.2.5.7 Other conditions that affect participation
In addition to perceived benefits and costs, a number of other factors described by Garaway and Arthur (2002) and Guijt et al. (1998) are likely to affect stakeholder participation in monitoring and evaluation which should be borne in mind when designing systems:
5.2.5.8 Check the agreed data collection and sharing strategy
A checklist of the type below may help to confirm or otherwise that you have the right strategy.
Once stakeholders have identified their common and unique data needs to evaluate the performance of their policies and local management plans and agreed who will collect these data, how, from where, and share with whom, they will now need to design communication systems pathways or networks for sharing these common data needs. However, depending upon the agreed roles and responsibilities of the stakeholders, these information sharing pathways or networks might also be required to:
| BOX 24 Lessons from the Lao People's Democratic Republic |
| In the Lao People's Democratic Republic, it was found that providing access to information regarding others' experiences was a key role of information networks. Likewise, providing district level staff with the opportunity to discuss ideas and experience with each other and with state level staff and external researchers provided more opportunities for learning and information sharing at that level (MRAG, 2004). |
Remember, many of these information sharing and feedback requirements of the system may be incentives offered in return for participation in data collection (and other co-management) activities (see Section 5.2.5.5). An effective data sharing system may therefore be key to sustaining the data collection system.
Advice on designing information sharing systems in the context of fisheries management is sparse. This probably reflects the fact that there are no blueprint solutions or generically applicable networks. The design of the information sharing system will be dependent upon the institutional arrangements and administrative structures defining the co-management arrangements, and the roles, responsibilities and capacity of each key stakeholder. Garaway and Arthur (2004) suggest that stakeholders should start be examining existing communication networks; their opportunities and constraints. A diagram illustrating potential information flows is shown in Figure 17.
5.2.6.1 Communications mapping
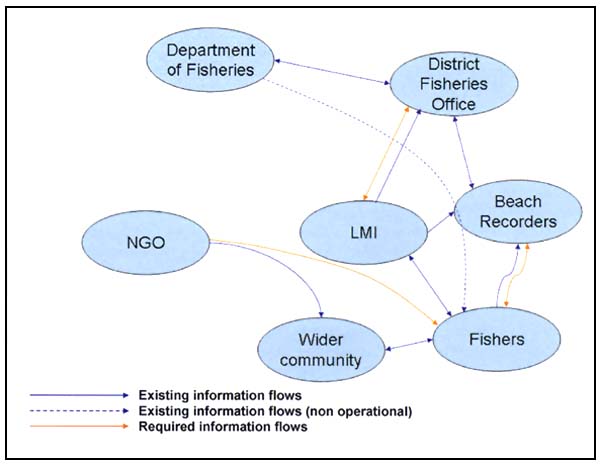
One way of identifying possible information sharing networks is to draw a communications map showing existing and required information flows among stakeholder. Start by writing each stakeholder group on a piece of paper or card and positioning them on a larger sheet of paper. Then draw arrows that link different stakeholders to represent current and required information flows (see Figure 18).
These diagrams can be drawn by stakeholders and used as the basis for discussions to identify their opportunities and constraints, and develop networks for the data collection and sharing system. Trust among stakeholders is the most important thing to be able to develop effective systems (Box 25).
5.2.6.2 Develop information sharing systems
To design and agree on a data and information sharing system, stakeholders will need to discuss and agree on the following points:
FIGURE 17
Illustration of the potential information flows that might be created
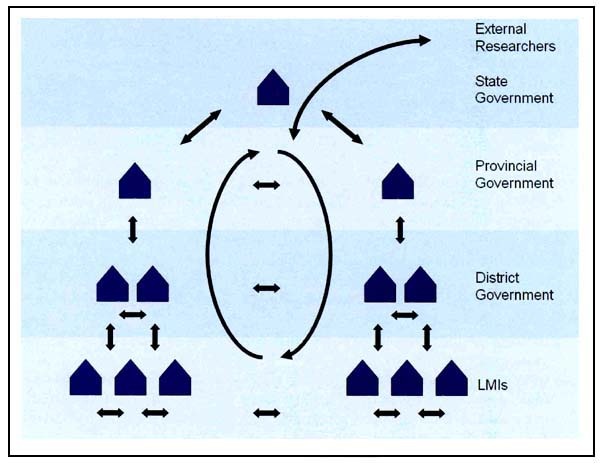
Modified from Garaway and Arthur (2004)
FIGURE 18
Example of a communications map
| BOX 25 Lessons from Cambodia |
| “[In Cambodia] District Fisheries Officers sometimes are not trusted in rural communities because of the policing role and ‘rent-seeking’ behaviour undertaken by some officers. The value of trust in information sharing is underscored by the reported importance of word-of-mouth information in rural communities, and [it is] recommended that information be brought to communities by trusted, regular and recognisable sources, and be delivered in an interactive manner. [The] use of mass media such as TV, which is becoming increasingly common in rural areas [also has potential]. The provision of information to communities through regular and lengthy field visits is expensive, and a better way to reach communities may be through the establishing of a network for sharing information where communities and other stakeholders interact directly with each other through a series of scheduled meetings” (Felsing, 2004a). |
It is important that these systems are realistic and sustainable. For example, if information is to be passed on through a phone call, there must be resources available to pay for the cost of the calls; if the postal system is unreliable, other methods will have to be found to deliver data on printed material, diskette or CD.
Some examples of existing data and information sharing networks are described in Annex 2.
5.2.6.3 Media for information distribution
A variety of media and methods might be used to deliver, disseminate and facilitate information sharing each having associated advantages and disadvantages. Literature, for example, can reach the largest number of people, but does not provide the opportunity for feedback. Radio provides for speedy communication to a wide audience and often encourages feedback, but is not appropriate for communicating detailed or complex information (Muthiah, 1991). Face to face contact can lead to greater understanding and more frank discussion and feedback. A matrix based approach involving discussions with the key stakeholders may provide a useful means of agreeing which approach might be most appropriate (see for example Table 13 below). Further practical guidelines are given in Maine et al. (1996).
The utility of existing information sharing networks might also be explored. The STREAM initiative, for example, facilitates information and knowledge sharing on a regional scale concerning a wide range of issues related to aquatic resource management and poverty alleviation. Stakeholders in ten Asia Pacific countries currently share information about technologies, practices, ways of working, research, development, legislation and policy via the STREAM journal and Web site (http://www.streaminitiative.org/). OneFish (http://www.onefish.org/), an Internet portal ,also provides an enabling environment for sharing research-based knowledge among diverse stakeholder groups.
| BOX 26 Participatory monitoring in Guinea - disseminating lessons using video |
| A SFLP community project has assisted small-scale fishermen in Koukoudé, Bongolon and Matakang (Guinea) in the participatory monitoring, control and surveillance (MCS) of industrial trawlers. These vessels break zoning regulations and the participatory surveillance carried out by the communities in collaboration with the Centre for National fisheries Surveillance (CNSP) has had a positive impact on reducing incursions and improving the livelihoods of the fisheries communities in the zone. The SFLP assisted in the production of a video documentary to describe these experiences. The video will subsequently be translated into English and Portuguese in order to spread the lessons learnt to other SFLP countries where similar problems exist. The script has been drafted with input from all stakeholders and the video documentary was shown at the national forum on participatory MCS held in Conakry in April 2003. |
| BOX 27 The importance of coordination |
| “[In the United Republic of Tanzania] the creation of a Central Co-ordinating Committee (CCC) for each of the Management Areas under the Program is seen as a critical mechanism for information sharing and exchange. The CCC brings together representatives from the different villages (and in some cases districts) and provides a valuable point for intervention or inputting new information into the local systems. The CCC is not just a “talking shop” but has a number of heavy responsibilities especially in terms of the consolidation of the management plans from the various villages” (Purvis, 2004). |
5.2.6.4 Practical considerations when disseminating information
The following recommendations have been identified from IFAD (2002) and from the studies described in Preparation of this document in Part 1:
TABLE 13
An example of a matrix approach to help identify appropriate communication media and methods with
stakeholders (modified from MRAG, 2004)
| Communication activity | |||||
| Communication media or method | Delivery of data and information from LMI to other stakeholders. | Dissemination of development plans and results of policy evaluations | Dissemination of information for coordinating and enforcing management plans | Dissemination of technical and socio-economic advice/findings | Sharing information, lessons and experiences among LMIs and other stakeholders |
| One-to-one meetings | Y | Y | |||
| Group/ village meetings | Y | Y | Y | Y | Y |
| Workshops/conferences | Y | Y | Y | Y | Y |
| Web site | Y | Y | Y | ||
| Electronic files / database | Y | ||||
| Video conference | |||||
| Data recording forms | Y | ||||
| Management Plan Document | Y | Y | Y | ||
| E-mail / Fax | Y | Y | |||
| Telephone | Y | ||||
| Radio Broadcasts | Y | Y | |||
| Posters | Y | Y | Y | ||
| Conference proceedings | Y | Y | Y | ||
| Y | Y | ||||
| Journal article | Y | ||||
| Newspaper article / Newsletter | Y | Y | Y | ||
| Technical report | Y | Y | |||
TABLE 14
Example of a monitoring and evaluation matrix
| Information needs and indicators | Baseline information existing information and required action | Data gathering: data collection sources and methods, frequency and responsibilities | Planning and resources: required forms, planning, training, data management, expertise, resources and responsibilities | Information use: analysis, reporting, feedback and responsibilities |
| Indicator 1 | ||||
| Indicator 2 |
Source: IFAD, 2002.
5.2.6.5 Record the plan
The operational details of the data collection and sharing strategy should be summarized and supported by a workplan or schedule for data collection, possibly in a similar format to the Monitoring and Evaluation Matrix below (Table 14), with maps or diagrams showing the position of data collection locations. Providing a list of data collectors and a roster may also be needed. Annex C of IFAD (2002) provides a worked example in the context of project monitoring and evaluation.
5.2.7.1 Data recording systems
Data can be recorded in many ways, depending in large part on the data collection method (Section 4.2). Some methods, particularly the interview and direct observation methods may require filling in of logbooks, ledgers, forms or tables, whilst others might utilize a video camera or taking detailed notes. For each data variable selected above, it will be necessary to agree upon how it will be recorded. Consistent methodology will help to ensure that data are comparable. For routinely collected data, recording forms should include basic information that facilitates data checking and ensures that data can be referenced, sorted, collated and manipulated (Table 15).
TABLE 15
Examples of basic fields of information typically included in data collection forms
| Basic information fields | Examples | Units |
| Form number | Form number Serial number | Alpha-numeric or number |
| Enumerator ID | Name of recorder/observer Team number Recorder team ID Observers ID | Text Number Alpha-numeric Alpha-numeric |
| Major stratum | Region Strata I-XII Stratum ID | Text Roman numerals Alpha-numeric |
| Minor stratum | Area Stratum Province Island name Location/locality Island ID | Alpha-numeric or text |
| Minor stratum descriptors | Latitude Length of shoreline % of shoreline District | Degs. Mins. Secs km % Text |
| Survey date/Period/Time Date | Month Time Date | Text Time |
| PSU ID | Landing site Fishing camp Village name/code Code of fishing site Fishing site ID/serial number Name of fishing Site Beach name | Alpha-numeric or text |
| PSU descriptors | Geographical location Left bank, right bank Distance from ‘X’ Fishery habitat Type of fishing site Environment Accessibility Description of boundaries Permanent landing /fishing site | Text Text km Text Text Text Text Text (Y/N) |
While it is impossible to develop generic data collection forms, Halls et al. (2000) (see report Ref R7042 at http://www.fmsp.org.uk/r7042.htm) identified fields of information that are typically included in recording forms that are employed for frame surveys, catch assessment surveys (CAS), biological and socio-economic monitoring programmes, and for vessel monitoring and licensing purposes. While these fields are not exhaustive or definitive, workers have reported that they provide a useful starting point for designing data collection forms (Jim Anderson pers. comms.). Users of data recording systems should ideally be involved in their design to ensure that they are both understandable and appropriate. Further guidance on the design of data collection forms including numerous examples can be found in Sparre (2000); FAO (1999); Caddy and Bazigos (1985) and Bazigos (1983).
5.2.7.2 Data management system
When considering how to store data and information IFAD (2002) recommend that stakeholders bear in mind:
| BOX 28 End-user requirements and capacity |
| “[In Cambodia] the community fisheries pilot database was originally developed using Microsoft Access, but was later changed to Microsoft Excel to ease operation by CFDO staff. The potential for executing queries and generating reports using Microsoft Excel is limited, but naturally the database is of no use if it cannot be operated at the local level. This stresses the need for the development of information management systems with the end-users” (Felsing, 2004a). |
5.2.7.3 Electronic databases
Electronic databases provide a means of storing raw data in a secure and standard format and help facilitate its rapid processing (filtering, aggregating, transforming) for decision-making. Databases also help to ensure data validity, integrity and consistency, and may allow different datasets to be integrated thereby increasing their overall utility. FAO (1999) offer guidelines on database design including advice on software development, interfaces, documentation, as well as data processing, reporting, access and dissemination. A more thorough treatment of the design of database tables, forms and queries can be found in Sparre (2000) which includes a detailed description of an example database.
FAO have also produced software called ARTFISH (Approaches, Rules and Techniques for Fisheries Statistical Monitoring) to help design shore-based surveys for generating fishery production and value information, and supporting database (Box29). The software can be downloaded at http://www.fao.org/fi/artfish.htm which also contains links to other relevant documents.
| BOX 29 The ARTFISH software |
| The ARTFISH software is a family of standardized statistical approaches and computer software aimed at facilitating the design and implementation of shore-based fishery surveys on fish production and values. The software comprises three components: |
| ARTPLAN is intended for planning frame surveys and evaluating alternative sampling scenarios for cost-effectiveness, including required sample sizes, drawing upon existing knowledge regarding fishing operations and patterns. |
| ARTBASIC is the central module used for the storage and processing data concerning catch, effort and prices. It operates on standard classifications, frame survey data and samples on catches, fishing effort, prices and values and generates output stratified by month and boat or gear type. |
| ARTSER generates formatted reports and allows for flexible and user-friendly data screening and extraction, data grouping, reporting and plotting. |
| All ARTFISH procedures contain built-in operational guidelines. The installation kit also includes a quick-start user manual. About 12–15 days training is typically required for learning the functions of these ARTFISH components. |
| ARTFISH does not require additional programming, changing of software or any specific computer expertise thereby minimising development and training costs. It has been designed to adapt to any situation and its use can thus be as sophisticated as the country needs dictate. Users need only construct the required survey structures and feed the system with parameters and sample data. Since 1994, the software has been implemented in 15 countries in Africa, Asia, Latin America and the Caribbean. |
| For further information see http://www.fao.org/fi/artfish.htm |
The final stage in the design process is the implementation and revision or refinement of the system during which consideration should be given to the following:
![]()
![]()
![]()