![]()
![]()
![]()
Data collection sources and methods to meet most of the data requirements described in Section 3 have already been described by FAO (1999, Chapter 6). Whilst wishing to avoid duplication, an overview of this material is included here for the sake of completeness, to raise awareness of the range of potential sources and methods that might be employed in a data collection system, and to highlight factors that might affect their selection. Compared to FAO (1999) however, greater emphasis is given here to participatory monitoring approaches that are likely to be advocated as part of co-management policy.
As well as FAO (1999) and Sparre (2000), we also recommend that designers refer to FAO Udon Thani Workshop Report (FAO/MRC, 2003) which describes alternative approaches for collecting inland fishery statistics (see Section 4.6.1 below). Useful literature and other sources of information concerning participatory monitoring approaches are provided in Section 4.3.2 below.
FAO (1999) identifies six categories of data collection sources:
Five basic categories of data collection methods exist (see FAO (1999) for more details):
Whilst participatory monitoring and evaluation (PM&E) can potentially employ any of the same sources and methods to those described above, it is often regarded as a distinct approach synonymous with co-management and community-based initiatives. Indeed, the approach is often viewed as a prerequisite for the entire process of implementing decentralized small-scale fisheries co-management. We therefore describe its main principles below drawing from a review by Estrella and Gaventa (1998).
The term PM&E is often used to describe a range of closely related approaches including participatory evaluation, participatory monitoring, participatory impact monitoring, process monitoring, self evaluation and community monitoring. In practice the differences between conventional and participatory approaches to evaluation are not always obvious. Indeed any of the methods described in Section 4.2 could be employed in the context of PM&E since they could all require some form of stakeholder participation. What distinguishes the two approaches is not necessarily the sources and data collection methods employed, but the extent to which local stakeholders are involved in choosing or selecting these sources and methods, the variables to be monitored, and ultimately benefit from the outputs and the act of participating.
Externally-led PM&E programmes are organized and initiated externally and conducted by enumerators having no direct involvement or interest in the outcome of the project or management initiative. This is akin to the more conventional application of the methods described above. Internally-led PM&E programmes are designed and implemented by the local stakeholders directly involved in the project or management plan. These programmes are perceived as contributing to local capacity building and organizational strengthening and being more likely to be a sustained integral community activity. Joint PM&E programmes combine elements of internal and external approaches to evaluate projects or management activities from the perspectives of both “insiders” and “outsiders” 3;. By involving a greater diversity of stakeholders, a more holistic perspective is sought. In other words, by involving all the relevant stakeholders, the outcomes and findings of monitoring and evaluation are expected to cater to information needs of a variety of user groups. The role of outsiders is often to encourage and help insiders set objectives, identify their information needs and monitor and evaluate their activities. In the context of this manual, joint PM&E programmes are therefore recommended for co-managed fisheries, particularly if the data and information needs of higher level managers can also be satisfied (Section5). As well as participation, the concept of learning is a major principle of PM&E where emphasis is on practical “action-orientated learning. Participants learn from experience, and thereby gain a greater understanding of the factors that affect their outcomes. When multiple stakeholders are involved in the process, the PM&E also encourages and promotes negotiation and builds trust. The process is regarded as empowering and encourages participants to increase their understanding of their own roles and responsibilities. The combination of data sources and methods selected should be relevant to the needs of stakeholders and may evolve is response to changing needs (Estrella and Gaventa, 1998).
Experience suggests that the extent of participation may vary significantly at different stages of the process, typically with less involvement of local participants at the early design as well as the later analysis and dissemination stages, leaving most of the participation occurring at the data collection stage. Programmes that do not involve local stakeholders in planning and analysis are often referred to as being “extractive” rather than “empowering” and therefore likely to be unsustainable and ineffective. Avoiding being “extractive” is a significant but important challenge when designing and implementing PM&E programmes (see Section 5).
Adopting participatory approaches generally require substantial time commitment from many different stakeholders. Time requirements will reduce as experience of the methods is gained and integrated into existing activities and programmes. The approach will also require training in the use of the techniques, greater coordination of human resources, administrative effort and long-term commitment from stakeholders at all management levels. Training workshops in PM&E are often conducted by NGOs or through donor programmes.
Participatory analysis, monitoring and evaluation for fishing communities by Maine et al. (1996) presents 26 participatory monitoring and evaluation tools for use by local field staff and community members engaged in management activities and projects. The manual can be ordered at http://www.fao.org/.
Berkes et al. (2001) describe common methods and approaches employed in fisheries research adapted from Chambers (1997) including seasonal calendars, participatory mapping, transects and observation participant observation, interview approaches and focus group discussions. The book is available online at http://www.idrc.ca/.
PRA approaches, case studies and reviews can also be found at http://www.iied.org/sarl/pla_notes/ or Annex D of IFAD (2002), http://www.ifad.org/evaluation/guide/index.htm. ELDIS (http://www.ids.ac.uk/eldis/eldis.html) is a gateway to information on development and the environment and is an excellent source of information about PM&E with sections and direct links to other sources on background and PM&E concepts, methods/tools and manuals, indicators, case studies and bibliographies. The Participation Group at the Institute of Development Studies http://www.ids.ac.uk/ids/particip/index.html is another valuable source of relevant information including links to networks in more than 50 countries.
| BOX 13 Lessons from Cambodia |
| “[In Cambodia] traditional and local knowledge may provide the cheapest and most feasible way to collect information on the migration patterns of fish species, standard of living of local people, the health of the fishery…and the areas…most suitable for the establishment of fish sanctuaries” (Felsing, 2004a). |
The International Institute for Rural Reconstruction (IIRR) has published a three volume manual on participatory methods in community-based coastal resource management employed by field practitioners in the Philippines, Indonesia, India and other Asian countries. The manual can be ordered at http://www.iirr.org/publicaitonbdate.htm.
An important decision when planning and designing a data collection system is the choice between complete enumeration and sampling. Complete enumeration involves measuring or recording variables for the entire “population” of data units (e.g. fishers, boats, households, markets…etc) whereas sampling involves measuring just a known proportion or sample of these units. Complete enumeration is commonly adopted for frame surveys (see Section 5.2.2.3) and population censuses or when reporting information can be made an obligation of an access or licence agreement thus reducing the cost of this approach (Section 5.2.5.5). Most types of variables can be collected using either approach, and whilst complete enumeration may be seen as desirable, often it is not practical because of resource limitations. Well-designed sample-based surveys can often provide sufficiently accurate and precise enough information at a fraction of the cost. Random sampling aims to avoid sampling bias (improve accuracy) by ensuring that all data units have an equal opportunity of being selected (see Section 5.2.3.4).
Stratification is typically employed as part of sample based surveys to reduce the error in sample estimates (i.e. improve the precision of the estimate) by systematically removing data variability through the sampling design. This is achieved by dividing the sample population into groups or strata where as much as possible of the variability in the population is represented in differences between the groups. These strata may be based upon administrative or geographical criteria (major strata) often imposed for reporting purposes, as well as statistical criteria (minor strata) chosen to partition the population into homogenous sub-sets. Examples of minor strata include habitat, season, demographic variables (e.g. gender, age, income etc), boat and gear types. Guidelines for selecting strata are given in FAO (1999).
The choice of appropriate data collection sources and methods to generate the data and information required by co-managers will depend upon a number of interacting factors (Figure 10). Careful consideration must be given to each of these factors when selecting sources and tools.
These interacting factors include:
FIGURE 10
Factors influencing the choice of data sources and data collection methods
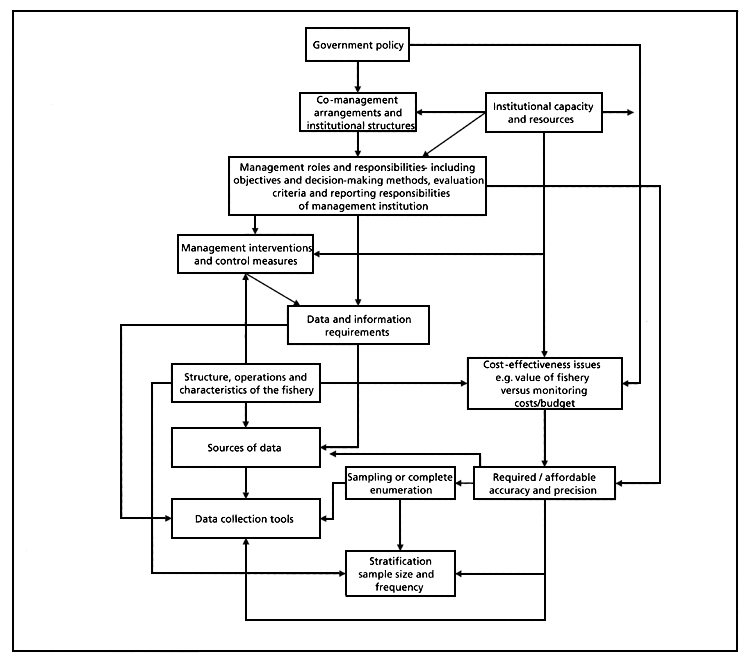
Table 9 - Table 11 provides some guidance on sources and methods that may be appropriate in relation to the four categories of data identified in Chapter 3. Further guidance on selecting sources and tools is provided in Section 5.2.5. Note the importance of management plan information. All four categories include data and information contained in management plans. The use of a standard format for management plans among should be encouraged to allow among co-management fishery or unit comparisons (Section 3.5) and to ensure that all relevant data and information is included.
TABLE 9
Potential sources of commonly required data for co-managers
Data Categories: 1 - Data for policy and development planning and evaluation (Section 3.2); 2- Data to formulate local management plans (Section 3.2.3); 3- Data to enforce and coordinate local management plans (Section 3.3); 4- Data to evaluate local management plan performance (Section 3.5). *For example, fish consumption, poverty, equity data etc). ** includes details of access rights and other local institutional arrangements. ●-strong linkage; ○-Secondary Linkage ; ♦- Possible source or secondary validation.
| Data category | Data type | Harvest | Post harvest | Markets | Consumers | Support industry | Government agencies |
| 1 | Catch (3.2.1.1; 3.2.1.2; 3.2.2.1; 3.2.2.2; 3.2.2.4) | ● | ● | ○ | |||
| Effort (3.2.2.2; 3.2.4.4; 3.2.4.2) | ● | ♦ | ♦ | ||||
| Market (3.2.1.1; 3.2.2.5; 3.2.5) | ○ | ● | ● | ○ | ○ | ♦ | |
| Trade (3.2.1.2; 3.2.1.4; 3.2.4.3; 3.2.5) | ♦ | ♦ | ● | ||||
| Employment (3.2.1.3; 3.2.2.1; 3.2.5) | ● | ● | ● | ● | |||
| Population/Demographic (3.2.1.2; 3.2.1.3; 3.2.1.5; 3.2.2.1; 3.2.2.4; 3.2.2.6; 3.2.2.7; 3.2.3; 3.2.5) | ● | ● | ● | ● | ● | ||
| Household data* (3.2.1.2; 3.2.1.3; 3.2.1.5; 3.2.2.4; 3.2.2.5; 3.2.2.6; 3.2.2.7; 3.2.3) | ● | ● | ● | ● | |||
| Management Plan ** (3.2.2.11) | ● | ● | ● | ● | ● | ||
| Compliance (3.2.2.3) | ● | ● | |||||
| Costs and earnings (3.2.2.5; 3.2.2.6; 3.2.2.7; 3.2.2.10; 3.2.3) | ● | ● | ○ | ♦ | ♦ | ♦ | |
| Access to resources (3.2.2.8) | |||||||
| Conflict (3.2.2.9) | ● | ○ | ♦ | ● | |||
| Management costs (3.2.2.10) | ● | ● | |||||
| MDG indicators (3.2.3.1) | ● | ● | ● | ● | |||
| PRSP data (3.2.3.2) | ● | ● | ○ | ● | ● | ||
| NSSD indicators (3.2.3.3) | ● | ● | ○ | ● | ● | ||
| Vessel statistics (3.2.5) | ● | ♦ | ♦ | ● | |||
| 2 | Management plan (3.3) | ● | ● | ● | ● | ● | |
| 3 | Fisher/vessel/licence details (3.4.1) | ● | ♦ | ♦ | |||
| Management plan (3.3) | ● | ● | ● | ● | ● | ● | |
| 4 | Catch (see above) | ● | ● | ||||
| Effort (see above) | ● | ♦ | |||||
| Market (see above) | ○ | ● | ● | ● | ○ | ♦ | |
| Costs and earnings (see above) | ● | ● | ○ | ♦ | ♦ | ♦ | |
| Conflict (see above) | ● | ○ | ♦ | ● | |||
| Compliance (see above) | ● | ● | |||||
| Other (negotiated) indicators (5.2.3) | ● | ● | ● | ● | ● | ||
| Management plan (explanatory variables) (3.5.2) | ● | ● | ● | ● | ● |
TABLE 10
Guide to potentially appropriate methodologies for collecting data commonly required data by co-managers by complete enumeration modified and revised after FAO (1999)
Data Categories: 1 - Data for policy and development planning and evaluation; 2- Data to formulate local management plans; 3- Data to enforce and coordinate local management plans; 4- Data to evaluate local management plan performance. *For example, fish consumption, poverty, equity data etc). **includes details of access rights and other local institutional arrangements. ●-strong linkage; ○-Secondary Linkage ; ♦- Possible source or secondary validation
| Interview-based | Direct Observations by | Reporting sector | |||||||||||
| Data category | Data type | Registration | Questionnaires | Open-ended | Structured | PRA type | DoF | Intermediaries | LMI | Harvest | Post harvest | Sales | Trade |
| 1 | Catch (3.2.1.1; 3.2.1.2; 3.2.2.1; 3.2.2.2; 3.2.2.4) | ● | ● | ● | ● | ● | ♦ | ● | |||||
| Effort (3.2.2.2; 3.2.4.2; 3.2.4.4) | ● | ● | ● | ● | ● | ||||||||
| Market (3.2.1.1; 3.2.2.5; 3.2.5) | ○ | ○ | ○ | ♦ | |||||||||
| Trade (3.2.1.2; 3.2.1.4; 3.2.4.3; 3.2.5) | ● | ||||||||||||
| Employment (3.2.1.3; 3.2.2.1; 3.2.5) | ● | ● | ● | ||||||||||
| Population/Demographic (3.2.1.2; 3.2.1.3; 3.2.1.5; 3.2.2.1; 3.2.2.4; 3.2.2.6; 3.2.2.7; 3.2.3; 3.2.5) | ● | ● | |||||||||||
| Household data* (3.2.1.2; 3.2.1.3; 3.2.1.5; 3.2.2.4; 3.2.2.5; 3.2.2.6; 3.2.2.7; 3.2.3) | ● | ● | |||||||||||
| Management Plan ** (3.2.2.11) | ● | ● | ● | ● | ● | ● | ● | ● | ● | ● | |||
| Compliance (3.2.2.3) | ● | ● | ● | ● | ● | ||||||||
| Costs and earnings (3.2.2.5; 3.2.2.6; 3.2.2.7; 3.2.2.10; 3.2.3) | ○ | ● | |||||||||||
| Access to resources (3.2.2.8) | ● | ● | |||||||||||
| Conflict (3.2.2.9) | ● | ||||||||||||
| Management costs (3.2.2.10) | ● | ● | |||||||||||
| MDG indicators (3.2.3.1) | ● | ● | |||||||||||
| PRSP data (3.2.3.2) | ● | ● | |||||||||||
| NSSD indicators (3.2.3.3) | ● | ● | |||||||||||
| Vessel statistics (3.2.5) | ● | ● | ● | ● | |||||||||
| 2 | Management plan (3.3) | ● | ● | ● | ● | ● | ● | ● | ● | ● | ● | ||
| 3 | Fisher/vessel/licence details (3.4.1) | ● | |||||||||||
| Management plan (3.3) | ● | ● | ● | ● | ● | ● | ● | ● | ● | ● | |||
| 4 | Catch (see above) | ● | ● | ● | ● | ● | ♦ | ○ | |||||
| Effort (see above) | ● | ● | ● | ● | ● | ||||||||
| Market (see above) | ○ | ○ | ○ | ♦ | |||||||||
| Costs and earnings (see above) | ○ | ● | |||||||||||
| Conflict (see above) | ● | ||||||||||||
| Compliance (see above) | ● | ● | ● | ● | ● | ||||||||
| Other (negotiated) indicators (5.2.3.3) | ● | ● | ○ | ● | ● | ○ | |||||||
| Management Plan (explanatory variables) (3.5.2) | ● | ● | ● | ● | ● | ● | ● | ● | ● | ● | |||
TABLE 11
A guide to potentially appropriate methodologies for collecting data commonly required data by co-managers by sampling modified and revised after FAO (1999)
Data Categories: 1 - Data for policy and development planning and evaluation; 2- Data to formulate local management plans; 3- Data to enforce and coordinate local management plans; 4- Data to evaluate local management plan performance. *For example, fish consumption, poverty, equity data etc). **includes details of access rights and other local institutional arrangements. ●-strong linkage; ○ -Secondary Linkage ; ♦- Possible source or secondary validation.
| Interview-based | Direct observations by | Reporting sector | |||||||||||
| Data category | Data type | Registration | Questionnaires | Open-ended | Structured | PRA type | DoF | Intermediaries | LMI | Harvest | Post harvest | Sales | Trade |
| 1 | Catch (3.2.1.1; 3.2.1.2; 3.2.2.1; 3.2.2.2; 3.2.2.4) | ● | ○ | ● | ○ | ● | ♦ | ● | ● | ♦ | ○ | ||
| Effort (3.2.2.2; 3.2.4.2; 3.2.4.4) | ● | ○ | ● | ○ | ● | ♦ | ● | ● | |||||
| Market (3.2.1.1; 3.2.2.5; 3.2.5) | ● | ● | ● | ● | ○ | ○ | ○ | ♦ | |||||
| Trade (3.2.1.2; 3.2.1.4; 3.2.4.3; 3.2.5) | ● | ||||||||||||
| Employment (3.2.1.3; 3.2.2.1; 3.2.5) | ● | ● | ● | ● | ● | ● | |||||||
| Population/Demographic (3.2.1.2; 3.2.1.3; 3.2.1.5; 3.2.2.1; 3.2.2.4; 3.2.2.6; 3.2.2.7; 3.2.3; 3.2.5) | ● | ● | ● | ● | ● | ||||||||
| Household data* (3.2.1.2; 3.2.1.3; 3.2.1.5; 3.2.2.4; 3.2.2.5; 3.2.2.6; 3.2.2.7; 3.2.3) | ● | ● | ● | ● | ● | ● | |||||||
| Management Plan ** (3.2.2.11) | ● | ● | ● | ● | ● | ● | ● | ● | ● | ● | |||
| Compliance (3.2.2.3) | ● | ● | ● | ● | ● | ● | ● | ♦ | |||||
| Costs and earnings (3.2.2.5; 3.2.2.6; 3.2.2.7; 3.2.2.10; 3.2.3) | ● | ● | ● | ● | ○ | ♦ | |||||||
| Access to resources (3.2.2.8) | ● | ● | ● | ● | ○ | ||||||||
| Conflict (3.2.2.9) | ● | ● | ● | ● | ○ | ● | |||||||
| Management costs (3.2.2.10) | ● | ● | ● | ● | |||||||||
| MDG indicators (3.2.3.1) | ● | ● | ● | ● | |||||||||
| PRSP data (3.2.3.2) | ● | ● | ● | ● | |||||||||
| NSSD indicators (3.2.3.3) | ● | ● | ● | ● | |||||||||
| Vessel statistics (3.2.5) | ● | ● | ● | ● | ● | ○ | |||||||
| 2 | Management plan (3.3) | ● | ● | ● | ● | ● | ● | ● | ● | ● | ● | ||
| 3 | Fisher/vessel/licence details (3.4.1) | ● | |||||||||||
| Management plan (3.3) | ● | ● | ● | ● | ● | ● | ● | ● | ● | ● | |||
| 4 | Catch (see above) | ● | ○ | ● | ○ | ● | ♦ | ● | ● | ♦ | ○ | ||
| Effort (see above) | ● | ○ | ● | ○ | ● | ♦ | ● | ● | |||||
| Market (see above) | ● | ● | ● | ● | ○ | ● | ○ | ♦ | |||||
| Costs and earnings (see above) | ● | ● | ● | ● | ○ | ♦ | |||||||
| Conflict (see above) | ● | ● | ● | ● | ○ | ● | |||||||
| Compliance (see above) | ● | ● | ● | ● | ● | ● | ● | ♦ | |||||
| Other (negotiated) indicators (5.2.3.3) | ● | ● | ● | ● | ● | ♦ | ● | ● | ○ | ○ | |||
| Management plan (explanatory variables) (3.5.2) | ● | ● | ● | ● | ● | ♦ | ● | ● | ● | ● | |||
A recent FAO/MRC ad hoc expert consultation examined alternative approaches for collecting inland capture fishery statistics (FAO/MRC, 2003). The main conclusion drawn from the consultation was that direct observation methods particularly for collecting Category 1 data types (e.g. Gross value of production, food security, community dependence…etc) are often both impractical because of the operational characteristics of the fishery (highly dispersed fishers and landing sites, strong seasonality etc) and often unnecessary because of the required precision and frequency at which it is necessary to collect them (typically low and infrequent). Instead indirect methods such as interview or questionnaire employed as part of national censuses or household (consumption) surveys, that are often conducted by other government departments or ministries, can provide estimates that are adequately accurate for policy and development planning and evaluation purposes. (Document available at http://www.fao.org/DOCREP/005/AD070E/ad070e00.htm.)
A useful way of helping identify appropriate data sources and collection methods particularly in relation to collecting catch data is by means of fish disposition pathway diagrams (Mahon and Rosenberg, 1988) constructed on the basis of frame survey or PRA results (Figure 11). These diagrams summaries the disposition paths of fish or fishery products from fisherman through all participants or major stakeholders in the industry, to the end user. Each complete path from fisherman to end user may consist of several segments. The diagram helps identify appropriate points at which data collection may occur. Different data collection tools will be appropriate at different path segments. The diagram also helps decide where resources are best focused to achieve maximum coverage. Low priority segments may be covered with less rigorous methods than those known to account for significant amounts of catch. Such path diagrams also provide a framework for regular review of data collection systems, for adapting to change and for planned improvement of the system as capacity changes (Mahon and Stamatopolous, 1988).
FIGURE 11
Examples of fish disposition pathway diagrams for (a) conch and lobster and (b) finfish in the Turks and Caicos Islands
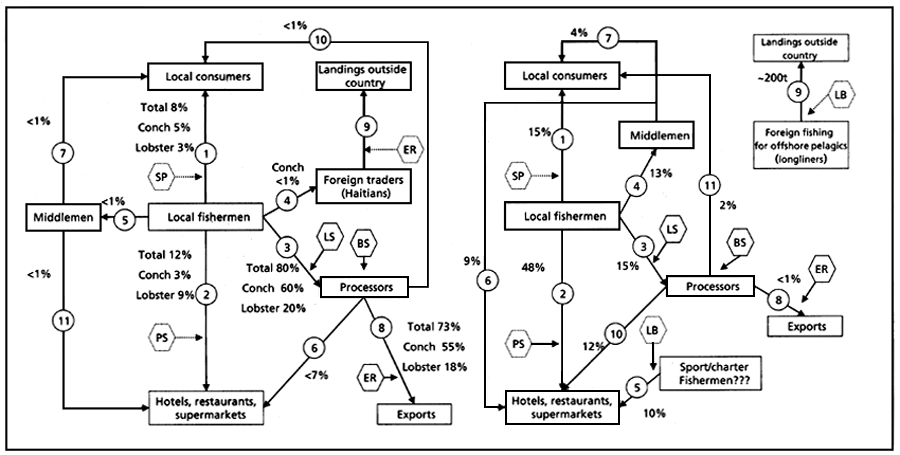
Percentages indicate tentative estimates moving along each path. Existing (solid lines) and proposed (hatched lines) data collection tools are shown in hexagons (PS - purchase slip, LS - landing sheet, ER -export records, SP - sampling programme, LB-logbook, BS-biological and price sampling).
Source Halls et al. (2000).
![]()
![]()
![]()