![]()
![]()
![]()
Merritt Cluff and David Vanzetti[29]
This paper addresses the question "What do the categories of Special Products and Sensitive Products mean for the prospects of liberalization of dairy trade?" It proceeds by examining characteristics of market access in the global dairy sector, and by looking at aspects and implications of the appropriate clauses of the WTO July 2004 Framework Agreement dealing with Special Products and Sensitive Products. Using the FAO-UNCTAD Agricultural Trade Policy Simulation Model, the paper assesses the possible impact of these clauses on the prospects for market access liberalization in the dairy sector, using relevant aspects of the EU’s 28 October 2005 proposal as an example. It concludes that, as expected, Special Product exemption has limited impact on market outcomes, while that of Sensitive Product treatment could have significant implications. The critical issue, in this case, is the mapping of tariff deviation from the general tariff formula to proposed scheduled tariff rate quota increases. The empirical analysis should be considered illustrative of impacts, not definitive, as more research is necessary to examine individual country cases in more detail.
As identified in the recent OECD-FAO Agricultural Outlook: 2005 to 2014, the dairy sector is among the fastest growing agricultural sub-sectors.[30] Still, dairy product trade remains highly constrained, and without increases in market access, it will remain a low proportion of global output.
The dairy sector has proven to be a difficult sector to reform.[31] In the Uruguay Round, the tariffication exercise resulted in dairy products having among the highest tariffs in the agricultural sector, with a large number of tariff rate quotas. While some expansion in minimum access did occur with TRQs, additional growth in world markets has largely been accomplished by increased imports by developing and transitional countries. In general, significantly increased market access for dairy products in developed and certain developing countries awaits more significant negotiation at the multilateral level. Even some regional trade agreements have excluded dairy products.[32]
In this context, there has been little movement in policy-related dairy support in many countries. An exception is the reform of dairy policy in the EU, in which intervention prices are being lowered and support re-oriented to a single farm payment approach. However, in important developed countries, high (often "mega") tariffs remain that are prohibitive to trade. Bound tariffs also may be much greater than necessary to shield domestic policy instruments, and even considerable cuts in these tariffs may not affect market access. In such a situation, only very deep tariff cuts have the potential to bite into domestic policy instruments, and thereby increase market access. This could be true for both developed countries where considerable water exists in tariffs, and in developing countries where applied tariffs are far below bound commitments.[33]
In this context, the July 2004 Framework Agreement (JFA), which included clauses defining Special Products and Sensitive Products, may affect both the potential for and the nature of future dairy reform. The Special Products (SSP) clause may enable developing countries to exempt dairy products from tariff reduction, where the dairy sector may be considered of fundamental importance to "food security, livelihood security and rural development needs". The Sensitive Product (SPP) clause would enable all countries to deviate from formula tariff reductions for a limited (negotiated) number of tariff lines. The clause achieves "substantial improvement" in market access through tariff rate quota expansion that takes "into account deviations from the tariff formula". For example, for those countries that may choose dairy product tariff lines as sensitive, a key question is how might the opening of, or increase in, tariff rate quotas be negotiated, and what would be the potential impact on markets compared to a tariff reduction required by the tariff formula.
This paper explores the liberalization of the dairy product sector from the perspective of how the concepts of Special Products and Sensitive Products may affect dairy markets. It does so first by exploring various aspects of dairy market access by country. It then looks at issues from a Special Products perspective and then for those relevant to Sensitive Products. Finally, several simulations are performed with the FAO-UNCTAD Agricultural Trade Policy Simulation Model (ATPSM), in order to gauge the range of potential impact. The market access aspects of the EU proposal to WTO of 28 October 2005, are used as an example of how implementation of both Special Products and Sensitive Products could affect market outcomes.[34] This proposal is used as it contains both a significant tiered tariff reduction formula, with caps, and moreover, the first full treatment of how to adjust TRQs, given tariff deviations from tariff formula commitments. Results of this analysis are tentative, and are meant to be illustrative rather than definitive. Finally some conclusions are provided that identify key issues for dairy products, and also areas for further research.
The purpose of this section is to identify some critical aspects of existing market access profiles for the dairy sector. These aspects include, the relative importance of dairy tariff lines and tariff rate quotas, particularly in developed countries, the high incidence of tariff overhang in many developing countries, and finally the presence of "tariff water" in developed country over-quota tariffs.
Dairy products are included in chapter 4 of the Harmonized System. At a four digit level, the key components are milk and cream, not concentrated nor sweetened (0401); milk and cream concentrated, or sweetened (0402); fermented or acidified milk and cream products (0403); whey products (0404); butter and other fats and oils derived from milk (0405); and, cheese and curd (0406). At the six digit level, there are 20 lines covering dairy. By country, the number of disaggregated tariff lines varies considerably. For example, in the EU, 175 tariff lines cover dairy; this is 8 percent of their total for agriculture. For the United States the corresponding number is 244 tariff lines or 14 percent of their total. On the other hand, tariff detail for many developing countries is more aggregated into fewer lines.
|
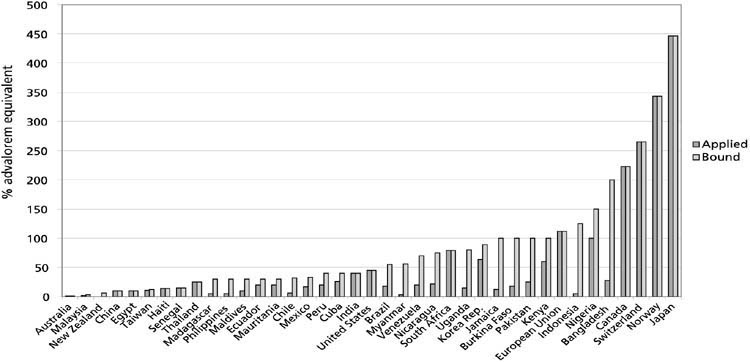
FIGURE 1
Source: ATPSM database |
TABLE 1
Dairy tariff statistics: over-quota and single
tariffs
| |
Bound |
Applied |
Difference Mean |
||||||||
| |
Mean |
Min |
Max |
Stdev |
C.V. |
Mean |
Min |
Max |
Stdev |
C.V |
|
|
Butter |
57 |
0 |
573 |
78 |
138% |
28 |
0 |
447 |
56 |
204% |
29 |
|
Cheese |
50 |
0 |
494 |
63 |
128% |
23 |
0 |
265 |
38 |
162 |
26 |
|
Concentrated products |
54 |
0 |
496 |
71 |
132% |
24 |
0 |
303 |
46 |
188 |
29 |
Source: ATPSM database
Tariff rate quotas for dairy products are about 13 percent (184) of the total number notified. These include 18 in the United States schedule, 12 in the EU, 12 in Japan, and 11 in Canada. Eighteen developing countries also have dairy product TRQs, including India, some countries in East Asia and in Latin America. While average fill rates of dairy product TRQs have been in the range of 65 percent, many TRQs of developed countries are 100 percent filled; very often some important TRQs are overfilled, such as butter in the EU or Canada, or cheese in the United States and Canada. In these cases, however, it is likely that product is imported at the lower in-quota tariff rate.
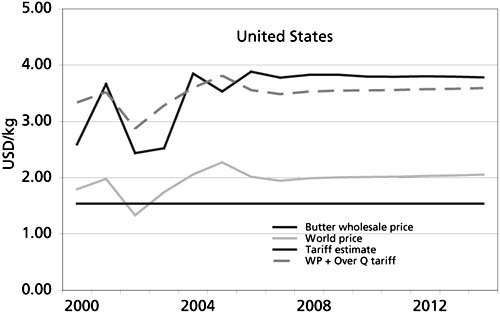
A typical view of both bound and applied over-quota tariffs is illustrated in Figure 1 which shows butter for selected countries; other dairy products show similar patterns.[35] The ATPSM database includes calculated average tariffs (averaged to four digit level) for 161 countries. Over 25 percent of countries have zero or near zero tariffs for dairy products. These countries are primarily located in East Asia, North Africa and the Middle East. As seen from the figure and from Table 1, for butter and for concentrated milk products tariff overhang is very significant in developing countries, particularly those which have initially notified large bound tariffs. For cheese, this tendency may be rather less, but developing countries account for a small proportion of cheese imports.
|
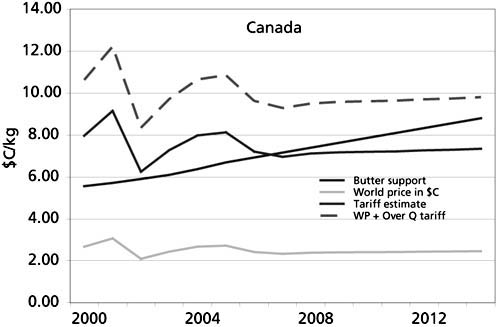
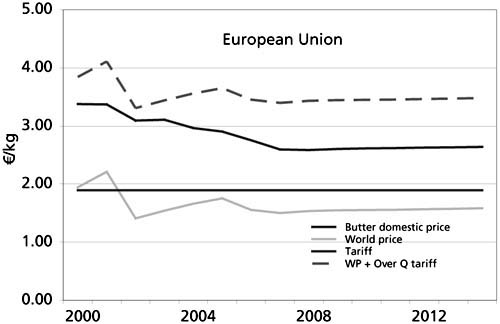
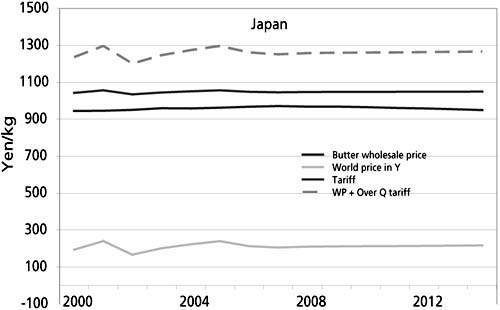
FIGURE 3
Source: Calculations from OECD-FAO Agricultural Outlook: 2005-2014 |
The mean bound tariffs across dairy products are quite similar - between 50 and 67 percent - as are the mean applied tariffs at between 26 and 29 percent. Importantly, the bound and applied tariffs are highly correlated across dairy products, indicating the importance of maintaining a similar tariff/support structure among products which may be complementary or substitutable in product processing. The data show that the correlation of country bound tariffs among the products range between 82 percent and 88 percent, while those for applied tariffs are somewhat less at 65 percent (butter-cheese) to 84 percent (butter-concentrated milk products).
Tariff water
While tariff overhang in developed countries is less prevalent than in the developing countries, many developed countries, and particularly those with complex support programs, have bound and applied tariffs which exceed the tariff equivalence of their market support regimes. Figure 3 provides a graphical view of tariff water in four major dairy producing countries where market price support is also high. The figures provide a forward looking perspective on tariff water assuming a continuing policy environment in which only announced policy changes are included. Figure 3 illustrates for Canada that while considerable tariff water has existed in the past, trend increases in its dairy support prices would continue to erode it. As calculated, estimated tariff water averaged about 45 percent in 2003-2004, but this may reduce over the next ten years if projections are realized.[36] In an opposite situation, tariff water for the EU will increase under its recent CAP reform, in which dairy product intervention prices have been reduced. Japan’s situation is expected to remain stable, while in the United States, little tariff water exists for butter, and internal prices have recently followed its world price plus tariff counterpart.
The issue of tariff water is an important one for highly supported countries, as is the issue of tariff overhang for developing countries. Both provide some indicator of room for reduction in bound rates that would not necessarily affect applied rates or possibly existing policy. The size of tariff "room" may also affect whether and how countries use either the Special or Sensitive product clauses.
While it is true that the JFA contained the first text containing clauses recognizing Special Products and Sensitive Products, the basic concepts are not new, and have been in one way or the other included in most trade negotiations as a means of making deeper progress in liberalization in other areas.[37] Most countries have either particular concerns and/or they have sub-sectors that may render deep reform with general tariff reduction formulae difficult to negotiate. Worldwide, the dairy sector has often stood out being of critical interest in many countries, for reasons that have not always been fully understood.[38] This section attempts to examine issues raised in the JFA that illustrate how they might affect market access commitments in the dairy sector.
Special Products
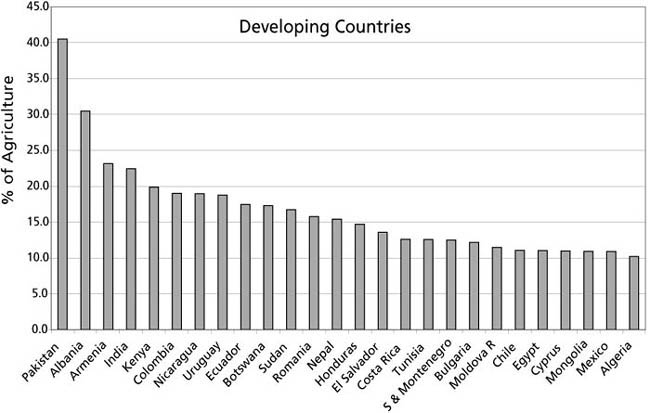
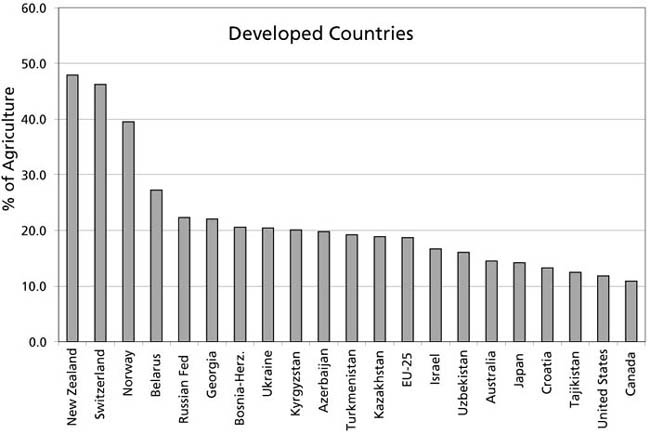
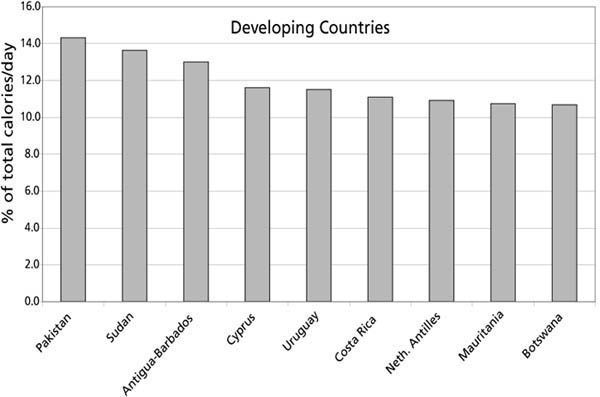
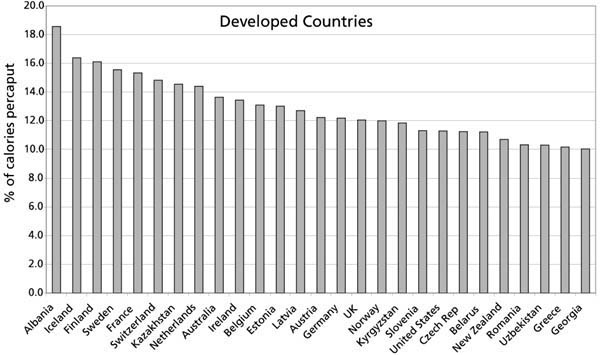
The JFA text proposes that as part of Special and Differential Treatment, developing countries have the option of exempting products which are strategic to "food security, livelihood security, or rural development". Figures 4 and 5 illustrate two characteristics which may indicate such significance for countries where these appear most important. Figures for developed countries are also provided for comparison purposes.
The data in Figure 4 illustrate that the primary dairy sector is indeed significant for a number of developing countries. For example, dairy is a strong contributor to the rural economies of countries in South Asia (Pakistan, India, Nepal) as well as some countries in Latin America (Columbia, Ecuador, Nicaragua, Uruguay) and in Africa (Kenya, Botswana, Sudan). It should be noted that these estimates of value of production do not include revenues/income from sales of animals for trade or for slaughter, nor do they include production from further value added activities. Furthermore, it should be noted that the dairy sector in many developing countries is one of the fastest growing sectors, and many may want to provide "infant industry" protection to enable these sectors to mature. At the same time, there are also many developing countries for which dairy will remain less important. From a consumption perspective (Figure 5), currently very few developing countries depend on milk product calories to any significant degree for their daily energy requirements. However, sector income (milk revenues and draw down of livestock capital savings) from the dairy/livestock sector are often viewed as critical for household food security. In sum, a determination of which countries may declare dairy products as Special Products is difficult. However, for very many developing countries, dairy is neither large on the production or consumption sides, and whether or not they would declare their sectors as special to exempt them from market access commitments would not be likely to have a significant impact on global market outcomes.
|
FIGURE 4
|
|
FIGURE 5
|
An important issue is that with the exception of a few developing countries, the dairy sector may be viewed as more significant for developed countries. Dairy is an important sector in most developed countries, but particularly so in New Zealand, in Europe, and in many former transition countries.
Sensitive Products
It was proposed in the JFA that WTO members could identify a negotiated number of tariff lines as Sensitive Products. With such designation, a substantive increase in market access would be achieved through tariff quota and tariff reductions, rather than through tariff reductions alone. Accordingly "coherent and equitable criteria" for TRQ expansion (or newly established TRQs) would be negotiated on the basis of rules that take account of deviations made from the negotiated general tariff formula. This Sensitive Products clause, so stated, essentially brings back the debate about how to proceed with trade liberalization, giving Members an alternative to tariff reductions alone. This option was essentially a major reason for the initial creation of TRQs under the Uruguay Round, which provided a two tiered approach with a low tariff quota for the first tier, and a higher tariff beyond the tariff quota amount. Members opting for such a process have been primarily concerned to limit the amount of trade, while maintaining high internal market price support to producers, along with any associated marketing options such as production quotas. The critical aspect of the Sensitive Product clause opens the issue of how to expand TRQs, or how to create new ones, on a variable basis, and in relation to tariff reductions not implemented. The question is how (or whether) it provides a relationship/trade-off between tariff reduction and TRQ expansion.
|
FIGURE 6
|
The Sensitive Product clause has three negotiable unknowns. One is simply negotiating the number of tariff lines eligible for Sensitive Product designation, and then, associated with this, choosing which tariff lines to designate under such limits. For dairy products, as for other products which may be substitutable in further product processing, a restriction on the number of lines eligible may create implementation difficulties if not all products can be designated. For example, in the EU, some eight percent of its agricultural tariff lines are dairy products. If the maximum proportion of tariff lines eligible for sensitive product treatment were say five percent, some dairy product tariffs could be reduced considerably more than others. Given that some dairy products can be recombined to create other dairy products, non-aligned tariffs may undermine the dairy tariff structure.
More fundamentally, a critical aspect of Sensitive Products is "equitable" criteria used to obtain an expansion in market access provided by a smaller tariff reduction and an increased TRQ, compared to market access provided by a larger tariff reduction alone, following the general tariff formula. The issue of what is equitable must also include some allowance for a reduced commitment that is connoted by the term Sensitive Product. In sum, the criteria should provide a mapping of the tariff "deviation" from the general formula, to an increase in TRQs, that provides somewhat less market access than a full tariff reduction following the tariff formula. The question is what should be the basis of such criteria?
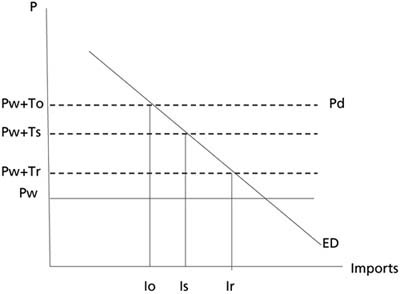
Consider the simplest situation, as in Figure 6, where ED is the excess demand for the country.[39] The initial market situation has world price at Pw, with an original ad valorem equivalent (AVE) over quota bound tariff of To. At the initial TRQ at level Io, there is no in-quota tariff and no tariff overhang, nor tariff water. Domestic price is Pd, which is equal to the world price plus the overquota tariff. A tariff reduction to Tr, would open up access to this market at an import level of Ir, which would be larger than the existing access by Ir-Io. But with a tariff "deviation" from Tr undertaken, at a tariff of Ts, market access would be considerably less at Is. The difference between Ir and Is is critical to the sensitive product issue, as this represents the difference in access at the formula tariff compared to the sensitive tariff. The question is how to choose an import quota change that would compensate, at least partially, for the tariff deviation. In this simple diagram an import quota of Ir would provide the same quantitative level of market access. Define:
|
ED = g(P)= D(P)-S(P) |
(1) |
where D(P), and S(P) are the supply and demand functions respectively.
From (1), it can be approximated that the elasticity of ED, q with respect to changes in P is given by the formula,
|
q = (h - er)/(1-r) |
(2) |
where h is the demand elasticity, e is the supply elasticity, and r is the self sufficiency ratio.
Note that for (2), the excess demand elasticity is infinite at r = 1, or where the country is self sufficient in the product.[40] Note also that for usual products with negative demand elasticity, and positive supply elasticity, q will be negative for r<1, meaning that a decrease in price will increase excess demand.
The point of this simple discussion is that the excess demand elasticity may be used to approximate the import difference between Ts and Tr. If the demand elasticity were, say -0.4, and the supply elasticity were 0.6, then at say a self-sufficiency ratio of 0.9, the excess demand elasticity with respect to price would be about -9. In such a situation, this would indicate that if the current ad valorem tariff were say 90 percent, then a tariff reduction deviation of say 40 percent from a tariff formula would reduce market access implied by the tariff formula by about 170 percent of current imports.[41]
This discussion outlines a framework that may be used in rules to determine a reference for how much TRQ access should changed for a given tariff deviation. From Figure 6, an equivalence in market access for a tariff deviation from the general tariff formula might expand existing quota to Ir. If the Sensitive Product category is to imply somewhat less market expansion, then the quota would be less than Ir. Obviously, it should also be borne in mind that Figure 6 is a very simplified view of a country’s trade position in dairy products. Two important aspects need to be considered. First, if water is present in existing tariffs, there will be no demand effect from that part of any tariff reduction. Secondly, the internal marketing situation of the country is critical: if domestic milk production quotas are in place, then as long as rent exists in the quota (ie. shadow price of quota is positive), the supply elasticity is zero if quotas are exogenously set, or negative, if production quota is set according to domestic demand. Some quota adjustment may be made to adjust supply to meet any domestic demand increase associated with falling internal prices. If production quotas are still binding, they need to be adjusted also to prevent excess export subsidy. While these are complicated reaction functions that are difficult to anticipate, both issues will be present in implementation in most developed countries.[42] However, it is clear that the mapping of tariff reduction deviations to meaningful TRQ expansion is critical to assessing how much the Sensitive Product clause would impact on increased market access.
At the time of writing, very little is known about how the JFA clauses on Special Products and on Sensitive Products will be negotiated and, most importantly, implemented. However, some research does provide certain general conclusions, about what the overall impacts on agriculture might be. For example, a study by the World Bank suggests that with a Sensitive Product clause permitting the exemption of two percent of tariff lines, the resulting market access gains would be small.[43] But this study was undertaken with an aggregate model, and the tariff reduction deviation mapping to a TRQ increase was not identified.
TABLE 2
Tariff reduction formula: EU
Proposal
| |
Developed |
Developing |
||
|
Number of bands |
4 |
4 |
||
|
Thresholds |
Within AVEs |
Linear cuts |
Within AVEs |
Linear cuts |
| |
0<,= 30 |
35% (20-45%) |
0<,= 30 |
25% (10-40%) |
| |
>30<=60 |
45% |
>30<=60 |
30% |
| |
<60<=90 |
50% |
<60<=90 |
35% |
| |
>90 |
60% |
>90 |
40% |
|
Caps |
100% |
|
150% |
|
A detailed OECD study of agricultural tariffs and tariff rate quotas showed that a 50 percent tariff quota expansion had little effect on the market outcomes at an average tariff reduction of 36 percent.[44] The study found that expansion of the TRQ may have limited impact in many cases, because it was observed that TRQs were not binding (that is not filled). Even lowering in-quota tariffs in this case, while leading to some increased access and TRQ fill rates, has a minimal effect on global markets as TRQs are not generally large in relation to overall market size.
For this current study, quantitative work was undertaken to illustrate more completely the range of issues and possible impacts of the Special Products and Sensitive Products clauses on outcomes of market access negotiations. The Agricultural Trade Policy Simulation (ATPSM) model was used to analyse specific scenarios to get a clearer understanding of these potential impacts, compared to a base of no change to tariffs or TRQs. This model is described in the annex. The model’s strengths are mainly its detailed coverage of countries and products, its calculations of welfare change, which includes TRQ rents and government revenues, and its overall simplicity. It also includes dairy production quotas where these are in effect. However, the model assumes the TRQs are always binding, and while this may be a limitation, it may be appropriate for small TRQ changes.
Three basic scenarios were analysed. In all scenarios, the market access elements of the EU’s 28 October 2005 WTO proposal have been used, as this is one proposal that includes detail on the mapping of tariff reduction deviation to a required TRQ expansion. The scenarios undertaken are as follows:
Scenario 1: Tariff formula reduction as in Table 2 has been implemented without any exemption or tariff reduction deviation. Tariff reduction has been implemented for all commodities in the model, in order to take account of inter-relations with other commodities, and to provide a reference comparison for the importance of the dairy sector relative to other sectors.Scenario 2: Tariff formula reduction as in Table 2 has been implemented except that all developing countries designate dairy products as Special Products and are exempted from reducing dairy product tariffs.
Scenario 3: Tariff formula reduction as in Table 2 has been implemented, but all dairy products are assumed to be designated as Sensitive Products for Canada, EU, Japan, United States, Norway and Switzerland. For these countries, following the EU proposal, required tariff reductions from base tariff rates (ad valorem), have been assumed to be one third of the reduction required by the tariff formula; the resulting difference is the tariff deviation. Base TRQs for dairy products have been increased according to the formula proposed by the EU[45] (and following variable definitions discussed above):
|
I* = [1+(TRD)/(1+To)*0.8]*Io |
(3) |
In this formula, TRD is the difference between the reduction required by the formula and the reduction chosen for the sensitive product. I* is the prescribed TRQ for the TRD chosen. This formula is a critical one, and some explanation is in order, in the light of the discussion above on the economic relationships of tariff reduction to increases in excess demand. The logic of expression (3) is to use the tariff deviation in percent of the base original tariff, as the basis for expansion of current TRQ (or of imports). This logic would appear to suggest that an equitable increase in market access of a one percent change in import price (tariff included) would be a one percent change in the TRQ. The EU proposal suggests a 0.8 factor also be used in this formula to make TRQ expansion less aggressive in expanding market access than the tariff deviation would imply. As an example of this formula, assume that the existing TRQ is binding, with a tariff of, say 90 percent. Following the tariff reduction schedule in Table 2, the required tariff reduction is 60 percent. The maximum sensitive product deviation is 40 percent, implying a tariff reduction of only 20 percent. With the proposed formula in (3), the prescribed TRQ increase, for a tariff deviation of 40 percent would be 18 percent. Given the discussion of the previous section, this could be a conservative estimate of an "equitable" increase in market access for a tariff deviation of this size; that discussion indicated that full equivalence could suggest an increase in imports by about 170 percent.
The set of countries that are assumed to declare Sensitive Products, except the United States, have production quotas in place. For these countries, quota levels are exogenously adjusted downwards by the magnitude of the increase in the TRQ. If imports of butter are to increase by ten thousand tonnes, for example, production is reduced by a similar amount. In reality a production quota may be applied to milk rather than the processed product, but milk is not in the model as it is a non-traded good. In this sense we ignore possible substitution on the supply side between powder, butter and cheese.
Empirical results
Tables 3 to 5 provide an overview of the estimated world price, welfare and production effects of each scenario respectively.
The formula tariff reduction scenario, without exemptions, leads as expected to the largest price impacts and welfare gains, compared to a no tariff change situation. World market prices for dairy products rise from 8 percent to 12 percent with butter prices rising the most. Global welfare gains due to dairy products amount to US$855 million (2001 dollars).[46] Developed countries gain as a group, largely due to increased consumer surplus for milk products which is larger than losses by producers. Many former transition countries which are net importers of milk products lose welfare in this scenario. Developing countries and least developed countries which are net importers of dairy products, also lose welfare as a result of higher prices. The major beneficiaries in this scenario and in all scenarios are Australia, Canada, Japan, New Zealand and the European Union. For Canada, Japan and the EU, welfare gains are due to increased imports and lower prices. The United States, whose dairy tariffs are lowest, predominantly exports concentrated products and imports butter and cheese. However, it is also a significant exporter of cheese, and domestic producers and consumers are affected as much by the rising tide of world prices as by changes in tariffs. US cheese consumers are made worse off by marginally rising prices and the net welfare loss in this sector is US$21 million. However, the United States gains overall from dairy reform. This illustrates that with two way trade in dairy products, a detailed analysis is important.
TABLE 3
Estimated world price impacts
| |
Scenario 1: |
Scenario 2: |
Scenario 3: |
| |
% change |
||
|
Butter |
12.3 |
9.4 |
3.5 |
|
Cheese |
7.2 |
6.7 |
5.6 |
|
Concentrated milk products |
8.5 |
7.9 |
3.8 |
Source: ATPSM simulations
For Scenario 2, the results demonstrate that even exempting all developing countries from tariff reduction has only a minimal effect. Welfare is reduced compared to Scenario 1, as those tariffs which remain support higher domestic prices in developing countries. This is due largely to high tariff overhang for dairy products in most of these countries, and to low or zero tariffs in others. It can broadly be concluded that Special Products designation, which may be of interest to some individual countries, would not have a significant impact on dairy markets. However, it should be clear that some major net exporters such as New Zealand, Australia and Argentina, lose welfare due to reduced access to developing country markets.
In Scenario 3, the triggered expansion of import quotas does not compensate for the trade off with tariff deviation from the formula. In this scenario, estimated world price changes are cut by more than half as are global welfare gains. The difference in effect is driven by the consumption effect of tariff reductions. Those countries that undertake the tariff deviation lose most compared with Scenario 2, largely because increased welfare due to increases in lower priced imports is forgone and replaced in Scenario 3 by much less of an increase in TRQ imports. Hence it can be concluded that in the case of dairy products, proposals which designate Sensitive Products may severely limit the gains to liberalization contained in a given tariff reduction formula. Of course, much depends on the trade-off mapping of tariff deviations from the formula to increases in TRQs. In this sense it would be useful to explore other mappings for which the trade off is more "equitable" than the one used in Scenario 3.
TABLE 4
Estimated welfare impacts (change from
base)
| |
Scenario 1: Full tariff reduction |
Scenario 2: Special Products |
Scenario 3: Special and Sensitive Products |
| |
$US Million (2001 basis) |
||
|
World |
855 |
846 |
446 |
|
Developed |
1381 |
1390 |
642 |
|
Australia |
85 |
74 |
35 |
|
Canada |
373 |
376 |
344 |
|
European Union |
468 |
480 |
157 |
|
Japan |
372 |
381 |
118 |
|
New Zealand |
123 |
98 |
53 |
|
Russia |
-46 |
-43 |
-22 |
|
United States |
1 |
-14 |
37 |
|
Ukraine |
-38 |
-40 |
-17 |
|
Developing |
-460 |
-482 |
-167 |
|
Algeria |
-43 |
-39 |
-18 |
|
Argentina |
28 |
26 |
11 |
|
Brazil |
-25 |
-23 |
-11 |
|
India |
0 |
8 |
14 |
|
Malaysia |
-26 |
-24 |
-11 |
|
Mexico |
-54 |
-66 |
-15 |
|
Nigeria |
-18 |
-17 |
-8 |
|
Pakistan |
3 |
2 |
0 |
|
Saudi Arabia |
-25 |
-23 |
-11 |
|
Least Developed |
-66 |
-62 |
-29 |
Source: ATPSM simulations
TABLE 5
Estimated production impacts (% change from
base)
| |
Scenario 1: Full tariff reduction |
Scenario 2: Special Products |
Scenario 3: Special and Sensitive Products |
| |
% change from base |
||
|
World |
0.6 |
0.5 |
0.1 |
|
Developed |
0.2 |
0.0 |
0.0 |
|
Australia |
5.3 |
4.2 |
2.1 |
|
Canada |
0.0 |
0.0 |
-0.6 |
|
European Union |
0.0 |
0.0 |
-0.4 |
|
Japan |
-4.6 |
-3.9 |
-0.8 |
|
New Zealand |
2.1 |
1.3 |
0.8 |
|
Russia |
3.2 |
2.6 |
1.3 |
|
United States |
0.0 |
-0.6 |
0.3 |
|
Ukraine |
2.8 |
2.2 |
1.1 |
|
Developing |
1.2 |
1.3 |
0.3 |
|
Algeria |
1.9 |
1.6 |
0.7 |
|
Argentina |
2.9 |
2.5 |
1.1 |
|
Brazil |
2.9 |
2.3 |
1.3 |
|
India |
0.2 |
0.4 |
-0.1 |
|
Malaysia |
0.8 |
0.7 |
0.3 |
|
Mexico |
0.1 |
1.3 |
-0.7 |
|
Nigeria |
0.9 |
0.7 |
0.4 |
|
Pakistan |
0.9 |
0.6 |
0.4 |
|
Saudi Arabia |
0.9 |
0.6 |
0.4 |
|
Least Developed |
1.0 |
0.8 |
0.4 |
Source: ATPSM simulations.
It is important to note that developing countries as a group are actually better off with the Sensitive Product clause for dairy products. For net importers, the smaller increase in import prices with the Sensitive Product clause means that while consumers lose less and producers gain less than reform without Sensitive Products, the net loss is lower. However, it is estimated that with the Sensitive Product clause producers remain better off in many key developing countries with reform.
Table 5 indicates the size of production gains in important dairy producing/consuming countries. The Sensitive Product clause substantially reduces production gains in low cost developed and developing exporting countries.
The global dairy sector is one of the fastest growing agricultural sectors. With growing populations, and incomes, and with large discrepancies in per caput consumption world wide, the prospects for increased trade are good. However, reform of domestic and trade policies has been difficult and slow. This has been particularly true in most developed countries. High tariffs negotiated during the Uruguay Round have enabled most policies to persist behind tariff walls. In negotiating general tariff formulae, high tariffs, such as those for dairy products, limit the depth of cut for all commodities. In this setting, the concepts of both Special Products and Sensitive Products offer alternative means for the liberalization process for these chosen products. In the case of Special Products, under which developing countries may exempt products for specific reasons, this study finds that whether dairy products are exempted or not would not have a large impact on markets. On the other hand, the Sensitive Products clause may considerably affect the degree of market access, depending on the size of tariff deviation permitted, and on the degree to which TRQ are increased to compensate.
As specified in the EU proposal, of 28 October 2005, the treatment of Special Products would indicate that required TRQ increases fall well short of compensating for deviation from the tariff formula. Combined with a maximum permitted tariff deviation of two thirds, this fact means that effective reform in dairy is severely limited. Finally for the case of the dairy sector, it is shown that developing countries as a group may be indifferent to Sensitive Products as they may appear to lose less welfare from such reform.
This empirical investigation of the implications of Special Products and Sensitive Products, as applied to the dairy sector, should be viewed as illustrative. More research would be useful. For example, alternative tariff reduction-TRQ mappings could be examined, as well as how these might be implemented. In the limit, it might be expected that market access liberalization via TRQ expansion should converge on similar market outcomes as tariff elimination, but the process of getting there may not be so clear. As in the current analysis, if TRQs are over-filled, expanding the quota at the margin will merely induce rent shifting from domestic consumers to foreign exporters. However, as quota is expanded further, at some point it will no longer by binding, and domestic prices may fall to a level determined by the in-quota tariff.
Finally, research is necessary on an individual country basis to determine more precise implementation aspects and consequent impacts. Dairy policies are too varied, too pervasive, and with such aspects as production quotas, tariff water and domestic price determining policies, more in-depth examination by country would provide more refined implementation of the proposals, and precise estimation of impacts.
Aksoy, M. & Beghin, J. 2004. Global Agricultural Trade and Developing Countries. The World Bank, Washington.
De Gorter, H. et al. 2004. Market Access: Economics and the Effects of Policy Instruments, in M. Ingco and J. Nash (eds.) Agriculture and the WTP: Creating a Trading System for Development. World Bank/Oxford University Press, Washington.
FAO. 2005. Dairy: measuring the impact of reform, Technical Note 11. FAO, Rome.
FAO. 2005. Dairy and dairy products: why is reform so difficult? Trade Policy Brief No. 11.
OECD. 2002. Tariff-Rate Quotas and Tariffs in OECD Agricultural Markets: A Forward Looking Analysis. OECD, Paris.
OECD-FAO. 2005. Agricultural Outlook: 2005-2014. OECD/FAO, Paris/Rome.
Rude, J. & Mielke, K. 2005. Implications of the July 2004 WTO Framework Agreement for Canadian Agriculture, CATPRN Commissioned Paper CP 2005-2 (www.catrade.org).
Sebastien, J., Lebourde, D. & Martin, W. 2005. Sensitive Products: Selection and Implications for Agricultural Trade Negotiations. Mimeo.
WTO. 2005. Tariff Quota Fill, document TN/AG/S/20. WTO, Geneva.
THE ATPSM MODEL
The Agricultural Trade Policy Simulation Model (ATPSM) is a comparative static partial equilibrium global trade model with the following features:
1. A simultaneous equation system for all countries specifying production, consumption, exports and imports that respond to domestic price changes, given a policy changes, complete price transmission and perfectly competitive markets.
2. Tariff rate quotas and quota rents.
3. Distinction between bound and applied tariff rates.
4. Stocks remain unchanged.
The standard equation system for all countries has four equations:
|
(1) |
|
|
(2) |
|
|
(3) |
DXi,r = gi,r DSi,r; |
|
(4) |
|
where D, S, X, and M denote demand, supply, exports and imports respectively;^ denotes relative changes and D absolute changes;
Pw denotes world price;
tc denotes the domestic consumption tariff and tp denotes the domestic production tariff;
e denotes supply elasticity, h denotes demand elasticity, and g denotes the initial ratio of exports to production;
i and j are commodities indexes; and
r is a country index.
For this application the standard version of ATPSM has been modified to include the following features:
(i) A land constraint that redistributes unused acreage. The production of wheat, barley, rice, maize and sorghum in each country is raised or lowered by the average change in production multiplied by the ratio of land to other primary factors. This assumes a tonne of each crop in a country uses the some amount of land. Total production of crop may fall or rise depending on the contribution of land compared with capital and labour.(ii) Production quotas and quota rents. Production quotas are specified for EU raw sugar and dairy products, United States tobacco, Canadian dairy and poultry and Japanese rice and dairy. These quotas are assumed to be binding unless the market price falls below the shadow price. Producers then respond according to the specified supply elasticity. Quota rent contributes to producer surplus.
(iii) A producer response to changes in quota rents on exports. Here there is no shadow price specified. Producers respond immediately to any change in rent. This implies the supply curve goes through the point at which quantity and price are observed. This permits trade diversion when quota rents change as a result of MFN reductions.
(iv) An enlarged European Union with 25 members.
(v) A revised determination of export or imports so that the largest trade flow is a residual. That is, for net exporters imports are a constant function of consumption and the change in exports is determined by changes in consumption, production and imports.
(vi) Revision of domestic support data to include amber box payments for the major users. The difficulty here is the extent to which amber box payments are conflated with border measures, implying that if tariffs are removed, the additional effect of reducing support is minimal.
ATPSM Commodities
|
Livestock |
Coffee, processed |
|
Bovine meat |
Cocoa beans |
|
Sheep meat |
Cocoa, processed |
|
Pigmeat |
Tobacco leaves |
|
Poultry |
Tobacco, proc. |
|
Milk, concentrated |
Oilseeds, temp. |
|
Butter |
Oilseeds, trop. |
|
Cheese |
Vegetable oils |
|
Hides & skins |
Pulses |
|
Wheat |
Tomatoes |
|
Rice |
Roots & tubers |
|
Barley |
Apples |
|
Maize |
Citrus fruits |
|
Sorghum |
Bananas |
|
Sugar, raw |
Other tropical fruits |
|
Sugar, refined |
Tea |
|
Coffee, green |
Rubber |
|
|
Cotton |
|
[29] Merritt Cluff is Senior
Commodity Specialist in the Basic Foodstuffs Service, Commodities and Trade
Division, Food and Agriculture Organisation of the United Nations. David
Vanzetti is Visiting Fellow at the Asia Pacific School of Economics and
Government, Australian National University. The authors would like to thank
Barbara Senfter for research assistance. [30] See OECD-FAO World Agricultural Outlook: 2005-2014 [31] See FAO Brief 11, "Dairy and Dairy Products: Why is reform so difficult?" [32] For example, the NAFTA (1994) deferred dairy tariffs to the WTO level for negotiation. [33] This paper will make regular reference to terms "tariff water", and "tariff overhang". Tariff water is defined as the difference between the applied tariff rate, and the tariff equivalence of market price support. Tariff overhang is defined as the difference between WTO scheduled bound tariffs and current applied tariffs. [34] "Making Hong Kong a Success: Europe’s Contribution", Brussels, 28 October, 2005. [35] The tariff data used are from the Agricultural Trade Policy Simulation Model database, and refer to the average out-of-quota, or average single MFN tariff for each country as appropriate where there is no quota, for these aggregated products. Single tariff line data can be expected to show higher variation. [36] Data and projections are drawn from the OECD-FAO Agricultural Outlook: 2005-2014. Calculations presented for tariff water are approximate, and are based on a common world market reference price, and internal wholesale product prices in each country. Tariffs used are from the AMAD database, found at www.AMAD.org. [37] For example, tariff rate quotas themselves illustrate special treatment. Most regional agreements also contain products or sectors that are exempt from action, or are treated differentially from other products. [38] Reference has often referred to dairy as among the "white" commodities, such as rice, cotton, and (white) sugar for which globally higher protection/support has been observed than for other commodities. [39] Refer to pp 79-81 in de Gorter et al. (2004), for a more complete discussion. In fact this treatment is grossly simplified for many reasons, including inter alia, how the analysis is affected by tariff water/overhang, and additionally by production quotas and how they might be adjusted to changed market access. [40] For large changes in price, the supply and demand elasticities may not be constant. The formula in that case is more complicated, and one would need to use the explicit supply and demand functions to derive the excess demand elasticity. [41] This calculation assumes that domestic price is equal to 1.9* world price, so a 40 percent deviation in the tariff would be reduce domestic price 19 percent less than the full tariff reduction implied by the formula. Hence 1.19 times an excess demand elasticity of 0.9 is 171 percent. [42] Refer to FAO Trade Brief "Dairy and dairy products: why is reform so difficult?", or its companion technical note "Dairy: Measuring the impact of reform". These sources outline other various factors, such as joint production of fats and protein products, various policy rents, diverse marketing systems etc., that render determination of economic criteria very difficult. [43] See J. Sebastien et al. (2005) [44] OECD (2002) "Tariff rate quotas and tariffs in OECD agricultural markets: A forward looking analysis", Paris. [45] The EU proposal introduces ranges of expansion for TRQs, based on this formula. For purposes of undertaking the scenario, this formula was used. In the formula tariffs are expressed as fractions, so a 20 percent tariff is 0.2. Likewise, a cut in the specified tariff reduction from 60 to 20 per cent generates a tariff difference of 0.4, the numerator. For example, (0.8-0.4)/(1+0.9)*0.8=0.17, prescribing a 17 percent increase in TRQ. [46] While not a focus of this paper, but noted for comparison purposes, the global welfare gain due to this market access proposal for all 35 commodities is $US 12.3 billion. The model excludes wool, silk, processed tobacco and several other commodities covered under the Agreement on Agriculture. |
![]()
![]()
![]()