![]()
![]()
![]()
Piero Conforti and George Rapsomanikis[47]
Radical changes in the Common Market Organization for sugar have recently been agreed by the EU agricultural ministers. These will interact with preferential trade initiatives and with the need to comply with the outcome of the trade dispute on export subsidies. Apart from EU sugar producers, the reform will affect developing countries and least developed countries that depend on the preferential treatment they enjoy for sugar exports to the EU. This paper focuses on the impact of the EU sugar policy reform and the Everything But Arms initiative on the African, Caribbean and Pacific countries, the least developed countries and the European Union. We develop an empirical model structure comprising a partial equilibrium model for the sugar market and a gravity model to replicate least developed countries’ bilateral trade with Europe. Domestic support and other policy instruments are included in the partial equilibrium model, whilst gravity is used to model the abolition of import tariffs for sugar originating in least developed countries subject to trade costs. Results suggest that sugar production in the European Union will contract, leading to a significant decrease in unsubsidised exports. African, Caribbean and Pacific countries will experience significant reduction in their export revenue, whilst the initial impact on least developed countries may be limited, but increasing in the medium run.
Preferential trade agreements are thought of as an important instrument for integrating the developing (DCs) and least developed countries (LDCs) into the world trading system. Nevertheless, the relationship between tariff barriers and growth is ambiguous (Rodriguez and Rodrik, 1999). In general, standard economic models focusing on a small-open price-taking economy with exogenous technical change postulate that lower trade restrictions may not have any impact on the long run growth. New growth theory, the natural assumption of learning-by-doing and endogenous technical change support the hypothesis that lowering trade barriers and increasing market integration boost economic growth. Increased trade stimulates investment opportunities, increases exposure to competition and technological spill-overs resulting in non diminishing returns to production factors.
The Everything But Arms initiative (EBA) of the European Union (EU) and the African Growth and Opportunity Act of the United States consist of trade agreements that aim at increasing trade flows between developed countries and LDCs in order to stimulate growth. The EBA initiative came into effect in 2001, aiming at discriminating in favour of the LDCs by granting duty free access to imports of all products that originate in these countries with the exception of arms and munitions. Total access to the EU markets was immediate except for fresh bananas, rice and sugar. Imports of these commodities are subject to tariff rate quotas, with duty-free in-quota imports and a gradually reduced tariff for out-of-the-quota imports until 2009.[48]
In this paper, we develop an empirical model structure for the sugar sector to assess the impact of the EBA initiative on the ACP countries that enjoy preferential access in the EU market, the LDCs and the EU itself, in the context of the EU sugar policy reform. The model structure includes representations of the sugar sectors of several developed, developing and least developed countries and provides a means for modelling bilateral trade flows between the EU and LDCs, based on the notion of gravity.
The plan of the paper is the following. In section 2 we provide a review of the literature and outline the conceptual framework of the study. Section 3 outlines the empirical framework. Section 4 discusses simulation results and section 5 summarizes the main conclusions.
On average, the initial impact of EBA on LDCs total exports to the EU is small, whilst the limited export success is not uniform across countries due to a number of reasons. Firstly, rules that govern trade under the EBA, such as the rules of origin and cumulation, are regarded as relatively strict, resulting in under-utilisation of preferences (Brenton, 2003). These rules define specific requirements related to the transport of products that originate in LDCs, as well as the amount of value that has to be added to imports of LDCs from non LDCs in order to be treated as LDC-originating products. Such requirements increase trade costs and prevent the beneficiary countries, that may not have vertically integrated production structures, from sourcing internationally and taking advantage of the global production networks and low cost exporters. Secondly, EBA, in fact, extended duty free access to a small number of products, mainly agricultural, whilst access for the majority of products was complete under the Generalised System of Preferences (GSP) and the Cotonou Agreement. In addition, a number of LDCs are unable to take advantage of EBA due to the current composition of their exports, as products that are traditionally exported to the EU markets have been receiving duty-free access under other agreements. In spite of its initial limited success, EBA grants duty-free access to LDCs for an unlimited period, resulting in a reduction in the risk exporters and investors are exposed to, relatively to schemes that come under periodic review. Nevertheless, safeguard mechanisms, such as the temporary suspension of preferences due to increases in imports in the EU, may still discourage investment and increases in production capacity
A number of studies focused on the potential impact of EBA on both the EU, and the beneficiary countries’ sugar sectors. Among these, UNCTAD (2005) indicates that potential increases in sugar exports to the EU under the initiative are likely to be limited, due to the constraints arising from natural resource endowments and transport infrastructures, which are analysed in detail through country case studies. Among the sugar producers, Ethiopia, Tanzania and Burkina Faso, for which the EBA quota already accounts for a large share of sugar exports, may benefit significantly from the initiative. A similar conclusion is reached by Stevens and Kennan (2001), who suggest that total LDCs’ sugar exports may reach some 300 to 500 thousand tonnes on top of the EBA quota, once unlimited duty-free access is granted. However, an opposite view is expressed, for instance, by Witzke and Kuhn (2003), who calculate that LDCs’ sugar exports to the EU market may reach 2 million tonnes in 2011. However, van Berkum et al. (2005) results are more comparable to those of UNCTAD (2005) and Stevens and Kennan (2001). van Berkum et al. (2005) utilise a general equilibrium model and suggest that LDCs exports to the EU under the EBA initiative may reach 450 000 tonnes.
Although informative, studies on the impact of the EBA initiative do not adequately cover important issues that relate to international trade, in general, and the trade costs countries face. Firstly, relative productivities and differences in technology vary widely across countries and determine trade flows. Secondly, trade diminishes with distance, whilst infrastructure determines trade costs. Moreover, it is not only the natural trade barriers that determine trade costs and, therefore, flows. Import tariffs in the EU increase the cost of trade nearly twofold. Due to the magnitude of trade costs, few LDCs that are not subject to the Cotonou agreement between the EU and the African, Caribbean and Pacific countries (ACP) export sugar to the EU. Exports from Sudan, Mozambique and Ethiopia to the EU in 2003 amounted to about 42 thousand tonnes, or 10.6 percent of their total exports, whilst those originating from Burkina Faso, Chad, the Democratic Republic of the Congo, Mauritania, Somalia, the Niger and Sierra Leone amounted to 14 thousand tonnes. Apart from these countries, other LDCs do not export sugar to the EU. In assessing trade costs, Anderson and Wincoop (2003, 2004) distinguish between border and non-border barriers. The former refer to barriers that involve rents such as tariffs and quotas, whilst the latter relate to natural trade barriers such as distance, infrastructure transport and communication technologies. Natural trade costs, therefore, are constituted by freight costs, information costs, contract enforcement costs, costs related to the use of different currencies, inventory and holding costs and regulatory costs. Such costs may be prohibitive for LDCs.
In addition to the limited empirical evidence on the impact of the EBA initiative, there are few studies focusing on the impact of EU policy reform on the sugar sector. The EU Commission put forward proposals for reform that consist of a shift from production related support to decoupled payments. Apart from the study conducted by the Commission itself, a policy scenario analogous to the reform agreed by the Council of Ministers has been considered by Witzke and Kuhn (2003). The policy scenario includes a 38 percent reduction in the domestic support price of the EU, simulated and compared against a baseline stretching to 2011 that incorporates the effect of the EBA initiative and its impact on the ACP countries.[49] The baseline shows an increase in the world reference price, following the application of the EBA initiative, together with a reduction in the EU domestic production and a huge increase in imports from the LDCs, which would reach 2 million tonnes by the end of the baseline horizon. Against this background, the reduction of the EU domestic price leads to a further contraction of the over-quota domestic production, coupled with a small additional world price effect. The simulation suggests that major losses would arise for the EU sugar processing industry, especially in the countries producing within the A and B quotas.
The present study takes into consideration the types of trade costs that arise from both tariff and natural trade barriers in the context of EBA initiative and the EU sugar policy reform. More specifically the questions addressed by this research are: what would be the volume of LDC-sugar exports to the EU and how will policy reform affect EU producers, the LDCs and the ACP countries that currently export to the EU under the Cotonou agreement? These are the questions frequently asked by policy makers in the EU, ACP countries and LDCs and feature in the current discussions on policy reform, trade, the impact of the newly granted preferences and the erosion of the rent that accrues from the already established preferences.
The relationship between trade costs and trade flows is best represented by the notion of gravity that postulates that after controlling for size, trade between two countries depends on the magnitude of trade costs.[50] The rationale behind gravity is simple and intuitive: decreasing tariffs and decreasing transport costs lead to higher trade flows between two countries. Thus, the gravity model provides an environment in which the linkage between trade costs that arise due to tariff and natural trade barriers, and trade flows can be analysed. Recent years have experienced a surge in the use of the gravity model in analysing bilateral trade, the impact of regional trade agreements, as well as in estimating trade costs (for a review see Piermartini and Teh, 2005).
Bilateral trade flows can be modelled utilising less than infinite elasticity of substitution between domestically produced and imported goods, that is the Armington assumption, (as in van Berkum et al.), or spatial equilibrium models (as in Takayama and Judge, 1971). We analyse the impact of the EBA initiative and of the policy reform on the LDCs by utilising an empirical model structure comprising a global partial equilibrium model for the sugar market and a gravity model to replicate LDCs’ bilateral trade with Europe. The sugar partial equilibrium model is a standard non-spatial model with rich policy specification, where the sugar market clears by equalising world exports and imports and where no bilateral flows are determined. The gravity model is used to quantify the maximum potential export flows from LDCs to the EU under the EBA initiative on the basis of both tariff and natural barriers. LDCs’ sugar exports to the EU receive the EU price and in turn have an influence on the domestic price in the exporting LDCs, thus affecting the incentive to produce sugar. Therefore, the model structure takes into account the opposing forces of comparative advantage that enhance trade between countries and those of trade costs that hamper it.
3.1 The Sugar Partial Equilibrium Model
The simulation exercise is based on the COSIMO-AGLINK sugar model, a partial equilibrium recursive dynamic model for the sugar market developed by the Organisation for Economic Co-operation and Development (OECD) and the Food and Agriculture Organization of the United Nations (FAO). A full description of the AGLINK model is available in OECD (2004). COSIMO-AGLINK is an extension of the AGLINK model of the OECD, conducted by the FAO, covering, in addition to OECD Member States and main developing producing countries, 22 ACP countries and LDCs. The model also includes functions for LDCs bilateral exports to the EU based on gravity equations described in the next section. COSIMO-AGLINK contains 782 equations and identities and covers a total of 56 countries and regions,[51] allowing two types of traded sugars, refined and raw sugar, and two sugar inputs, cane and beet.[52] The model is calibrated on the year 2003 and is utilised to generate a set of solutions up to 2013, based on the values of the previous period’s endogenous variables, a set of exogenous assumptions concerning the evolution of GDP, population, consumer price indexes, and exchange rates reported in OECD and FAO (2005), as well as on a number of exogenous policy variables. Both trade and domestic policies are included explicitly in most of the countries. World and domestic prices are determined endogenously by clearing the world market, as well as domestic markets of countries, such as the EU 25, Mexico, the United States and China, which are insulated in terms of world market price effects
In more detail, the model includes single equation representations of demand and supply. On the supply side, cane and beet area harvested functions include own prices and those of few competing crops, such as rice, maize, coarse grains and soybeans. Cane and beet production is estimated on the basis of areas harvested and yields, which are determined by prices and technical change. The processing sector is not included explicitly and the conversion from raw to refined sugar is approximated through a fixed rate. On the demand side, both human consumption and stocks are considered. The former is specified as a function of GDP per capita and the price of refined sugar, in real terms. For countries in which important substitutes exist, the model includes a share equation that splits demand across the sweeteners. The form of the stock functions depends on the implementation, or not, of a stockholding policy. Trade, either imports or exports, is taken as the residual variable in all countries that are directly affected by the world price and is employed to determine the world equilibrium prices, using the null sum of net trade as closure rule.
In the ACP countries, the marginal economic incentive is calculated as a weighted pool (or blend) price of the price received for sugar exported under the Sugar Protocol (SP) and the Special Preferential Sugar (SPS), the price received for exports within the US tariff rate quota (TRQ) and of the world price for production exported to the world market. Thus, ACP countries are modelled as price-takers, with an imperfect transmission of world price signals. For those ACP countries which are also classified as LDCs, where the EBA initiative implies a TRQ that increases by 15 percent per year between 2002 and 2008 and duty free unlimited access after year 2009, the price determination described above is applied until 2008 on the basis of the corresponding EBA TRQ. From 2009 onwards, it is assumed that ACP LDCs will be capable of exporting exclusively to the EU, thus being exposed to the EU reference price.
The gravity equation is employed to determine the maximum amount of exports of the individual LDCs to the EU, on the basis of tariff and natural trade barriers. Transport costs determined by infrastructure, in general, may restrict these countries’ ability to export to the EU in spite of the progressive reduction in import tariffs and the gradual increase in the EBA TRQ starting from 2005. In a similar manner, from 2009 onwards when sugar LDCs exports can enter the EU duty-free, the gravity equation will determine export flows to the EU.
The modelling of the EU domestic market is largely based on AGLINK (OECD, 2004). Econometric evidence indicates that supply is responding to different price levels in the different countries, depending on the cost structure, on the volume of production compared to the A and B quotas, and on the specific institutional arrangements in place. In particular:
French, German and Polish producers are assumed to respond to the world price, since over quota production is large enough to cover the country’s quotas even with low yields;
in Belgium, Ireland and in the United Kingdom only a small quantity of C-sugar is produced, therefore the relevant price for producers is a weighted average of the B quota price and the world market price;
in Denmark, Austria, Sweden, Spain, Czech Republic and in the Netherlands production responds to the B quota price;
in Italy, Finland, Greece and Portugal producers respond to the A quota price; and,
producers in Hungary and Slovakia respond to the internal EU-25 clearing price.
Production in the remaining six smaller new countries is fixed at their quota level. The total production quota is endogenously determined by the level of imports, stocks and consumption. On the demand side, human consumption is a function of income and prices and also takes into account the inuline and isoglucose quotas in most countries. Stock demand is modelled in conjunction with the intervention price mechanism and the carry-over of over-quota produced sugar. Stocks are negatively related to the difference between the market price and the intervention price and positively related to the carry-over. As far as trade policies are concerned, on the import side the SP and SPS quotas granted to the ACP countries and India are included in the model’s specification, together with the import quota for Finland’s accession, the quota for the accession of Slovenia and Latvia, and the import quota for the Balkans. On the export side, subsidized sales are determined in the model by the corresponding URAA expenditure limit,[53] while C-sugar is modelled as a function of the previous year’s exports and the change in the internal and world refined sugar prices. ACP re-exports are not accounted for in the EU WTO subsidized export limit equation.
3.2 The Gravity Model
Standard empirical gravity equations take the following form:
|
|
(1) |
where xij, yi and yj denote exports from country i to j, the GDP of the importer and of the exporter respectively. The k variables zij typically refer to policy tariff barriers, such as tariffs, and to natural trade barriers, such as distance between countries and infrastructure and eij is an error term. Empirical studies frequently utilize a number of proxies in order to capture natural trade barriers. Often, average distance between two countries is an observable variable representing transport costs, whilst abstract trade barriers, such as information costs and communication costs are represented by variables such as language differences. We apply the gravity model utilizing a panel data set for food and tobacco exports to the EU from 47 LDCs during the period 1988-2004. There are some clear advantages in applying gravity to panel data relative to cross section data typically used in such studies. Panel data allows the estimation of dynamic models and the investigation of the adjustment process. Adjustment to a new trade relationship with the EU, characterized by no tariff barriers after 2009, may be gradual and not instantaneous for LDCs that, without doubt, face significant adjustment costs not only in increasing production to take advantage of the preferences, but also in administering exports under the EBA initiative. Moreover, panel data allow more variation in the data used to estimate the relevant parameters in a consistent manner.
Data on the value of food and tobacco exports to the EU and the relevant weighted tariff levels is collected from COMTRADE. We use food and tobacco exports instead of sugar exports for two reasons. Firstly, the data on sugar exports is limited, as few LDCs exported sugar to the EU during the period 1988-2004. Secondly, as the EBA initiative allowed duty free imports in the EU since 2001 for all products except sugar, rice and bananas, the data on food and tobacco exports contains information on the impact of the initiative on trade. Data on infrastructure are collected from the World Development Indicators data set provided by the World Bank. Transport costs are collected in the form of Samuelson’s convenient ‘iceberg’ assumption, as the proportion of the value of exports that is dissipated in transportation. Data on the length of the paved and unpaved roads, the length of railways, the number of fixed telephone lines and mobile phones per thousand inhabitants is collected to represent information and communication costs. The empirical gravity model is as follows:
|
|
(2) |
where xie,t, yi,t and ye,t denote exports from country i to the EU in year t and the GDP of the exporting country and the EU respectively in the same year. The variable tarie,t denotes the level of the ad valorem tariff faced by the exporting country in time t, whilst the k variables zij refer to several variables relating to natural tariff barriers. eie,t is a error term, whilst hie is an unobserved country-specific and time-invariant effect that can be thought of as an additional determinant of exports on the basis of characteristics that are peculiar to each country. The lagged dependent variable and the lagged tariff terms capture the adjustment process to the new environment.
We estimate the gravity equation using the Generalised Method of Moments (GMM), a standard procedure for dynamic panel data models. GMM, developed by Hansen (1982) and extended for first-differenced dynamic panel models by Arellano and Bond (1991), provides of an asymptotically efficient estimator in this context.[54] The estimated parameters are presented in Table 1.
We experimented with different natural barrier variables, such as the length of paved roads and the number of telephone lines per thousand inhabitants. However, parameter estimates were not statistically significant for all available variables, mainly due to the lack of variation of the series, thus resulting in a parsimonious final specification that, in addition to the GDP ratio, included lagged tariff terms and a transport cost variable. The parameter estimates are statistically significant and highlight the importance of tariff barriers in determining trade flows in the medium run. Reductions in the tariff level are expected to increase significantly the flow of exports from the LDCs to the EU. The estimated parameters indicate that a 10 percent reduction in the tariff level will result in a 20 percent increase of exports to the EU in the long run. The estimated parameter for transport costs also confirms the importance of well functioning and efficient transport infrastructure.
We calibrate the model to sugar exports to the EU for year 2003 for the LDCs that have exported to the EU during the period 1988-2004.[55] These exports are subject to tariffs that are determined by the EBA in-quota and out-of-the-quota tariffs, the corresponding GDPs and transport costs.
TABLE 1
Dynamic gravity equation estimates
|
xie,t-1 |
tarie,t-1 |
tarie,t-2 |
|
|
|
0.3643 |
-0.0529 |
-0.0796 |
0.1283 |
-0.0859 |
|
(0.0052) |
(0.0096) |
(0.0068) |
(0.0472) |
(0.0156) |
|
J-Statistic |
51.26 |
|
|
|
|
Instrument rank |
55 |
|
|
|
|
Sargan test p-value |
0.42 |
|
|
|
|
Sample |
1990-2004 |
|
|
|
|
Number of observations |
539 |
|
|
|
* Standard errors in parenthesis
3.3 Simulation and results
We simulate a policy scenario based on the reform agreed by the European Union agricultural ministers in late November 2005. In brief, the reform consists of four main changes in the Common Market Organization (CMO):
(i) the abolition of the intervention mechanism and its substitution, in 2009/10, by a private storage scheme, to be triggered when the domestic price reaches the "reference price", an administered price to be gradually set to a level 36 percent lower than the current intervention price within four years, starting in 2008;(ii) the merging of the present A and B quotas and the establishment of an additional quota of one million tonnes which can be bought by producers in those countries which currently produce over-quota (the C-sugar producers); a progressive quota expansion is also envisaged for isoglucose;
(iii) a voluntary and temporary restructuring scheme, financed from the purchase of the additional quotas made available and aimed at assisting factories willing to cease production;
(iv) the establishment of national envelopes aimed at granting direct decoupled payments to farmers accounting for 64 percent of the estimated loss arising from the reduction in the price guarantee on the basis of 2001-02 as a reference period.
The model allows the simulation of two of these changes, (i) and (ii). In more detail, the abolition of intervention is modelled as a 36 percent reduction in the intervention price, assuming that private storage will support market prices in a similar way to the intervention mechanism. The merging of the two quotas and the provision of an additional one million tonnes quota to current C-sugar producers is approximated through an increase in the quota level for the relevant countries.[56]
The other two main provisions envisaged by the reform cannot be meaningfully simulated with the partial equilibrium model employed. Simulation of the impact of the restructuring scheme for processors would require not only a representation of the processing sector in the model, but also, the scheme being a voluntary policy, a differentiation among processing firms according to efficiency, in order to infer the extent of participation in the scheme. The direct payments to producers will be granted as a single fully decoupled payment established with the 2003 CAP reform for the Member States that opt to introduce decoupled payments. Thus, in the large majority of the EU, this payment will be granted without production requirements, as a pure fixed land-based transfer, which does not affect production decisions in the model.[57]
|
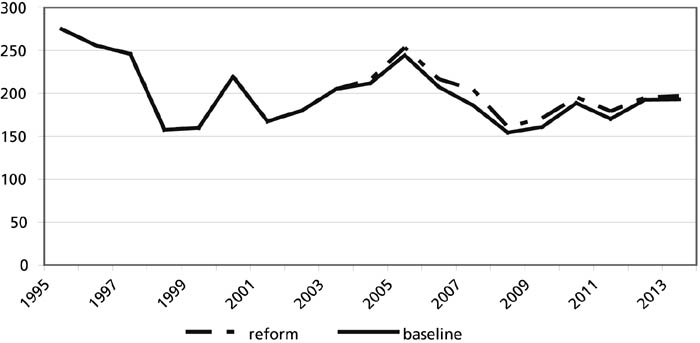
FIGURE 1
|
The results of the simulation exercise suggest that the reform of the EU sugar CMO has a significant impact in the European market and a relatively more limited impact on the rest of the world. The world reference price increases marginally, with other major producers being hardly affected, while in the EU, the reform brings about a substantial relocation of production across Member States, following a significant reduction in the market price. The price drop, in conjunction with the increase in the production quota, allows the EU to reduce the exportation of over-quota production (also termed as C-sugar) without building up stocks, hence complying with the recent ruling of the WTO panel on the cross-subsidization of C-sugar exports. Producers in less efficient regions in the EU are expected to be displaced by lower-cost producers, who will increase their market shares as the rents associated with the high support price and the quota are reduced. The reform is expected to affect the EU’s trade partners. The simulation exercise suggests that trade is diverted away from countries which currently enjoy preferential access to the EU market. Higher cost ACP producing countries that export within the Sugar Protocol are expected to be displaced by more efficient LDCs, some of which are also ACP and enjoy duty-free unlimited-quota access to the EU market under the EBA initiative.
In more detail, the reform of the EU sugar regime is simulated to result in an average 4 percent increase in the world reference prices for both raw and white sugar (Figure 1). The difference between the simulated and the baseline price is wider between 2007 and 2010, when the EU reform is fully implemented and before this gap is narrowed by a moderate growth in the exports of major producers, such as the Brazil, Thailand and the United States. According to the baseline, Brazil is projected to export about 26 million tonnes in 2013, whilst the simulation of the EU reform suggests that Brazil will export an additional amount of about 700 thousand tonnes in that year. India’s net trade position, which projects the country importing about 4 million tonnes in 2013, is only slightly improved by the EU domestic reform. Thailand is projected to export about 400 thousand tonnes more in the reform scenario, reaching 7.8 million tonnes in 2013.
|
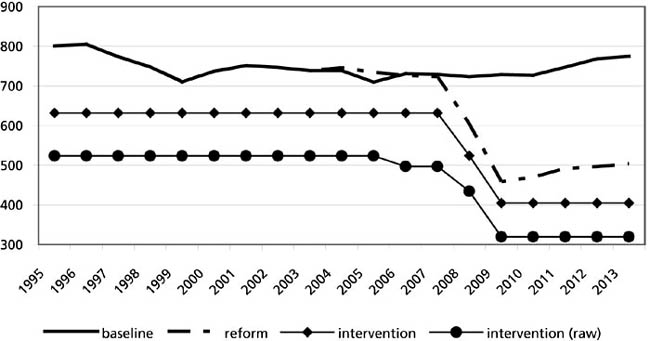
FIGURE 2
|
By contrast, the EU domestic market price falls by an average of about 32 percent between 2008 and 2013, slightly less than the reference price (Figure 2), as the transmission of changes from the latter to the former is partial with the market price being determined by other policy provisions and market forces.
EU total sugar beet production is expected to decrease by an average of 4 percent, due to the combination of the increase in the production quota and the decrease in the market price brought about by the reform. Among Member States (see Table 2), the simulation of the reform scenario suggests that production in France, Germany and Poland will not be affected by the decrease in the price policy; rather output may increase by about 1.7 and 1.6 percent in France and Germany respectively, and by 0.7 percent in Poland. Production would be reduced in virtually all other member states, and more significantly in Italy, the UK, Spain, and Belgium, Greece, Sweden, Denmark and the Czech Republic. Altogether there would be a reduction of more than 6.5 million tonnes of beet, as compared to the baseline. It is worth highlighting that such a reduction in production takes place against a baseline which already suggests a per se reduction in the EU output due to EBA initiative imports, of about 12 million tonnes in 2013.
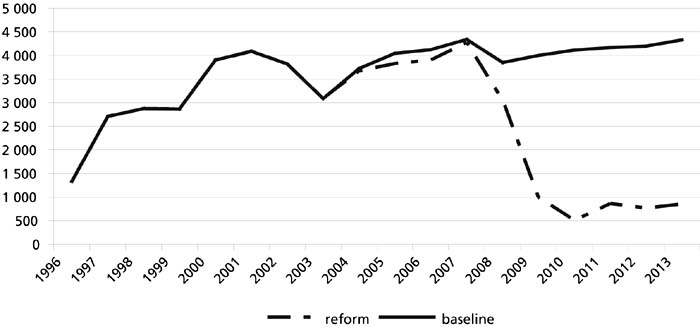
Policy reform results in an increase in the consumption of sugar by about 2 percent, consistent with the expected weak reaction of European consumers to lower prices. Given the relatively faster contraction in supply, the EU is expected to be capable of substantially reducing its C-sugar exports (see Figure 3), from little less than 4 million tonnes in 2006, to about half a million tonnes in 2010. This would allow the EU to comply with the WTO panel ruling on the cross-subsidization of C-sugar. Although the extent to which unsubsidized sugar exports will still be allowed beyond the quantitative limits imposed by the 1994 Uruguay Round Agreement on Agriculture (URAA) is not yet clear, policy reform results in a level of C-sugar exports that is significantly lower that that of the baseline, thus allowing easier management of the EU domestic sugar market.
TABLE 2
Sugarbeet production in the EU
| |
(000 tonnes) |
percentage shares |
||||||
| |
1995-97 |
2001-03 |
2011-13b |
2011-13s |
1995-97 |
2001-03 |
2011-13b |
2011-13s |
|
Total EU 25 |
141 166 |
128 243 |
115 629 |
109 137 |
100.0 |
100.0 |
100.0 |
100.0 |
|
EU 6* |
230 |
216 |
230 |
257 |
0.2 |
0.2 |
0.2 |
0.2 |
|
Austria |
3 010 |
2 953 |
2 979 |
2 586 |
2.1 |
2.3 |
2.6 |
2.4 |
|
Belgium |
6 240 |
5 803 |
5 920 |
5 220 |
4.4 |
4.5 |
5.1 |
4.8 |
|
Czech Republic |
3 916 |
3 528 |
3 313 |
2 905 |
2.8 |
2.8 |
2.9 |
2.7 |
|
Denmark |
3 187 |
3 228 |
3 010 |
2 513 |
2.3 |
2.5 |
2.6 |
2.3 |
|
Finland |
1 122 |
1 072 |
534 |
431 |
0.8 |
0.8 |
0.5 |
0.4 |
|
France |
32 051 |
29 869 |
28 215 |
28 324 |
22.7 |
23.3 |
24.4 |
26.0 |
|
Germany |
25 961 |
26 106 |
25 731 |
26 139 |
18.4 |
20.4 |
22.3 |
24.0 |
|
Greece |
2 520 |
2 598 |
2 554 |
2 008 |
1.8 |
2.0 |
2.2 |
1.8 |
|
Hungary |
4 189 |
2 335 |
1 459 |
903 |
3.0 |
1.8 |
1.3 |
0.8 |
|
Ireland |
1 436 |
1 404 |
1 300 |
1 182 |
1.0 |
1.1 |
1.1 |
1.1 |
|
Italy |
13 035 |
10 711 |
7 665 |
6 733 |
9.2 |
8.4 |
6.6 |
6.2 |
|
Netherlands |
6 490 |
6 199 |
5 613 |
5 189 |
4.6 |
4.8 |
4.9 |
4.8 |
|
Poland |
15 680 |
11 899 |
8 706 |
8 971 |
11.1 |
9.3 |
7.5 |
8.2 |
|
Portugal |
80 |
465 |
492 |
377 |
0.1 |
0.4 |
0.4 |
0.3 |
|
Slovakia |
1 526 |
1 291 |
1 573 |
1 104 |
1.1 |
1.0 |
1.4 |
1.0 |
|
Spain |
8 068 |
7 028 |
6 059 |
5 350 |
5.7 |
5.5 |
5.2 |
4.9 |
|
Sweden |
2 446 |
2 663 |
2 410 |
1 893 |
1.7 |
2.1 |
2.1 |
1.7 |
|
United Kingdom |
9 978 |
8 874 |
7 863 |
7 052 |
7.1 |
6.9 |
6.8 |
6.5 |
Notes: 2011-13b denotes baseline, 2011-13s denotes reform
* EU 6 includes Malta, Cyprus, Slovenia, Estonia, Latvia and Lithuania
|
FIGURE 3
|
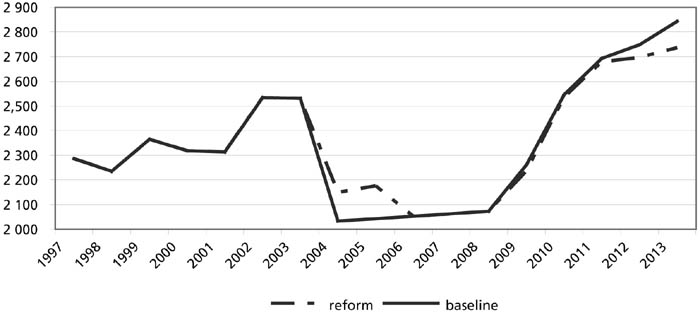
Total sugar imports in the EU are simulated to increase following the policy reform, albeit at a lower rate than that indicated by the baseline, particularly after 2009 (see Figure 4). In general, under both the baseline and the reform scenario, the EBA initiative results in an increase in imports by almost 700 thousand tonnes in three years. Towards the end of the simulation horizon, the effect of the EU reform causes imports to slow down due to the reduction in the price paid to ACP countries under the Sugar Protocol, and the price imports that originate in LDCs receive under the EBA initiative.
In addition to the impact on aggregate imports to the EU, policy reform is expected to alter their composition, as LDCs’ exports to the EU are diverted towards the EU due to the EBA initiative, whilst imports under the Sugar Protocol, in the case of high-cost ACP countries, exhibit a decrease. In more detail, three country groups can be identified among those enjoying preferential access to the EU market. Firstly, ACP developing countries, which currently enjoy preferential access under the SP and the SPS are expected to be affected by both the abolition of the SPS, as well as by the reduction in the EU price. The latter will have a significant impact on high cost producers, such as Barbados, where both total exports and exports to the EU are falling dramatically (see Table 3), whilst the elimination of SPS will affect ACP low-cost producing countries such as Trinidad, Swaziland, Mauritius, Jamaica, Guyana, Fiji and the Cote d’Ivoire.
|
FIGURE 4
|
Secondly, for least developed ACP countries that export to the EU under the SP and SPS, the EBA initiative leads to unlimited duty-free access to the EU market. Malawi and Tanzania are simulated to increase their exports to the EU significantly. Trade costs are assumed not to pose significant barriers to exports, as these countries have been exporting to the EU for long period of time.
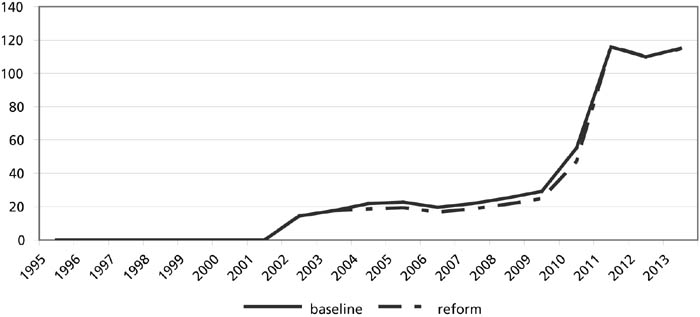
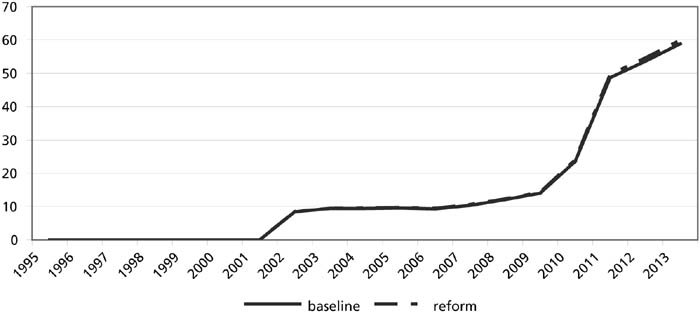
Finally, a third group comprises those LDCs which are not SP and SPS signatories and, therefore, will obtain significant benefits from the EBA initiative. Some of these LDCs are important sugar producers, such as Ethiopia, Mozambique and Sudan. Exports from Ethiopia to the EU (see Figure 5) are simulated to reach 113 thousand tonnes by 2013, whilst those from Mozambique increase from 10 to 55 thousand tonnes during the same period. In a like manner Sudan is simulated to increase its exports to the EU about fivefold. EU policy reform is not expected to alter these export trends that are predominantly determined by the EBA initiative.
Other LDCs that are not significant sugar exporters, but have been exporting regularly small amounts of sugar to the EU in the recent years are Mali, Mauritania, Chad and Sierra Leone, that are included in the simulation as ‘other LDCs’, and Bangladesh. For these countries, the baseline indicates that exports may increase due to the EBA (Table 3), to a moderate level mainly due to the constraints imposed by transport costs, while the reform of the EU policy does not imply significant changes.
In total, sugar exports of the ACP countries to the EU are projected to increase to 1.7 million tonnes in 2011-13; while those of the LCDs would increase threefold, reaching 498 thousand tonnes. Export of the ACPs toward non-EU destinations are projected to decrease by some 15 percent in the same period, while those of the LDCs would be reduced by over 50 percent. For none of these items the reform of the EU regime only implies marginal changes.
Finally, it is worth considering the effect on the developing ACP countries that are signatories of the SP and SPS and the LDCs in terms of export revenues, given that significant changes take place both in terms of the price received and in the volumes traded. The EU sugar policy reform will without doubt worsen export revenues due to a reduction in the price these countries receive. However, for the LDCs, reform still leaves the group with a total export revenue that is almost 150 percent higher than that of the 2001-03 period. ACP countries-signatories to the SP would still gain as a group, but solely due to countries that are classified as Least Developed and will export to the EU under the EBA initiative. Other ACP countries will experience substantial losses, such as Barbados, Zimbabwe and Côte d’Ivoire. In the same vein, wide potential gains arise for some of the LDCs, particularly Sudan, Tanzania, Malawi, Zambia and the "other LDCs". The exceptional results of Ethiopia and Mozambique derive from their very low starting points, as it is also shown in Figures 5 and 6.
TABLE 3
Raw sugar exports of ACP countries and
LDCs
|
Destination |
EU under Sugar Protocol |
EU under SPS protocol, then EBA |
Rest of the World |
Total |
|||||||||||||
| |
1995-97 |
2001-03 |
2011-13b |
2011-13s |
1995-97 |
2001-03 |
2011-13b |
2011-13s |
1995-97 |
2001-03 |
2011-13b |
2011-13s |
1995-97 |
2001-03 |
2011-13b |
2011-13s |
|
| |
Belize |
40.3 |
40.3 |
40.3 |
40.3 |
9.6 |
5.2 |
0.0 |
0.0 |
57.4 |
57.0 |
70.6 |
78.8 |
107.4 |
102.5 |
110.9 |
119.1 |
| |
Trinidad and Tobago |
45.7 |
45.7 |
45.0 |
45.7 |
10.4 |
5.5 |
0.0 |
0.0 |
3.4 |
0.6 |
0.0 |
0.0 |
59.5 |
51.7 |
45.0 |
45.7 |
| |
Swaziland |
123.0 |
123.0 |
123.0 |
123.0 |
56.8 |
32.4 |
0.0 |
0.0 |
215.4 |
282.9 |
353.0 |
434.7 |
395.1 |
438.3 |
476.0 |
557.7 |
| |
Mauritius |
512.4 |
512.4 |
493.5 |
499.7 |
39.2 |
27.0 |
0.0 |
0.0 |
76.0 |
22.2 |
0.0 |
0.0 |
627.6 |
561.6 |
493.5 |
499.7 |
| |
Jamaica |
123.9 |
123.9 |
123.9 |
123.9 |
28.5 |
17.4 |
0.0 |
0.0 |
21.0 |
0.0 |
21.1 |
12.6 |
173.3 |
141.3 |
145.0 |
136.5 |
| |
Guyana |
166.3 |
166.3 |
166.3 |
166.3 |
37.3 |
17.8 |
0.0 |
0.0 |
39.8 |
114.9 |
130.9 |
120.3 |
243.4 |
299.0 |
297.2 |
286.6 |
| |
Fiji |
172.5 |
172.5 |
172.5 |
172.5 |
35.1 |
19.3 |
- |
- |
153.1 |
83.0 |
84.1 |
76.4 |
360.8 |
274.9 |
256.6 |
248.9 |
| |
Dominincan Rep. |
- |
- |
- |
- |
- |
- |
- |
- |
314.8 |
173.5 |
183.5 |
121.8 |
314.8 |
173.5 |
183.5 |
121.8 |
| |
Ivory Coast |
10.6 |
10.6 |
10.6 |
10.6 |
12.0 |
9.1 |
- |
- |
26.5 |
42.0 |
33.5 |
30.7 |
49.1 |
61.8 |
44.2 |
41.3 |
| |
Barbados |
52.5 |
41.3 |
6.1 |
5.4 |
2.4 |
- |
- |
- |
0.1 |
- |
- |
- |
55.0 |
41.3 |
6.1 |
5.4 |
| |
Kenya |
- |
- |
- |
- |
- |
4.1 |
- |
- |
0.0 |
- |
0.3 |
0.3 |
0.0 |
4.1 |
0.3 |
0.3 |
| |
Zimbabwe |
31.5 |
31.5 |
31.5 |
31.5 |
32.4 |
23.4 |
- |
- |
113.4 |
69.7 |
56.8 |
56.4 |
177.3 |
124.6 |
88.4 |
87.9 |
| |
Mozambique# |
- |
- |
- |
- |
- |
0.8 |
53.7 |
54.7 |
73.8 |
107.5 |
93.6 |
92.7 |
73.8 |
108.3 |
147.4 |
147.4 |
| |
Ethiopia# |
- |
- |
- |
- |
- |
15.0 |
113.6 |
113.6 |
43.7 |
74.2 |
- |
- |
43.7 |
89.2 |
113.6 |
113.6 |
| |
Burkina Faso# |
- |
- |
- |
- |
- |
0.7 |
1.7 |
1.7 |
- |
11.8 |
- |
- |
- |
12.6 |
1.7 |
1.7 |
| |
Tanzania* |
3.1 |
10.6 |
10.6 |
10.6 |
1.5 |
2.2 |
39.6 |
39.6 |
0.0 |
7.1 |
- |
- |
4.6 |
19.9 |
50.2 |
50.2 |
| |
Sudan# |
- |
- |
- |
- |
- |
18.4 |
97.8 |
93.6 |
81.5 |
223.3 |
118.5 |
125.7 |
81.5 |
241.7 |
216.3 |
219.3 |
| |
Malawi* |
21.7 |
21.7 |
21.7 |
21.7 |
13.9 |
9.3 |
88.7 |
83.0 |
23.4 |
58.8 |
- |
- |
59.0 |
89.8 |
110.4 |
104.7 |
| |
Zambia* |
- |
- |
- |
- |
11.6 |
12.0 |
39.7 |
43.7 |
- |
27.2 |
- |
- |
11.6 |
39.2 |
39.7 |
43.7 |
| |
Madagascar* |
11.2 |
11.2 |
- |
- |
12.2 |
9.9 |
20.8 |
27.0 |
0.0 |
0.0 |
- |
0.2 |
23.4 |
21.1 |
20.8 |
27.2 |
|
Total ACPs |
1,314.8 |
1,311.2 |
1,245.2 |
1,251.3 |
302.9 |
229.6 |
455.6 |
456.9 |
1,243.1 |
1,355.8 |
1,146.0 |
1,150.6 |
2,860.8 |
2,896.5 |
2,846.8 |
2,858.8 |
|
| |
Bangladesh |
- |
- |
- |
- |
- |
- |
2.3 |
2.3 |
- |
31.0 |
12.8 |
12.8 |
- |
31.0 |
15.0 |
15.0 |
| |
Other LDCs |
- |
- |
- |
- |
- |
2.4 |
6.0 |
6.0 |
30.2 |
39.2 |
49.9 |
50.9 |
30.2 |
41.6 |
55.9 |
56.9 |
|
Total LDCs |
36.1 |
43.6 |
32.4 |
32.4 |
39.1 |
70.7 |
463.8 |
465.1 |
252.5 |
580.2 |
274.8 |
282.2 |
327.7 |
694.5 |
771.0 |
779.7 |
|
* ACP sugar exporters classified also as LDCs
# EBA only
2011-13b denotes baseline, 2011-13s denotes reform
|
FIGURE 5
|
|
FIGURE 6
|
The relatively ambitious reform agreed by the Council of Ministers to reduce the high level of support of its domestic market does not substantially change the world sugar market fundamentals. The simulation exercise presented in this paper indicates that global effects of the European reform are most probably limited, and suggests that sugar international trade flows will be determined by both trade agreements and policy provisions, as well as by comparative advantage and competitive forces.
TABLE 4
Changes in export revenues of ACP countries and
LDCs, 100=2001-03
| |
2011-13b |
2011-13s |
|
| |
Belize |
92 |
59 |
| |
Trinidad and Tobago |
92 |
60 |
| |
Swaziland |
82 |
53 |
| |
Mauritius |
95 |
62 |
| |
Jamaica |
91 |
58 |
| |
Guyana |
94 |
60 |
| |
Fiji |
94 |
60 |
| |
Dominican Republic |
n.a. |
n.a. |
| |
Ivory Coast |
56 |
36 |
| |
Barbados |
15 |
9 |
| |
Kenya |
0 |
0 |
| |
Zimbabwe |
60 |
38 |
| |
Mozambique# |
6 959 |
4 542 |
| |
Ethiopia# |
787 |
504 |
| |
Burkina Faso# |
245 |
157 |
| |
Tanzania* |
409 |
262 |
| |
Sudan# |
553 |
339 |
| |
Malawi* |
370 |
225 |
| |
Zambia* |
343 |
242 |
| |
Madagascar* |
102 |
85 |
|
Total ACPs |
115 |
74 |
|
| |
Bangladesh ** |
100 |
64 |
| |
Other LDCs |
265 |
170 |
|
Total LDCs |
452 |
290 |
|
* ACP sugar exporters classified also as LDCs;
# EBA only
** 100 = 2011-13b
2011-13b denotes baseline, 2011-13s denotes reform
The results of the simulation exercise suggest that the EU sugar policy reform would tackle some of the domestic market issues, particularly the need to reduce production in less efficient regions, while allowing more efficient producers some freedom to choose the level of their production. The simulated contraction in EU supply and increase in consumption are similar, in terms of magnitude, to those indicated by a comparable quantitative assessment, based on a more detailed modelling of the EU domestic market (Witzke and Kuhn, 2003). Despite the fact that over-quota sugar production is to be still present in the simulation for 2013, its size appears substantially smaller than that suggested by the baseline without reform, rendering its absorption in the EU market easy through inter alia the provisions for absorption by the pharmaceutical industry, and thus allowing the EU to comply with the ruling of the WTO panel which considered all actual exports of C-sugar to be cross-subsidized. Nevertheless, the issue of re-exporting sugar imports under the SP still remains.
Concerning the erosion of preferences for the ACP countries that export to the EU under the SP and the gains accrued to LDCs due to the implementation of the EBA initiative, the model structure comprised by COSIMO-AGLINK and the gravity equations, indicate that export growth would be limited to about 500 thousand tonnes, given the combined effect of the natural trade costs and the price changes. In this respect, our results are consistent with the conclusions of UNCTAD (2005) and those of Steven and Keenan (2003), but not with the estimates provided by Witzke and Kuhn (2003). At the same time, the reform does not seem to make a particularly significant difference in terms of export volumes from the LDC and for most of the ACP countries, but only on their revenues, given that its effect on the world price is too small to determine any significant trade creation and diversion outside the administered SP quotas and the EBA preferences, and given that the EU domestic price, however reduced, still remains far higher than the world market price.
Further analysis would be useful to deepen the understanding of the production and export perspectives of individual countries, both inside the ACP group and LDCs and among the other major producers, in at least two main areas. Firstly, our analysis does not address the possibility that other LDCs, which currently are not exporting sugar to the EU, could start doing so on the basis of the EBA initiative. Our assumption that these countries face prohibitive trade costs, as they have not exported sugar to the EU to date, is rather strong. UNCTAD (2005) has highlighted that in some of them it would also be possible that local production starts to be exported, while imports are increased to cover consumption. A more qualitative approach, focussing on the whole value chain, may improve the understanding each individual country’s potential to produce and export. Secondly, one of the limitations of the analysis presented is that sugar is mostly treated as an homogenous product. Despite a simple differentiation between raw and refined sugar is available in the Cosimo-AGLINK model, other forms of differentiation, especially on the consumption side, are not taken into account.
In general, product differentiation and value addition can be considered as opportunities which can be pursued to recover revenues and enhance the perspectives of exporters facing an increasingly competitive environment, as in the case of a number of ACP countries. However, the extent to which these strategies can be viable alternatives for sugar producers appears questionable. While some consumers in developed countries’ markets may be willing to pay price premiums for differentiated products such as unrefined sugar, or for labels which promise the respect of social and environmental standards in production, the potential size of these markets appears limited, and overall consumption appears to be decreasing. At the same time, on the production costs side there a number of major producers, such as Brazil and Thailand, which are likely to remain the most competitive at any cost level.
Anderson, J.E. 1979. A Theoretical Foundation for the Gravity Equation. American Economic Review, 69, 106-116.
Anderson, J.E. & van Wincoop, E. 2003. Gravity with Gravitas: A Solution to the Border Puzzle. American Economic Review, 93, 170-192.
Anderson, J.E. & van Wincoop, E. 2004. Trade Costs. Working Paper 10480 National Bureau of Economic Research.
Arellano, M. & Honore, B. 2001. Panel Data Models: Some recent Developments, in J.J. Heckman and E.E. Leamer (eds), Handbook of Econometrics, Vol. 5, North Holland.
Arellano, M. & Bond, S.R. 1991. Some Tests of the Specification for Panel Data: Monte Carlo Evidence and an Application to Employment Equations. Review of Economic Studies, 58, 277-297.
Baier, S. & Bergstand, J.H. 2001. The Growth of the World Trade: Tariffs, Transport Costs and Income Similarity. Journal of International Economics, 53, 1-27.
Bergstand, J.H. 1989. The Generalised Gravity Equation, Monopolisitc Competition and the Factor Proportion Theory in International Trade. Review of Economics and Statistics, 67, 474-481.
Bergstand, J.H. 1990. The Hecksher-Ohlin-Samuelson Model, the Linder Hypothesis and the Determination of Bilateral Intra-Industry Trade. The Economic Journal, 100, 1216-29.
Blundell, R.W., Bond, S.R. & Windmeijer, F. 2000. Estimation in Dynamic Panel Data Models: Improving on the Performance of the Standard GMM Estimator, in B. Baltagi (ed) Advances in Econometrics, Non Stationary Panels, Panel Cointegration and Dynamic Panels, Vol.15, Elsevier Science.
Bond, S.R. 2002. Dynamic Panel Data Models: A Guide to Micro Data Methods and Practice. Institute of Fiscal Studies Working Paper Series CWP09/02, London, UK.
Brenton, P. 2003. Integrating the Least Developed Countries into the World Trading System: The Current Impact of EU Preferences under Everything But Arms. Mimeo, The World Bank.
Commission of the European Communities. 2005. Proposal for a Council Regulation on the common organisation of the markets in the sugar sector COM(2005) 263 final
Deardoff, A. 1998. Determinants of Bilateral Trade: Does Gravity Work in a Neoclassical World?, in J.A. Frankel (ed.), The Regionalisation of the World Economy. University of Chicago Press, Chicago.
Eaton, J. & Kortum, S. 2002. Technology, Geography and Trade. Econometrica 70, 1741-1779.
Feenstra, R.C. 2002. The Gravity Equation in International Economics: Theory and Evidence. The Scottish Journal of Political Economy, 49, 491-506.
Feenstra, R.C. 2003. Advanced International Trade: Theory and Evidence. Princeton University Press.
Hansen, L.P. 1982. Large Sample Properties of Generalised Method of Moments Estimators. Econometrica, 50, 1029-1054
Harrigan, J. 2002. Specialisation and the Volume of Trade: Do Data Obey the Laws?, in Choi, K. and J. Harrigan, (eds) The Handbook of International Trade, Basil Blackwell, London.
Organization for Economic Co-operation and Development (OECD). 2004. Representation of National Policy Regimes in the OECD Sugar Model in the Context of a Policy Reform Analyses, Directorate for Food, Agriculture and Fisheries, Committee on Agriculture, Group on Cereals, Animal Feeds and Sugar, April 2004
Organization for Economic Co-operation and Development and Food and Agriculture Organization of the UN. 2005. OECD-FAO Agricultural Outlook 2005-2014. OECD Publishing.
Piermartini, R. & Teh, R. 2005. Demystifying Modelling Methods for Trade Policy. Discussion Paper No. 10 World Trade Organisation.
Rogridues, F. & Rodrik, D. 1999. Trade Policy and Economic Growth: A Skeptic’s Guide to the Cross-National Evidence. Working Paper 7081 National Bureau of Economic Research
Stevens, C. & Kennan, J. 2001. The Impact of the EU’s "Everything But Arms" Proposal: A Report to Oxfam. Institute of Development Studies, UK.
Takayama, T. & Judge, G.G. 1971. Spatial and Temporal Price and Equilibrium Models. North Holland, Amsterdam.
United Nations Conference on Trade and Development (UNCTAD). 2005. "Effects of the Everything But Arms Initiative on the Sugar Industries of the Least Developed Countries". UNCTAD/DITC/COM/2004/6.
van Berkum, S., Roza, P. & van Tongeren, F. 2005. "Impacts of the EU sugar policy reforms on developing countries" Report 6.05.09, Agricultural Economics Research Institute (LEI), The Hague.
Witzke H.P & Kuhn A. 2003. "Assessing Reform Options for the Sugar Common Market Organization - Quantitative Analyses with Interlinked Models" No. 43. Jahrestagung der Gesellschaft für Wirtschafts- und Sozialwissenschaften des Landbaues e.V. vom 29. September bis 1. Oktober 2003 in Stuttgart-Hohenheim.
|
[47] 1 Piero
Conforti and George Rapsomanikis are Commodity Specialists in the Raw Materials,
Tropical and Horticultural Products Service, Commodities and Trade Division,
FAO. No senior authorship is assigned. We would like to thank David Hallam,
Kaison Chang and Amrouk El Mamoun for valuable comments. Julie Claro and
Patrizia Masciana provided excellent assistance with the data for which we are
thankful. Usual disclaimer applies. [48] Council Regulation (EC) No 416/2001 of 28 February 2001 provide details on the Everything But Arms initiative. For a comprehensive description of the initiative see UNCTAD (2005). [49] That exercise was based on the combined use of set of models including a partial equilibrium global model - the WATSIM model generating impacts on trade flows, whose detailed welfare effect in the EU was analyzed with a model including individual member countries’ models, the CAPSIM model. Further details on land allocation in individual areas were captured by the CAPRI model, while detailed response of individual farmers were studied through farm management models (Witzke and Kuhn, 2003). [50] For recent surveys on the theories behind gravity see Harrigan (2002) and Feenstra (2002, 2003). Although initially applied in an ad hoc manner, Anderson (1979) provided a theoretical foundation for gravity on the basis of products that are differentiated by country of origin and preferences determined by constant elasticity of substitution. Subsequent research derived gravity equations from a variety of different theories. Bergstand (1989, 1990) and Baier and Bergstand (2001) based gravity on monopolistic competition, whilst Deardoff (1998) derived gravity equations on the basis of a standard Hecksher-Ohlin trade model with complete specialisation in production Eaton and Kortum (2002) also derived gravity equations from a Ricardian trade model assuming homogeneous products. [51] Argentina, Australia, Austria, Bangladesh, Barbados, Belgium, Belize, Brazil, Burkina Faso, Canada, China, Cuba, Czech Republic, Denmark, Dominican Republic, Ethiopia, EU 6 (including Malta, Cyprus, Slovenia, Estonia, Latvia and Lithuania), Fiji, Finland, France, Germany, Greece, Guyana, Hungary, India, Indonesia, Ireland, Italy, Côte d’Ivoire, Jamaica, Kenya, Madagascar, Malawi, Mauritius, Mexico, Mozambique, Netherlands, other LDCs, Poland, Portugal, Russian Federation, Slovakia, South Africa, South Korea, Spain, Sudan, Swaziland, Sweden, Tanzania, Trinidad and Tobago, United Kingdom, United States, Viet Nam, Zambia, Zimbabwe, and Rest of the World. [52] In some major producing regions, such as Brazil and the USA, the model also includes sweetener substitutes on the demand side, ethanol and the joint product aspect of sugar and molasses. [53] This is a limitation, given that historically the value limits do not match the quantities exported with subsidy. [54] A detailed description of the estimation method is beyond the scope of this paper. For details on GMM and its application on panel data see Arellano and Bond (1991). Surveys on GMM are provided by Blundell, Bond and Windmeijer (2000) and Arellano and Honore (2001). An intuitive review is provided by Bond (2002). The method is robust to correlated country specific effects and endogeneity. It is a standard procedure for dynamic panel data models to transform the variables to their first differences in order to eliminate the country specific effects hie from the model. This transformation introduces correlation between the differenced lagged dependent variable and the differenced error term, rendering the OLS estimator inconsistent. Instrumental variables estimators, such as 2SLS are consistent but not asymptotically efficient due to identification problems. In the context of dynamic panel data models, under the assumption that the error term eie t is not serially correlated GMM estimators are asymptotically efficient. In this paper, we adhere to the Arellano and Bond (1991) two-step GMM estimator, correcting for heteroscedasticity in a manner similar to the White period covariance estimation. We utilize the Sargan test for overidentifying restrictions to test the validity of the identifying assumption that there is no serial correlation in the residuals. [55] Ethiopia, Sudan, Mozambique, Mali, Mauritania, Chad and Sierra Leone. [56] The reform scenario is based on information available at the end of November 2005, on personal communication with the EU Commission, and on EU Commission (2005). The intervention price is reduced in 4 years by 36 percent, as agreed in the Council of Ministers, instead of being reduced in 2 steps by 39 percent as proposed by the Commission according to information provided in Annex 1 of EU Commission (2005). Information for the increase and allocation of the production quota can be found in the same document as above. The additional quota is allocated to Belgium, the Czech Republic, Denmark, Germany, France, Lithuania, the Netherlands, Austria, Poland, Sweden and the United Kingdom. [57] Indeed, it can be argued that even fully decoupled payments do have some effect on production decision, for instance by reducing risk, and/or by affecting investment decisions. However, the simplified supply representation adopted in the partial equilibrium simulation model employed here does not allow to capture such effects. |
![]()
![]()
![]()