![]()
![]()
![]()
The straight N fertilizers used in Zimbabwe are ammonium nitrate (AN), urea, sodium nitrate, ammonium sulphate (AS) and calcium nitrate. The straight phosphate fertilizers are single, double and triple phosphates. The potash fertilizers are potassium chloride (KCl) and potassium sulphate (SOP - K2SO4). Tables 9 and 10 list the types and nutrient content of the fertilizers. Several fertilizers have been developed for specific crops or crops on specific soils, e.g. Sandy Maize fertilizer for maize grown in sandy soils.
The fertilizers are supplied in granular form and in bags. Bulk or liquid fertilizers are not used. The bag labels specify the content of N, phosphate (P2O5) and potash (K2O). The analysis or grade refers to the percentage by weight of N, P2O5 and K2O in that order. Thus, a 10-10-10 fertilizer contains 10 percent N, 10 percent P2O5 and 10 percent K2O.
Table 11 gives statistics on the production, import, export and consumption of fertilizer nutrients from 1990 to 2002.
The country imports AS for the tea estates and sodium nitrate for tobacco. The horticultural industry started to import calcium nitrate fertilizer in 2002. All potash is imported.
There are four major fertilizer producers in Zimbabwe. Table 12 gives their production capacities.
Two companies are primary producers of AN and phosphates. They sell their entire production to two other companies that utilize it, together with imported intermediates, to blend and produce NPK granular compounds. The four companies are interdependent in that the granulation technology and processes used are designed to utilize AN and superphosphates produced in Zimbabwe (Kachere, 1996).
TABLE 9
Complex fertilizers used in
Zimbabwe
|
Complex fertilizer |
Nitrogen |
Citric-soluble phosphate |
Potash |
Min. sulphur |
Micronutrient |
Main crop |
||
|
Boron |
Zinc |
|||||||
|
(%) |
||||||||
|
A |
2 |
17 |
15 |
K2SO4 |
10 |
0.1 |
|
Tobacco |
|
B |
4 |
17 |
15 |
K2SO4 |
9 |
0.1 |
|
Tobacco |
|
C |
6 |
17 |
15 |
11 as K2SO4, 4 as KCl |
7.5 |
0.1 |
|
Tobacco |
|
D |
8 |
14 |
7 |
KCl |
6.5 |
|
|
Maize, general |
|
J |
15 |
5 |
20 |
KCl |
3.4 |
0.04 |
|
Coffee, fruit trees |
|
K |
4 |
10 |
22 |
KCl |
6.5 |
0.2 |
|
Cotton |
|
l |
5 |
18 |
10 |
KCl |
8 |
0.25 |
|
Cotton |
|
M |
10 |
10 |
10 |
KCl |
6.5 |
|
|
Maize, general |
|
S |
7 |
21 |
7 |
K2SO4 |
9 |
0.04 |
|
Tobacco, potatoes, maize |
|
T |
22 |
6 |
10 |
2 as K2SO4, 8 as KCl |
3.5 |
|
|
Tea |
|
V |
4 |
17 |
15 |
11 as K2SO4, 4 as KCl |
8 |
0.1 |
|
Tobacco |
|
X |
20 |
10 |
5 |
KCl |
3 |
|
|
lawns, gardening |
|
Z |
8 |
14 |
7 |
KCl |
6.5 |
|
0.8 |
Maize |
There are a number of emerging fertilizer manufacturers. In the late 1990s, three companies commissioned bulk-blending plants and they now have a combined market share of 15 percent (Kachere, 2002). Another company manufactures a range of compounds and straights including calcium nitrate. There is a factory producing organic fertilizers that is also working on producing slow-release urea. Another company has fertilizer-blending equipment and has plans to harness natural gas in the Zambezi Valley for manufacturing N fertilizers.
Zimbabwe produces ammonia (through the electrolysis method) and AN. The country's AN plant has the capacity to produce 250 000 tonnes/year. This capacity requires 115 000 tonnes of ammonia, 40 000 tonnes being imported (from South Africa) (FAO & ACFD, 1999).
TABLE 10
Fertilizer types used in Zimbabwe - blends,
straights and others
|
Specially blended fertilizers |
Nitrogen |
Citric-soluble phosphate |
Potash |
Minimum sulphur |
Boron |
Zinc |
|
|
(%) |
|
||||||
|
Blends |
|
|
|
|
|
|
|
|
All Crop blend |
13 |
13 |
10 |
|
|
|
All crops |
|
Coffee blend |
17 |
5 |
20 |
|
|
|
Coffee |
|
Lawn blend |
25 |
5 |
5 |
|
|
|
Lawns |
|
Maize blend |
8 |
16 |
8 |
|
|
|
Maize |
|
Maize blend |
7 |
14 |
7 |
|
|
|
Maize |
|
Paprika blend |
5 |
20 |
15 |
|
|
|
Paprika |
|
Potash blend |
5 |
15 |
22 |
|
|
|
|
|
Sandy Maize blend |
7 |
14 |
7 |
|
|
10 |
Maize on sandy soils |
|
Tea blend |
17 |
5 |
20 |
|
|
|
Tea |
|
Tobacco blend |
5 |
20 |
17 |
|
|
|
Tobacco |
|
Tobacco blend |
7 |
20 |
17 |
|
|
|
Tobacco |
|
Tobacco blend |
6 |
15 |
12 |
|
|
|
Tobacco |
|
Tobacco seedbed blend |
7 |
21 |
18 |
|
|
|
Tobacco seed beds |
|
Straights |
|
|
|
|
|
|
|
|
Nitrogen |
|
|
|
|
|
|
|
|
AN |
34.5 |
|
|
|
|
|
|
|
AS |
21 |
|
|
27 |
|
|
|
|
Sodium sulphate |
16 |
|
|
|
|
|
|
|
Urea |
46 |
|
|
|
|
|
|
|
Phosphate |
|
|
|
|
|
|
|
|
Double superphosphate |
|
38 |
|
12 |
|
|
|
|
SSP |
|
19 |
|
5 |
|
|
|
|
TSP |
|
|
|
|
|
|
|
|
Potash |
|
|
|
|
|
|
|
|
MOP |
|
|
60 |
|
|
|
|
|
SOP |
|
|
50 |
16 |
|
|
|
|
Gypsum |
|
|
|
|
|
|
|
|
Calcium sulphate |
|
|
|
17.5 |
|
|
|
|
Solubar |
|
|
|
|
17 |
|
Eucalyptus |
|
Other fertilizers |
|
|
|
|
|
|
|
|
Grain blend |
8.3 |
16.5 |
7 |
8.3 |
|
0.3 |
Grain crops |
|
Limestone AN |
28 |
|
|
|
|
|
Grain crops |
|
Omnia supers |
3.4 |
24.1 |
|
11 |
|
0.5 |
|
|
Vegetable blend |
6.3 |
20 |
17.3 |
5.8 |
0.09 |
0.3 |
Vegetables |
Source: Windmill Private limited, 1999; Zimbabwe Fertilizer Company, 1999.
Phosphate fertilizers are produced locally. The phosphate rock for the production of phosphate fertilizers comes from the Dorowa mine. The processed phosphate products are phosphoric acid, DAP, MAP and superphosphate (single, double or triple superphosphate). Half of the elemental S for the production of sulphuric acid for manufacturing SSP comes from Canada. Zimbabwe imports all its potash, about 100 000 tonnes/year. Zimbabwe has traditionally been an exporter of fertilizers in the SADC region.
TABLE 11
Production, import, export and consumption of
fertilizer nutrients
|
Year |
Nitrogen |
Phosphate |
Potash |
||||||
|
Production |
Imports |
Exports |
Consumption |
Production |
Imports |
Exports |
Consumption |
Imports |
|
|
('000 tonnes nutrients) |
|||||||||
|
1990 |
83.3 |
7.2 |
0.7 |
95.0 |
42.3 |
6.7 |
1.7 |
41.6 |
32.5 |
|
1991 |
82.7 |
4.7 |
1.2 |
89.8 |
43.3 |
|
1.5 |
43.2 |
34.0 |
|
1992 |
66.6 |
4.8 |
2.8 |
57.6 |
45.9 |
|
3.3 |
34.6 |
39.5 |
|
1993 |
81.8 |
2.0 |
2.7 |
82.1 |
38.5 |
1.8 |
1.0 |
46.1 |
45.1 |
|
1994 |
94.0 |
10.4 |
|
92.9 |
42.0 |
3.0 |
|
42.3 |
49.9 |
|
1995 |
80.7 |
7.9 |
0.7 |
76.0 |
40.0 |
2.4 |
|
38.0 |
23.2 |
|
1996 |
86.0 |
30.6 |
2.1 |
94.0 |
36.0 |
2.4 |
|
37.0 |
48.2 |
|
1997 |
88.4 |
26.9 |
6.0 |
94.0 |
33.0 |
19.8 |
3.0 |
44.0 |
40.6 |
|
1998 |
74.1 |
24.1 |
3.2 |
95.0 |
35.5 |
6.3 |
2.0 |
42.0 |
40.0 |
|
1999 |
86.0 |
29.7 |
1.9 |
100.0 |
38.0 |
5.1 |
|
43.0 |
42.4 |
|
2000 |
71.4 |
21.4 |
|
87.4 |
30.0 |
14.5 |
|
43.4 |
34.6 |
|
2001 |
59.5 |
22.9 |
|
82.0 |
26.1 |
11.5 |
|
35.0 |
35.2 |
|
2002 |
61.1 |
6.94 |
1.6 |
60.0 |
38.3 |
1.4 |
0.6 |
30.0 |
19.4 |
Source: FAOSTAT.
TABLE 12
Products and production
capacities
|
Product |
Production capacity |
|
AN |
250 |
|
NPK |
350 |
|
NPK |
350 |
|
Phosphate fertilizers |
65 |
|
SSP |
200 |
|
TSP |
60 |
Source: FAO & ACFD, 1999; Mashingaidze, 2004.
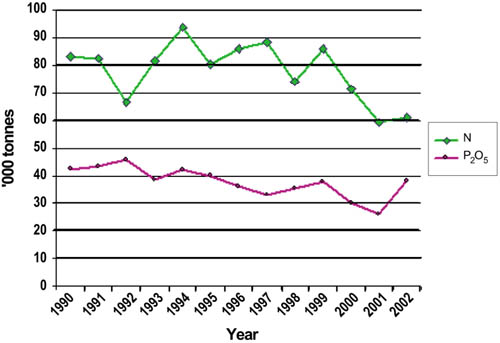
The fertilizer manufacturers have been operating below capacity since the mid-1990s. Figure 3 illustrates the trends in the production of N and P2O5 in the period 1990-2002. It shows a major decline in production between 1992 and 2002.
Several factors contributed to the fall in the production of fertilizers. There was a general shortage of foreign currency. This curtailed the importation of raw materials such as ammonia, potash and others. The shortage of foreign exchange also resulted in fertilizer manufacturers being unable to import equipment and machinery for maintaining, refurbishing and replacing production plants. This problem was compounded by high repair and maintenance costs caused by high inflation and interest rates since 2002, and the high cost of foreign exchange sourced in the "black market". High inflation increased the costs of electricity and transport.
|
FIGURE 3
|
These production problems were exacerbated by reduced fertilizer demand caused by the decline in the purchase and use of fertilizers by farmers. This in turn was made worse by government-imposed price controls on the wholesale and retail fertilizer prices, while raw material prices remained uncontrolled. The fertilizer manufacturers were not able to take advantage of more remunerative export markets owing to restrictions on exports imposed by the Government in order to reserve the sale of the fertilizer products for the domestic market.
Another problem facing the fertilizer companies was the inability of the National Railways of Zimbabwe (NRZ) to move raw materials from outside and within the country in a timely manner. The inability of the NRZ to move raw material from the Dorowa mine to the factory in Harare reduced the output of phosphate fertilizers severely. Dorowa's phosphate rock capacity is estimated at 150 000 tonnes/year. However, in 2000 it produced only 110 000 tonnes of phosphate rock concentrate because of transport constraints.
The restricted supply of raw materials to the fertilizer manufacturers resulted in their running behind schedule for most of the 2000-04 period.
In the period 2001-04, an input supply scheme for resettled farmers was implemented. The fertilizer companies were committed to supply in accordance with a government order. In some cases, this resulted in a supply shortage for fertilizer sold on the open market. Because of production problems, there were also delays in supplying government orders.
Because of the lack of foreign exchange to import anhydrous ammonia from South Africa, N-fertilizer output in 2002/03 was about 50 percent of normal. Apart from the foreign exchange shortage, it became uneconomic to import the anhydrous ammonia as the controlled price of urea was set at a level below landed cost. Another problem facing the production of ammonia and AN is the potential shortage and ever-increasing cost of electricity.
The two companies that produce fertilizer compounds and blends in Zimbabwe distribute their compounds, straights and blends to wholesalers and retailers, who constitute the dominant marketing channels for fertilizers. The other distribution channel is the public-sector input support scheme through which the State purchases fertilizers for distribution to farmers.
Large agrotraders, including farmers' buying cooperatives and syndicates or input-buying clubs, obtain stocks from the producers for onward sale to farmers. Individual farmers and agrosupply retailers also buy fertilizers directly. Entry into and exit from the sector is easy. There are no legal restrictions on the types and numbers of marketing channels.
In the smallholder subsector (mainly communal lands and resettlement areas), the supply of inputs is mainly through general dealers and small agrodealers. These operators have the advantage of proximity to the farmers.
Some private-sector agrofirms involved in buying tobacco, cotton and sorghum have their own input support or loan schemes through which they acquire fertilizer for distribution to the producers of the relevant commodities. The farmers reimburse by selling their commodities to the companies.
A number of non-governmental community development organizations, Care International, World Vision and Citizens Network for Foreign Affairs working with the ACFD ran a programme for training and establishing agrodealers in smallholder areas. About 2 000 dealers were trained in the basic principles of storing, retailing, pricing and service.
The government agencies involved in fertilizers include agricultural extension departments and parastatals, the Grain Marketing Board (GMB) and the Agricultural and Rural Development Authority (ARDA). The GMB is responsible for the importation, storage, transport and wholesaling of the main foodgrains, i.e. maize and wheat. The ARDA is responsible for running State farms as well as promoting rural and agricultural development through infrastructure support and development. These channels are used by the Government to supply subsidized fertilizers, seeds and other inputs to smallholders on communal lands, resettlement areas and to A1 and A2 farmers in the new farming areas. Because of bureaucratic ordering and distribution processes and the limited amount of money, not all farmers are able to access fertilizers in a timely manner through this system. However, the major problem has been the failure by some of the farmers to repay the sums they have borrowed.
After achieving majority rule in 1980, the Government promoted the establishment of input supply and production cooperatives. However, very few input supply cooperatives are currently functioning.
The Government of Zimbabwe has established some measures for promoting the supply and use of fertilizers. These include:
support for the agro-input dealer programmes.
A major constraint facing distributors is the above-mentioned general shortage of fertilizers. The shortage is in terms of both absolute quantities and timing. Some fertilizers arrive well after peak application time. The distributors then have to carry over large unpurchased stocks. Another problem concerns the price controls. These result in reduced profit margins, particularly for rural traders who face high transportation costs. The Government input schemes through which fertilizers are provided to farmers through the GMB and other government agencies also have an adverse impact on agrodealers as they reduce the quantities purchased from the dealers. A further constraint is the lack of storage capacity among small agrodealers.
![]()
![]()
![]()