![]()
![]()
![]()
Until 1999, the large-scale commercial farming subsector accounted for most of the fertilizer consumption. The N:P2O5:K2O ratio was 1.0: 0.55:0.43 in the commercial farming subsector and 1.0:0.51:0.18 in the communal subsector (Table 13).
The application rates in the large-scale commercial farming subsector were comparable with those in developed countries. The application rates in the smallholder subsector were and have remained much lower (Table 14).
The disparity in fertilizer use between the different farming sectors indicates a large potential for increased fertilizer use in the smallholder subsector.
TABLE 13
Consumption of fertilizer products by farming
sector
|
Nutrient |
Large-scale commercial |
Smallholders |
Total |
Large-scale commercial |
Smallholders |
|||
|
('000 tonnes) |
(%) |
('000 tonnes) |
(%) |
('000 tonnes) |
(%) |
(%) |
(%) |
|
|
N |
70.8 |
51 |
19.9 |
65 |
90.7 |
53 |
78 |
22 |
|
P2O5 |
38.7 |
28 |
7.0 |
23 |
45.7 |
27 |
85 |
15 |
|
K2O |
30.5 |
22 |
3.8 |
12 |
34.3 |
20 |
89 |
11 |
|
Total |
140.0 |
100 |
30.7 |
100 |
170.7 |
100 |
82 |
18 |
Source: ACFD, 1996.
TABLE 14
The market shares of the farming
subsectors
|
Subsector |
Percent of fertilizer market |
No. of farmers |
Average fertilizer order |
Average fertilizer application |
|
(%) |
('000) |
(tonnes product) |
(kg NPK/ha) |
|
|
Large-scale commercial |
81 |
2.5 |
165 |
290 |
|
Communal lands |
17 |
850.0 |
0.1 |
15 |
|
Small-scale commercial |
2 |
12.0 |
0.8 |
33 |
Statistics on fertilizer use by farming subsector for the period 2000-04 are incomplete and could be misleading owing to a number of factors, for example:
As a result of the agrarian and land reform programme, large-scale commercial agriculture as it was before 2000 has disappeared. There are few statistics on fertilizer use by new farmers who have moved onto the former commercial farms.
The Government input schemes could distort the actual use by the farming sectors. Some of the fertilizers intended for the smallholder subsector find their way to medium-scale commercial farmers.
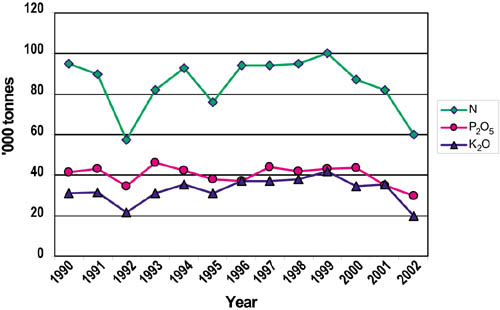
Aggregate figures for fertilizer consumption show an overall decline since 2000 (Figure 4).
The average annual fertilizer consumption in the period 1989-1994 was 463 589 tonnes. Consumption of N fertilizers in 1990 was 94 985 tonnes N, falling to 76 000 tonnes N in 1995. Consumption then rose to 100 000 tonnes N in 1999 before declining again to 60 000 tonnes N in 2002. The decline was in terms of both absolute levels (tonnes of fertilizer consumed) and rates of use (kilograms per hectare of arable land).
|
Figure 4
|
Source: FAOSTAT.
Fertilizer use in the large-scale commercial farming subsector declined sharply between 2000 and 2004, the production of the major cash crops such as tobacco, cotton and soybeans being disrupted by the agrarian reform programme (Mashingaidze, 2004). Crop production by the new farmers who took over the land from white commercial farmers remains depressed at a level well below that of the former farmers. The majority of the A2 farmers had not begun production by 2003. A significant number of A1 farmers were farming with reduced levels of fertilizer use.
Fertilizer consumption by smallholders is low and variable because of several economic, political, technical and institutional factors (Bhondayi, 2004; Kanyoka, 2004; Madzara, 2003; Magara, 2002; Mangoti, 2002; Mashavave, 2003; Murwira, 1995; Nhemachena, 2004; Ngulube, 2000; Zimbabwe Farmers' Union, 2002; Zinyama, 2003). These include the poorly developed marketing system, which results in fertilizers often being unavailable to farmers when they need them. Most smallholders have to travel long distances to purchase fertilizer. The increases in rural bus fares as a result of fuel price increases since 2001 have made the purchase of fertilizers in urban centres expensive. Fertilizers in local shops tend to be more expensive as dealers increase their margins to cover their transaction. Prior to 2001, most fertilizers were sold in 50-kg bags but many farmers needed to buy in smaller quantities of 5 kg and 10 kg.
It is estimated that only one-fifth of smallholder farmers use fertilizers. One factor is the non-availability of finance as the demand for fertilizer is heavily dependent on the availability of credit and cash. The majority of smallholder farmers on the communal lands and resettlement areas and the new farmers lack the finance to purchase and use adequate fertilizer levels. In the period immediately after majority rule in 1980, the availability of subsidized credit and cash income from the sale of food and cash crops drove smallholder fertilizer demand. Fertilizer was affordable because producer prices were high in relation to the fertilizer prices. According to the Zimbabwe Farmers' Union (2002), smallholder farmers then reduced their fertilizer procurement following the Structural Adjustment Programme in 1990 as a result of the increase in the prices of fertilizer and other inputs.
A third factor is inadequate extension advice from fertilizer dealers, leading to suboptimal utilization of fertilizers and, hence, suboptimal yields.
Fertilizer use is a risky investment on most communal lands because of the low and unevenly distributed rainfall and dry spells at the critical time for fertilizer application (first eight weeks of crop establishment).
The Government input support and distribution schemes sometimes work to the disadvantage of farmers who depend on the market for their fertilizer and inputs. In 2002, 2003 and 2004, the Government's tender for the acquisition of seeds and fertilizers from producers/manufacturers led to a shortage of the inputs on the open market. In response, prices rose on the black market.
Table 15 shows the maize response to fertilizer application and the increase in maize yield through mineral and organic fertilizers. According to Shamudzarira and Robertson (2002), maize grain yield responses to varying quantities of applied N on a typical low fertility soil, based on on-farm and on-station results, range from 0 to 2 000 kg/ha with an average of 500 kg/ha. The results also showed that in one season out of five there was no benefit from applying mineral fertilizers on soils of low fertility and in the low rainfall zones (Shamudzarira, 2003). However, results from simulated maize yield responses to an application of 10 kg N/ha indicated that responses to low rates of N would generally be greater on low fertility soils than on high fertility soils (Mukurumbira, 1985; Shamudzarira and Robertson, 2002).
TABLE 15
Maize response to fertilizer
application
|
Cattle manure |
Fertilizer |
Yield |
Combination yield over control |
|||
| |
|
Control |
Organic fertilizer only |
Mineral fertilizer only |
Combination |
|
|
(tonnes/ha)1 |
(kg/ha) |
(tonnes/ha) |
|
|
|
(%) |
|
13-25 |
112 N |
0.79 |
1.11 |
1.30 |
1.93 |
160 |
1 Manure broadcast and ploughed in before planting.
2 Potash split between basal and top-dressing.
Source: Shamudzarira and Robertson, 2002.
|
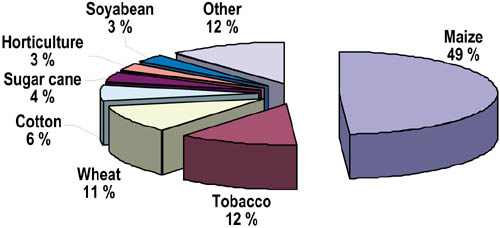
Figure 5 Fertilizer use by crop
|
Source: Mashingaidze, 2004.
Figure 5 shows the proportions of fertilizers used on each crop. These statistics relate to the period before 2000. Maize accounted for almost half of the fertilizer consumed in the country, followed by tobacco and wheat. The production of the major cash crops, such as tobacco, cotton and soybeans, and the associated fertilizer use declined sharply in the period 2000-04, when large-scale commercial farming was disrupted by the agrarian reform programme.
![]()
![]()
![]()