![]()
![]()
![]()
Introduction
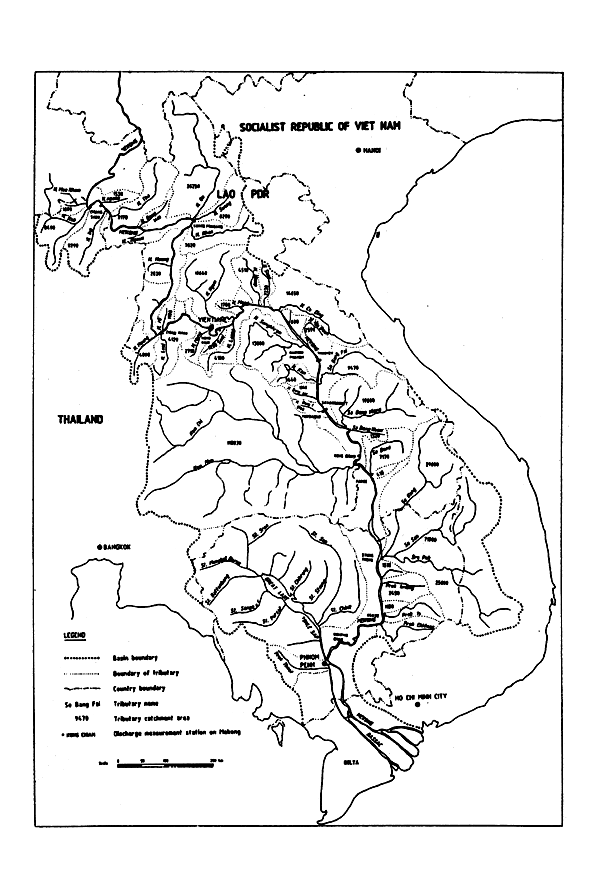
The Mekong is ranked among the largest rivers of the world. The river drains an area of approximately 600 000 km2, covering parts of China, Myanmar, Thailand, Laos, Cambodia and Viet Nam (Figure 1). At Kratie, close to the upstream part of the Mekong Delta, the average annual discharge equals 437 billion m3/s, or an average discharge of around 14 000 m3/s. Downstream of Kratie, the river enters the extremely flat and low lying Mekong Delta.
This paper addresses the topic of floods in this river and its tributaries. In the Mekong, the ratio between 10% low flows and 10% high flood discharge is approximately 50. Years with severe floods were 1961, 1966, 1971, 1978, 1984, 1991 and 1995. Despite the high discharges, it is not common for Mekong River floods to cause casualties. The principal problem from floods is damage to crops and infrastructure. In 1995, for example, severe floods caused substantial damage in the Vientiane Plain of Laos. During that monsoon, an area of approximately 40 000 ha was flooded resulting in a damage estimated at US$21 million.
In view of the frequency of the floods, a good forecasting system is a necessity to improve the preparedness of the population to floods and to support evacuation plans. Since 1970 the Mekong Secretariat (now called the Mekong River Commission Secretariat, or MRCS) has operated a flood forecasting system for the Mekong River during the flood prone months from July to October.
Over the past decades many dikes were built along the Mekong River, in particular along the borders with Thailand. Secondary effects of these dikes are the increase in downstream flood levels as a result of the reduction in flood plain storage, the faster propagation of floods along the river and impeded drainage of tributaries, causing local floods.
However, there are also other factors contributing to a reduction of flood levels. In the Mekong Basin many reservoirs have been built or are under construction, which store water from the rainy season for use during the dry season, either for hydro-electric power production and/or for irrigation water supply. Incidentally, such reservoirs may have a negative impact on flood levels as a result of changing lag times between peaks or the delay in conveyance of water from the watersheds.
Adri Verwey, River Modelling Specialist, WL/Delft Hydraulics, Netherlands
FIGURE 1
Basin of Lower Mekong River
Mathematical simulation models can be very instrumental in evaluating the effects of reservoirs and their operation on the Mekong River floods. Flood forecasting models, in general, are of great help in improving the operation of reservoirs and avoiding unnecessary spilling of water. Mathematical models can also lead to an improved understanding of the flood phenomena and provide insight into the causes of flooding. In this manner, more appropriate measures can be taken to reduce flood damage.
As an example, one might look at a country like Bangladesh, where in 1986 UNDP and the World Bank supported the creation of the Surface Water Simulation Modelling Centre (SWSMC). Currently this centre has a staff of 42 and is in charge of flood forecasting and flood control modelling for the country. At SWSMC flood forecasts are produced at 32 stations spread over the whole country. Many of the simulations made relate to the design of controlled flooding systems.
The simulation models used and their supporting techniques have improved substantially over the past years. One important factor to this is the increase in computer speed and memory capacity. As a spin-off of this development, also many new technologies have emerged, which open up many new possibilities in flood modelling and in land and water development projects more in general.
The MRCS flood forecasting centre
Flood forecasts at MRCS are prepared on weekdays during the months July to October. Data are received from 22 rainfall stations and from 37 hydrologic stations between 07.00 and 09.00 hours daily. Water level forecasts are produced for the stations Chiang Saen, Luang Prabang, Chiang Khan, Vientiane, Nong Khai, Nakhon Phanom, Thakhek, Savannakhet, Mukdahan, Pakse and Kratie and are sent to the member countries by fax around midday. In alert situations the forecasts are also produced during the weekends. An example of the report is shown in Figure 2.
Data received are transmitted via Fixed Frequency Radio Transmission. Apparently this system is quite frequently out of order at some stations. However, within the Improvement of Hydro-Met Project, funded by the Governments of Japan and Australia, the number of stations is being extended and/or rehabilitated. The improved system will still be based upon radio transmission of data.
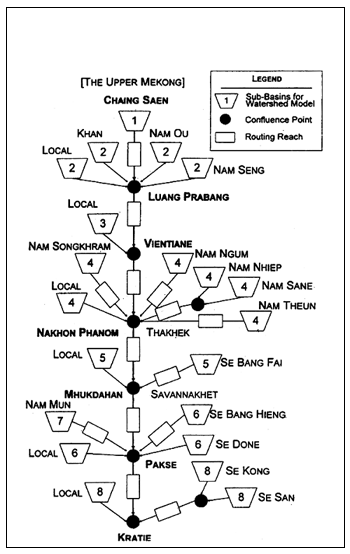
Flood forecasting at MRCS is based upon a SSARR model calibrated in 1970. It comprises the Mekong from Chiang Saen at Thailand's border with Myanmar to Kratie in Cambodia. The model consists of eight principal reaches, each of which has a number of watershed models attached to the nodes. Some of these watershed models also have channel routing components. The schematization is shown in Figure 3.
At MRCS the probable rain depths are estimated from information received from the Thai Department of Meteorology. This information includes current rainfall data at ground stations and their forecasts. These forecasts are also based upon weather charts and ground radar imageries.
FIGURE 2
Example of flood forecast form
| |||||||||||||||||||||||||||||||||||||||||||||||||||||||||||||||||||||||||||||||||||||||||||||||||||||||||||||||||||||||||||||||||||||||||||||||||||||||||||||||||||||||||||||||||||||||||||||||||||||||||||||||||||||||||||||||||||||||||||||||||||||||
| |||||||||||||||||||||||||||||||||||||||||||||||||||||||||||||||||||||||||||||||||||||||||||||||||||||||||||||||||||||||||||||||||||||||||||||||||||||||||||||||||||||||||||||||||||||||||||||||||||||||||||||||||||||||||||||||||||||||||||||||||||||||
Charge: 2.1.13/93/JPN/Line 53 Drafted: Tien/Manoroth Concurred: Tanaka Concurred: Tanaka Approved: Sok Approved: Sok | |||||||||||||||||||||||||||||||||||||||||||||||||||||||||||||||||||||||||||||||||||||||||||||||||||||||||||||||||||||||||||||||||||||||||||||||||||||||||||||||||||||||||||||||||||||||||||||||||||||||||||||||||||||||||||||||||||||||||||||||||||||||
The modellers who estimate rainfall data during the lead period of the forecast also use 10-day forecasts based upon the Global Numerical Meteorological Model for reference. Data of further refined models are available from the Japan Meteorological Agency. Results of their Operational Numerical Weather Prediction Models cover the Mekong Basin in more detail and forecasts are made available through the internet in the form of bit maps. Expected daily rain depths are shown in eight classes on a logarithmic scale.
Based upon experience, corrections for topographical deviations from the forecasted rain depths are entered into the average catchment rain depths provided to the SSARR model. As the rain infiltration processes were calibrated on the basis of 6-hourly rain depths, the daily depths are distributed over the day with assigned probabilistic weights of 0.2, 0.4, 0.3 and 0.1 respectively.
FIGURE 3
Schematization of the flood forecasting model
Each forecast is based upon computations started four days ahead of the actual time of simulation. The simulation is initiated with measured discharges, overwriting the computed ones. Soil moisture data are maintained, which implies that the rainfall-runoff models are not being updated.
Operation of the models is still based upon the manual editing of data in ASCII files. Data follow the old Fortran convention of formatted data input, which requires very careful checking of the position of digits and causes an unnecessary risk of mistakes. The models are still the same as those calibrated in the seventies. However, corrections are made for systematic errors in catchment runoffs as these have been determined during the years over which the model has been in operation.
Model results are analysed carefully before issuing the forecasts. Computed discharges are converted into water levels via the known stage-discharge curves. Consistency is obtained with these data through the input of initial discharges converted from water levels by means of the same rating curves. Despite all these measures, the quality of the forecasts is not high. Although the one-day forecasts appear to produce acceptable results, the five-day forecasts at some stations give peak watér levels which are sometimes out by a half to one metre.
The hydrodynamic model of the mekong
In 1988 Delft Hydraulics was commissioned to conduct a study titled “Scientific and Technical Assistance for Hydro-Meteorlogy and Mathematical Modelling” with the following objectives:
The resulting Master Model is a 1-D mathematical flow model of the Mekong River from Chiang Saen to the sea. The model was developed with the objective of becoming a key instrument for planning, analysis and design in the Mekong River Basin. In particular, it enables studies on the effects of natural and man-made interference's in the river basin. The Master Model was developed on the basis of Delft Hydraulic's WENDY package (further developed since into the software package called SOBEK).
The Master Model consists of three parts:
FIGURE 4
Verification of water levels simulated with
WENDY at Mukdahan
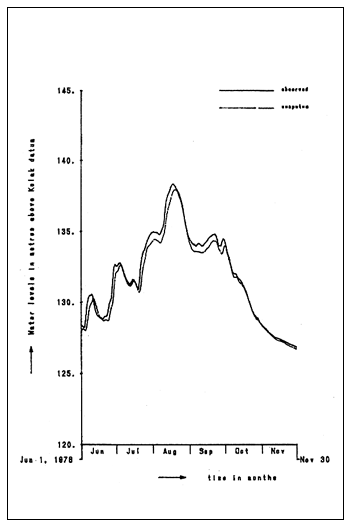
Despite the shortcomings of the maps providing topographic data in the flood plains, the models were caliberated satisfactorily. An example of the fit of water levels for a flood wave passing at Mukdahan is shown in Figure 4. In view of the fact that the calibration of this model focused on the fitting of discharges, the differences between computed and measured water levels are acceptable.
At the time of the model development, there were still some problems in improving the quality of the hydrodynamic models. The developers of the Mekong River Model conclude that an accurate model development is hampered by:
However, since these observations were made the scope for further improvement of the models looks better. Since the calibration of the models, more reliable data have become available. River cross-sections have been monitored through a FINADA sponsored river survey project. The cross-sections have been stored in a database and can be linked to the Mekong Master Model. The availability of discharge data from tributaries has improved since the start of the Hydro-Met Project. In addition, there is a considerable scope for further improvement as a result of emerging technologies, as discussed in the sequel.
Emerging technologies
Over various decades computer speed and storage capacities are increasing by 50% yearly or a factor of more than 50 over each decade. This simply means that what a computer does now in an hour, will be done in a minute ten years from now. Over twenty years, or half the professional lifetime of an engineer, the work done in one hour is reduced to one second only. There is no indication that there will be a slow down of this trend. Computer storage follows a similar trend. Whereas the PC had an internal memory of 640 Kb 10 years ago, it now has 32 Mb internal memory. This results in the development of technologies, which were unheard of or just in experimental phase 10 years ago.
DGPS technology
One of these areas of progress is the collection of topographic data. The combination of satellite technology and fast computer processing speed has opened up new possibilities for collecting flood plain levels on the basis of differential GPS systems (DGPS). The combination of laser beam scanning applied from a helicopter flying at approximately 100 m altitude, together with a DGPS in real-time-kinetic-on-the-flight mode, has delivered digital terrain levels of flood plains in The Netherlands with an accuracy of 0.5 m. The laser altimetry method can also be applied from small planes flying at a 500–1000 m altitude. These planes can move at speeds of 200–300 km/hour in order to allow a correct registration of their position. In one go, scans are made of a track of 400 m width. This implies the scanning of more than 100 km2 during one hour. The number of points scanned is approximately 600 per ha. The accuracy of the vertical levels on the maps produced is 5 to 10 cm if powerful post-processing software is used.
In the scans, vegetation can be separated from the ground level, if the vegetation is somewhat permeable. Trees, for examples, are recognized and can be filtered from the surface level. The problem with paddy fields would be the somewhat unknown depth of water on various plots, as the laser beams would pass the vegetation, but are reflected at the water surface. Sampling at ground level would allow the removal of the systematic error, thus leaving only the standard deviation resulting from the variations in water depths at the fields.
Technically the method is more or less proven technology. It is expected that by the year 2000 the complete area of the Netherlands has been resurveyed this way. However, the method is still rather costly at prices charged having an order of magnitude of US$5/ha. This is more than the unit price charged in Laos for conventional surveying. It is expected that these prices will go down as the initial investment costs are being recovered, possibly to levels of US$ 1– 2/ha. The data collected can easily be processed in the form of a digital terrain model, which has big advantages both for modelling and for the general process of land and water development.
The potential of this method is the possibility of collecting highly accurate information on flood plain topographies. The potential for model calibration is in the possibility to scan water levels along the river during a flood period and receive an accurate picture of water level variations all along the Mekong River. In other words, it is expected that this methodology will substantially improve the quality of hydrodynamic channel flow models, both in terms of the description of the topography and in terms of the calibration of the models.
FIGURE 5
Schematization of a biological neuron
Artificial neural networks
For extracting information from observed patterns new methodologies have come up with the further development of computational speed. Data mining techniques, such as the artificial neural networks (ANNs) enable the recognition of patterns which link the various sources of data. Contary to multiple regression techniques, the ANNs do not require prescribed functional relationships as input. The networks contain the flexibility to create both relations and their parameters as an integrated set of data.
FIGURE 6
Example of the structure of an ANN
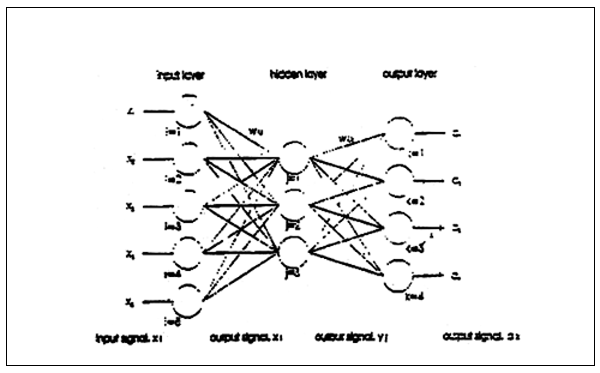
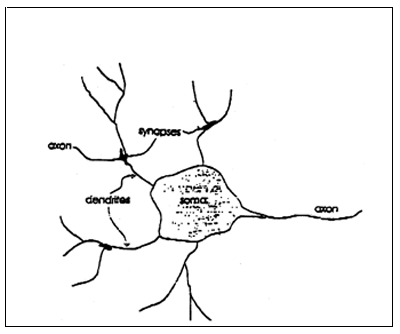
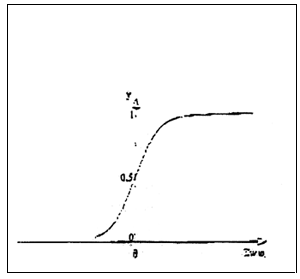
The idea stems from the way neurons function within the brains (Figure 5). These bio-logical neurons receive signals and pass these on to other neurons either as amplified or as dampened signals. This process is simulated by the simplified scheme shown by Figure 6, with amplification functions possibly defined by a sigmoid or logistic threshold function (Figure 7). Through this schematization it is possible to define quite non-linear processes.
FIGURE 7
The sigmoid or logistic threshold function
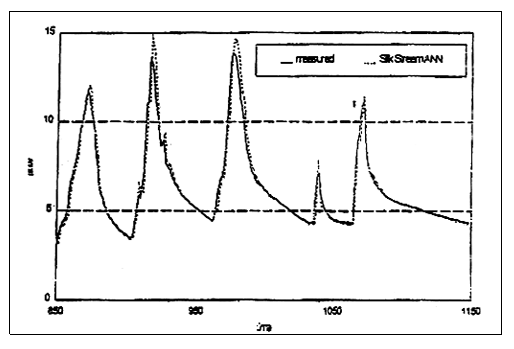
The potential of this technology has been proven in fields as different as hand written character recognition to stock exchange pattern recognition. In the fields of hydraulics and hydrology it has been applied to areas as diverse as rainfall-runoff modelling (Figure 8), to mathematical model emulation in system optimization, as well as to the establishment of rating curves in areas with backwaters.
FIGURE 8
Example of rainfall-runoff results produced with an ANN
In practical use, however, some observations have to be made. In the first place it is evident that the method only works if one tries to connect input signals to output signals, which also in the physical system show a clear dependence. For example, in a river catchment the level of the groundwater table is not just dependent on the current rainfall (input signal), but also to the antecedent rainfall. For this reason it is clear that either antecedent rainfall data have to be given as input signals, or the current groundwater level has to be entered through regressive definitions.
In the second place it has to be stated that the development of the ANN goes through a calibration or training phase, just as the brains need some time to process information on what goes on around us and learn from it. However, whereas the intuitive brains are able to think beyond the limits of what has been learnt, the ANNs (so far) are not able to extrapolate and any attempt to do so is punished in the form of the likelihood to produce nonsense. In principle, this danger of extrapolation is much similar to the extrapolation of fitted curves, such as, for example, traditionally established rating curves used in hydrology.
The conclusion on this technology is that it opens up many interesting possibilities in the field of flood problems, reservoir operation, water balance computations, rainfall forecasts and many others. The technology is extremely powerful under the condition that it is used with a lot of common sense.
Hydrodynamic flow modelling in rivers
The numerical description of river flow was developed in the 1970s and the 1980s and has been improved since primarily in terms of numerical robustness. This is of particular importance in flood forecasting, as one is dealing with extreme flow conditions. If a model suffers from numerical problems, it is exactly here that the risk of failure of simulations is highest. For this reason, robustness is a property that in the selection of numerical models for flood wave propagation simulation should get a very high priority.
Improvements also stem from technological advances in other areas, such as data collection and emulation techniques. The progress in the applicability of hydrodynamic models lies mainly in the progress of computer speed. In Vietnam, for example, nowadays large, detailed models of the Delta are run frequently to study salt intrusion in relation to various irrigation options, drainage problems, including the comparison of various alternatives etc.
For optimization of systems, hydrodynamic models are currently only used in trial and error approaches. If many simulations are required, such as for on-line control of hydraulic systems, emulation techniques replacing the hydrodynamic models with, are being used. In such case, the ANN is trained on the basis of a selected number of simulations with an accurate hydrodynamic model. After this training, the ANN is applied to study a large number of alternatives and to compare the functioning of these. Here, again, it has to be stated that in such processes the ANN should not be used in extrapolation mode. In other words, it should not be used for cases for which it has not been trained.
Potential improvement in reliability of flood forecasts
The reliability of forecasts can be increased in various ways, such as:
In addition, the current possibilities of user interfaces, data bases and GIS systems provide substantial scope for improvements in handling data entry and dissemination of the forecasts.
More reliable forecasts are possible in the first place by improving the rainfall forecasts. For given meteorological conditions, rainfall forecasts can be made on the basis of various types of measurements, such as areal rainfall distributions, atmospheric pressure distributions, wind directions and vapour content. Radar measurements are useful, as well as satellite images. The problem is in making this information available at the forecasting centre and in extracting the correct information from such data.
Another and more accessible source of data for precipitation forecasting is the weather maps. MRCS has recently introduced the practice of using the catchment rainfall from the areal rainfall forecasts produced by the Global Numerical Meteorological Model as a reference in rainfall forecasting. This method could be improved further through the calibration of which would establish relationships between catchment integrated rainfall from the weather forecast bit maps and the resulting catchment runoff. This approach is expected to replace the need for a much denser rain gauge network and its associated transmission system in the Mekong Basin This is particularly useful, as the installation of more rainfall gauges is not very practical in remote catchments in mountainous areas of the Mekong Basin. Any approach to flood forecasting which minimizes the need for ground stations should be given favourable consideration.
Another improvement is based upon a re-calibration and possible replacement of the rainfall-runoff models for the Mekong subcatchments. Currently, the forecasting system uses eight subcatchments, for which rainfall-runoff simulation is made. This should be extended to the development of rainfall-runoff models for each individual main tributary, as was already attempted at the beginning of the eighties. Besides the SSARR model, a variety of other rainfall runoff models would be suitable, such as the Sacramento model, tank models etc. The upgrade of the forecasting system should include extension and re-calibration of sub-catchment models, based upon information collected at MRCS during the past decade.
Further improvements are possible by replacing the SSARR channel routing model by a full hydrodynamic model. A hydrodynamic model is the only tool enabling flood forecasting in the flat areas of Cambodia and Vietnam. The calibration of the WENDY model, as part of the Mekong Master Model project finalized in 1991 has proven that such model can be developed with sufficient accuracy for the Mekong River, despite the shortcomings in accuracy of topographical data. The lack of accuracy, in this case, was substituted with knowledge on the flood deformation characteristics and their relation to channel cross-section parameters. As discussed, there is now a good scope for further improvement of the hydrodynamic models. It is quite unfortunate that so far the hydrodynamic model was never incorporated into the forecasting system.
A clear advantage of incorporating the existing hydrodynamic model in the forecasting system is the readily available possibility to extend the forecasting system to locations in Cambodia and Viet Nam as it includes the Tonle Sap River, the Great Lake and the main branches in the Mekong Delta. The principal reason to separate the model parts during their development in the period 1988–1991, at least the model parts 1 and 3, has been the lack of computational speed at that time. The various components were running on PC's with an Intel 386 processor. With the currently available Pentium processors combined models would be feasible and the forecasting system could easily be extended on the basis of one single model from Chiang Saen to the sea.
A last element in improving the flood forecasts is an updating procedure, which handles uncertainties in input data. Currently, the updating is based upon a simple replacement of computed river discharges by measured ones in case of differences between both data sources. However, such procedure does not update the state of catchment storage and this is a deficiency that may contribute significantly to errors in forecasts. It is recommended to replace the updating method by a scientifically sounder approach, such as Kalman filtering.
Capacity building at MRCS - HU
In 1994 a Mekong Hydrological Programme Review Mission (HRM) evaluated the Mekong Hydrology Programme (MHP) seeking donor assistance for the execution of various projects. The outcome was the recommendation to give priority to institutional strengthening of the Mekong Secretariat, both through capacity building and through the development of support software.
After the signing of the new agreement on continued co-operation on the Mekong in 1995 and the formation of MRC, the recommendations were reviewed again in 1997 in the light of the new MRC mandates. This review was made by Prof. Bogardi, who also headed the 1994 HRM. The outcome was a revised report with a recommendation to GON to fund a project with institutional strengthening of MRCS and human resources development as the principal objectives, together with the recommendation to start the MHMP programme as a slightly modified and updated version of the HRM proposal of 1994. The MHMP programme proposed envisages the development of a framework within which various software packages already available at MRCS, or packages that will be acquired, are to be incorporated and connected in a consistent manner.
The recommendations are a recognition of the need to develop an integrated set of tools, instead of the bits and pieces of software installed at MRCS until now. However, it would be advisable to combine such programme with well defined consultancy targets of the staff of MRCS. As an example, as part of the proposed institutional strengthening it would be advisable to upgrade the current forecasting system.
Particularly useful elements of such a programme are on-the-job training programmes, where staff of MRCS works with a variety of specialists in various topics related to data collection, data storage and retrieval, data processing, flood forecasting, flood control, river morphology, environmental management, water resources management and many other. The on-the-job training must be a well planned part of the project and should be complemented by short seminars given by the visiting specialists prior to the start of the implementation work.
Floods in subcatchments: example of the Vientiane Plain
Laos is a mountainous country with a land area of 236 800 km2 and a population of nearly 5 million. Over 80% of the population lives in rural areas, with rice production as the principal source of income. Only approximately 9% of the country is suitable for agricultural production. As this limitation puts much strain on the population living in the mountainous areas, the practice of slash-and-burn is increasing, with a decreasing number of years left between successive use of the land for cultivation. This practice is a highly damaging cause of deforestation and erosion. Laos is one of the poorest countries of Asia, with a gross national product of approximately US$ 260 per caput per annum.
The cultivable areas of Laos are mainly situated along the banks of the Mekong River. The level of protection against such floods, so far, is low. Floods are a yearly returning threat to the farmers cultivating their crops in the vicinity of the Mekong River.
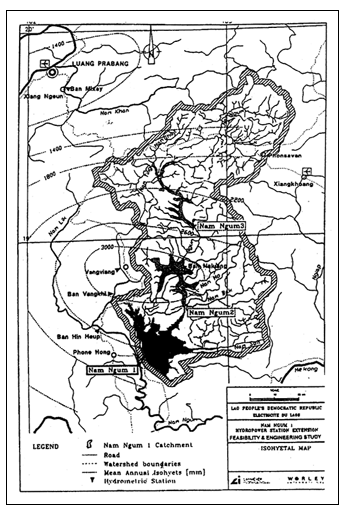
One of the most densely populated areas of the country is the Vientiane Plain, located North of the capital Vientiane, between the Nam Ngum I Reservoir (Figure 9) and the confluence of the Nam Ngum and Mekong Rivers. The area has a population of approximately 600 000 inhabitants and is one of the principal rice producing areas of Laos. This area was severely flooded in 1995.
In the past, the Vientiane Plain was frequently flooded, a situation which improved after the construction of the Nam Ngum Reservoir in 1971. However, a large part of the area is still threatened by floods. The extent of flood damage varies from year to year. The principal problem of floods is the restriction the farmers feel in selecting high yielding rice varieties. Consequently, a sustainable agricultural development of the area and a reliable food supply to the growing population of the Vientiane Plain is highly dependent on an improved flood control.
FIGURE 9
The Nam Ngum I catchment
The extent of 1995 flood damage was studied in large detail with the assistance of FAO. This study has led to the preparation of a flood depth map of the Vientiane Plain. The map, which is available at the MAF-DOI office, shows flood depths of 2–5 metres and in some depressions up to 8 metres. The flooded area shown is approximately 40 000 ha. The map clearly shows that there is hardly any flow from the Mekong into the Vientiane Plain, except, possibly, through back flow into the Nam Ngum.
It should be noted that the accuracy of the flood maps is limited, due to the lack of reliable topographic data of the Vientiane Plain. The underlying topographic maps date from 1960 and have a scale of 1:50 000. Levels, however, are not satisfactorily shown, as only 10 meter contour lines and a number of spot levels are given. The preparation of the flood maps was based upon interviews with the local population and the estimated flood depths at all spots investigated were plotted on the 1:50 000 scale topographic maps. In the same project, the flood damage was assessed, resulting in an estimated loss to assets and agricultural production of US$ 21 million.
For the flood several possible causes have to be mentioned:
high discharge from the Nam Ngum reservoir, which during the 1995 flood had a maximum inflow of 2 550 m3/s and a maximum outflow of 2 421 m3/s. The turbines passed 472 m3/s that day, whereas 1949 m3/s left the reservoir via the spillway at a reservoir level of 213.60 m above mean sea-level (masl). The catchment area upstream of the dam is 8 388 km2. The PMF for the dam has been estimated at 4 545 m3/s at a reservoir level of 214.83 masl;
high discharge from the Nam Lik river, which joins the Nam Ngum river just downstream of the Nam Ngum dam site with a catchment area of 5 212 km2;
additional local rainfall on the Vientiane Plain and the remaining part of the Lower Nam Ngum catchment, which has an area of 3 363 km2 of the total 16 963 km2 of the complete Nam Ngum catchment; and
high Mekong River levels, which impede drainage from the Vientiane Plain via the Nam Ngum River.
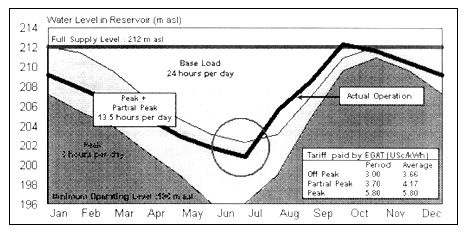
One of the factors that influenced the severity of the floods may have been the delayed opening of the Nam Ngum I spillway gates. So far, reservoir operation is only based upon the optimization of hydro-electric energy production. Yearly energy yield has an export value of US$ 20 million, partly as base energy supply and partly as peak energy. The higher priced peak power contracts make it interesting to keep the end of the monsoon reservoir levels as high as possible.
The export earnings gained from the hydropower production makes it difficult to give a balanced priority to the conjunctive use of the reservoir for flood control purposes. So far, a thorough evaluation of the role the reservoir operation has played on the generation of the flood damage has not been carried out to sufficient depth, simply due to a lack of understanding of the overall functioning of the system.
Hydropower and flood regulation
Hydro-electric power is an important export product of Laos. The exploitable potential of hydropower generation in Laos is 18 000 MW. Currently, only approximately 2% of this potential has been developed. However, the further development of the potential is expected to accelerate, as GOL has been signing contracts for the delivery of electricity to Thailand (1 500 MW by the year 2000) and Viet Nam (1 500 to 2 000 MW by the year 2010). In addition, the domestic energy consumption is growing at a rate of 8 to 10 percent annually.
Currently, the total installed hydropower capacity is 203 MW. The largest hydropower plant is Nam Ngum I, with an installed capacity of 150 MW. Of this, 30 MW was installed in 1971, working from the start at the full supply level of 202.50 masl. The plant was extended in 1978 with the installation of an additional 80 MW. The system was completed in 1984 by adding another unit of 40 MW.
Collection of data just upstream of the Nam Ngum dam site started in 1967. The hydrometric station was abandoned during the filling of the reservoir. Since 1971 the recorded reservoir outflows have been filed. Lahmeyer International converted the outflowing discharges into a series of inflowing discharges based upon the recorded reservoir levels and the reservoir geometry. Mean monthly discharges are reported to be reliable. A lower accuracy must be attached to the mean daily inflows generated.
The area of the Nam Ngum I reservoir is approximately 370 km2 at the level of 212 masl, which is nearly the same as the area of the Vientiane Plain flooded in 1995. In a very approximate way this leads to the conclusion that every additional meter of flood storage depth created in the reservoir, leads to a one meter reduction in flood depth on the Vientiane Plain. Of course, one must be very careful with such a conclusion, as the reduced flood depths also lead to reduced drainage capacities towards the Mekong River, so the effect of creating flood retention volume in the reservoir might be less than expected.
In the Vientiane Plain the situation is in fact even more complex, as an important contribution to floods is given by the discharges from the Nam Lik river. Moreover, floods are aggravated by the contribution of local rainfall. Such a complex system can only be studied thoroughly through simulations based upon a hydrodynamic modelling package and assuming that for such model development data of a reasonable quality are available.
Flood forecasting and simulation modelling for the Vientiane Plain
Although the existence of the reservoir is most likely beneficial to flood control, a modified operation might have prevented a substantial part of the damage. Such statements, however, can only be supported with the development of a thorough knowledge of the flood system through simulation of various scenarios by means of a hydrodynamic flood simulation model. The need for the development of this understanding is felt both in the Ministry of Industry and Handicrafts (MIH - Electricité du Laos) and in the Ministry of Agriculture and Forestry (MAF - Department of Irrigation). There appears to be a clear willingness to cooperate on this issue.
The development of the flood simulation model will have the following components:
The institutional arrangement requires the consensus of MIH and MAF on the establishment of a Flood Modelling Centre. One possibility might be to create the Centre at the Lao National Mekong Committee (LNMC) in Vientiane, with additional staffing provided by MIH and MAF. Currently, LNMC has a total staff of 11 of which: 3 irrigation engineers, 2 hydrologists, 1 civil engineer, 2 technicians and 3 in the administration. It is foreseen to extend the technical staff with 3 more members, funded by GOL. Training of this new and/or detached staff would have to get a high priority. Part of this training should be on-the-job training programmes under the supervision of international consultants. A close cooperation with MRCS would be possible and recommended.
The ToR would focus on the need to generate the understanding of the behaviour of physical and partly controlled process of flood wave propagation through the Vientiane Plain. The model would enable the study of various flood control mechanisms, including the construction of flood protection works, reservoir operation options. It would include a tool for the optimization of hydropower production and flood control. Preferably and if feasible, it should include rainfall-runoff modelling of the complete Nam Ngum catchment in order to support such reservoir optimization. The model should be extended to include flood forecasting along the lines described above. Full advantage of this model use and minimum losses in energy production could be achieved when the model would be complemented with a flood forecasting system for Nam Ngum I reservoir. If based on the same concepts as proposed for the Mekong flood forecasting system, the reservoir inflow forecasting system would not require the (impossible) installation of additional rain gauges in remote upstream locations.
The total package of modelling support, therefore, would include the following model components:
flood prediction model of the Vientiane Plain, for the study of the effects of flood propagation through the Plain as a result of the controlled and/or uncontrolled upstream discharges, Mekong levels and the flood control works which could be constructed in the Plain. The tools should preferably be those already in use at MRCS;
rainfall-runoff models of the catchments of the Nam Lik river and the Nam Ngum river upstream of the reservoir;
a flood forecasting model for the same catchments, set up along the lines described above;
a reservoir operation optimization component, based upon a global optimization technique, such as a genetic algorithm approach.
The set of tools would support the following types of studies:
further develop the understanding of the flood mechanism of the Vientiane Plain. This would also allow for a comparison of the floods occurring with and without the reservoir or the routing of other historic floods, such as the 1996 event;
compare various options of controlled flooding of the Vientiane Plain and prioritize these in terms of various options of protecting parts of the flood plain, e.g. construction of low dikes around the higher elevated parts, creation of storage areas etc.;
optimize the control of the spillway gates of Nam Ngum I by using historic records, possibly complemented with records generated through the used of the rainfall-runoff models fed with historic rains;
optimization of reservoir operation on the basis of real time control by implementing the flood forecasting model;
Apart from its function of supporting flood control studies, the modelling project should be seen as a necessary preceding action to support a Master Plan Study defining a staged development of the Vientiane Plain. Such development would require studies on partial flood control and possibly include controlled flooding concepts. Such developments can no longer be based upon an interative approach, without using the informatics and modelling support available nowadays. The Master Plan would be a logical follow-up to the “Nam Ngum River Basic Management” project, announced in 1996 by ADB.
One of the major problems encountered in setting up the modelling tools is the lack of accurate topographic data of the Vientiane Plain. The 10 m contour lines and the incidental spot levels are by no means sufficient to represent the storage and conveyance components of the system. Additional surveying is expensive. For the purpose of modelling, land level information on a grid of at least one point per ha would be required. Moreover, level and position of all sorts of dikes and roads in the area would have to be collected. This last information is rather easy to collect, especially with the current availability of DGPS.
Of late, these DGPS instruments can be mounted on a car or a motorbike and even in a back pack, which allows for travelling along roads and dikes crests. By continuous recording or by a stop-and-go method, the position can be stored continuously in terms of x-y-z co-ordinates. The method allows for an accuracy in the vertical level of a few centimetres. Total cost of the preparation of a digital terrain model of the Vientiane Plain for modelling purpose would be of the order of US$ 200 000, depending on how easy it is to get full access to the terrain. The data collected could be further processed to support agricultural development studies. However, for the combination with these studies the more accurate and flexible method of airborne laser altimetry is to be preferred. The cost of this process will most likely be two to three times higher.
Detailing of a ToR for a complete modelling project would require a separate mission. A rough estimate of the budget required is US$0.8 million for consultancy input, transfer of tools, training programmes and the additional collection of data. The study component of the project would provide Laos with a pilot investigation, which could be replicated at other flood-prone areas. Capacity building has to be an important element of the project. Laos has a strong need for capacity building.
Flood control: example of Bangladesh
Flood control in the flood plains of the Mekong Basin has already been applied on a substantial scale in Thailand. The primary reason for flood control is the protection of agricultural production. In larger river systems, with an often rather predictable time of arrival of the flood peak, the concept of controlled flooding has been introduced. Controlled flooding implies that flooding will be allowed, though at a lower frequency and at a time suiting better the cropping pattern. The principle behind it is the creation of a delay of the flood, so that usually the crops can be harvested before the area gets inundated.
Controlled flooding implies that in the case of extreme floods the waves still find storage for their dampening and show propagation. The unsetady flow equations describing the propagation of flood waves show us that the travel time of flood waves is a linear function of the storage available. Taking storage away makes the flood waves travel faster. The dampening of a flood wave peak is a quadratic function of the storage, due to the fact that slower travelling flood waves have a smaller length for a given wave period. It is primarily this smaller wave length along the river that leads to the increased dampening.
An interesting example of comprehensive flood control is the Flood Action Plan (FAP) of Bangladesh. On the basis of above principles, an analysis was made for the whole country regarding suitable measures against floods. In Bangladesh there are three principal causes of flooding:
floods caused by the effects of atmospheric depressions passing over the Bay of Bengal. These floods are very severe, can only be forecast with relatively short lead times and may cause many victims. Given the nature of the floods in this country, coastal defence works are too costly to cope with this problem;
floods caused by the flood waves coming down from the Himalayan mountains and propagating via the Ganges and the Brahmaputra Rivers. In some years these flood peaks coincide and cause severe flooding. The lead time in forecasting, however, is much higher than for the coastal floods and the number of victims is usually small. Dikes are often attractive investments to improve the agricultural production by reducing damage and by encouraging the farmers to plant higher yielding rice varieties;
flash floods of local origin, due to the high local rainfall intensities and depths.
One important difference in relation to other parts of the world where flood control measures were introduced is that Bangladesh has a very controlled approach to flood mitigation works. Whereas in the past, many areas of the world developed their flood control works on the basis of trial and error, the approach in Bangladesh has been much more planned, with design options continuously checked on the basis of model simulations.
Bangladesh experienced one of the most catastrophic river floods in 1988, immediately after the already high flood of the 1987 monsoon. The damage of the 1987 flood had hardly been repaired when most of the results of these efforts was lost again.
UNDP, World Bank and various donor countries joined efforts to launch a Flood Action Plan, with a budget of US$ 150 million. Of this fund, US$ 55 million would be directed to pilot projects for testing approaches, river bank protection and flood plain management.
In terms of planning of projects the country was at that moment already prepared, as in March 1987 the National Water Plan (NWP) had been concluded at the Master Plan Organization (MPO). The NWP had assembled a substantial amount of data and other information, developed a range of planning models and analytical tools and had recommended strategies and programmes. Many of these had already been adopted by the government and donor organizations.
One of the tools that had been developed at MPO was a suite of surface water simulation models. This project, funded by UNDP and executed under the supervision of the World Bank by the Danish Hydraulic Institute (DHI), had already produced a general model of the main river system in Bangladesh and a regional model of the South East Region. One of the objectives of the project had been the development of such regional models for the simulation of the effects and control of various flood control alternatives.
Another important objective of the project had been the development of local expertise in the use and development of such models. The project, therefore, had a clear capacity building component with the following elements:
Especially this last component of the project has been very useful and has partly explained the success of the group which, initiated in 1986, now has a staff of 42 local engineers and is in charge of all modelling support to water control and management projects in Bangladesh. It also is in charge of executing all modelling work related to flood forecasting in the country.
Bibliography
Bogardi, J.J., 1997. Report on the Review Mission of the Mekong Hydrology Programme, MRCS, Bangkok.
Cunge, J.A., Holly, F.M. and A. Verwey. Reprinted 1994 Practical Aspects of Computational River Hydraulics, Iowa Institute of Hydraulic Research.
DANIDA. 1997. Revised Proposal for Flood Forecasting and Effective Warning Dissemination in the Lower Mekong Basin.
Delft Hydraulics. 1989. Network Optimization in the Mekong Basin, Final Report.
Delft Hydraulics. 1991. Mekong Master Model, The Mekong Secretariat.
Hasan, M.R. 1996. Preparation of Flood Loss Prevention and Management Plan, Technical Report on Hydrology and Field Data Collection, FAO, Rome.
Hasan, M.R. 1997. Preparation of a Comprehensive Flood Loss Prevention and Management Plan for the Agricultural Sector, Report on Flood Plain Mapping and Flood Loss Prevention and Management, FAO, Rome.
Minns, A.W. 1998. Artificial Neural Networks as Subsymbolic Process Descriptors, Ph.D. Thesis, IHE - Balkema, Delft - Rotterdam.
MRCS. 1997. The Mekong Hydrology Model Package (Basinwide).
Somboune Manolom, Hydropower and the Environment, Lao PDR, International Energy.
Effects of reservoirs on floods
The purpose of a reservoir is usually to store water in the wet season and to increase downstream flows in the dry season
Every storage reservoir provides downstream flood control, whatever the purpose(s) for which the reservoir was built.
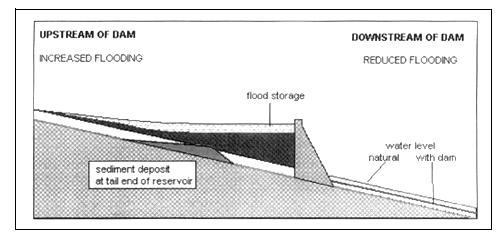
Reservoirs have a backwater effect which can worsen flooding along the river immediately upstream of the reservoir. With time the backwater effect becomes more severe due to the deposition of sediment at the tail-end of the reservoir. (See Figure 1.)
Low return-period floods, such as the annual flood, are often completely absorbed by the reservoir, without any downstream flooding.
FIGURE 1
Effect of reservoirs on floods, upstream and downstream of dam
Engelbertus Oud, Project Manager, and. Terence Muir, Senior Hydrologist,
Lahmeyer International, Frankfurt, Germany and Vientiane
People living downstreams of the dam become accustomed used to the new conditions and are often led to believe that floods are a thing of the past.
They start to encroach upon the flood plains, build houses and cultivate land, all in a false sense of security. If downstream flooding then occurs, the flood damage for the same rate of flow is much higher than before.
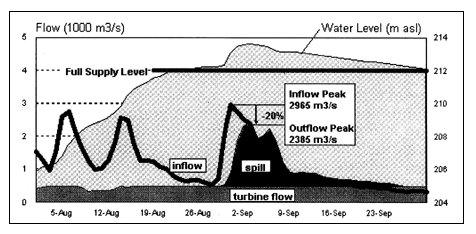
The flood retention effect of reservoirs, however, is limited and with increasing return intervals of the flood the reduction in flood flow in the downstream river decreases This is clearly illustrated in Figure 2, whereas Figure 3 shows that in 1995 the inflow peak at the Nam Ngum reservoir was only reduced by 20%.
FIGURE 2
Effect of reservoirs on flood peak downstream of dam
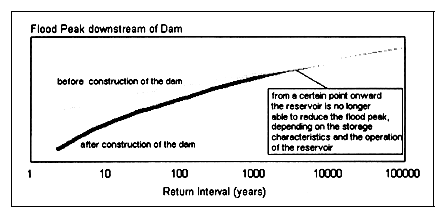
FIGURE 3
Operation of Nam Ngum during 1995 flood.
Flood control options associated with reservoirs
Reservoirs with dedicated flood storage zone
Maximize storage allocated to absorb flood waters.
If the flood storage has been wholly or partly filled by a flood, empty it as soon as possible, without causing downstream flood damage, to be ready to receive the next flood.
In cases with a flood forecasting system (only for larger river basins): if a major flood is expected, it may be meaningful, even if it causes downstream flooding and flood damages, to open the spillway gates prior to the flood wave arriving at the reservoir. The objective is to shave as much as possible of the flood peak in order to reduce flood damage to a minimum.
FIGURE 4
Nam Ngum operating policy 1995
FIGURE 5
Nam Ngum operating policy 1997 - with Nam Song
Reservoirs without dedicated flood storage zone
A reservoir primarily built for hydropower generation and operated to maximize the revenues from hydropower generation can be operated differently to reduce flood damages downstream.
Basically the present value of lost revenues from hydropower generation should be just compensated by the present value of prevented flood damage.
The problem is not to find the best reservoir operating rules - there are suitable computer programs which can do that, but rather a question of institutional arrangements and who pays for what.
FIGURE 6
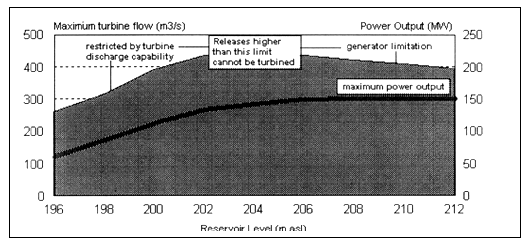
Nam Ngum hydropower characteristics
Conclusions and recommendations
Even when not operated for flood control, storage reservoirs regulate floods to a certain extent.
If a storage reservoir is a multi-purpose scheme and improved flood control is one of the objectives, then the benefits from flood control should just be sufficient to compensate for the loss of benefits for the other purposes. (Pareto optimality should be guaranteed).
Software is available to derive optimum operating rules for multi-purpose reservoirs.
There are important institutional problems to be resolved, especially if the dam is a non-Government undertaking. Specifically it should be known from where the dam owners and/or operators would obtain a reward for enhancing flood control.
It should be realized that the function(s) of a dam may change with time: a project primarily built for power, may one day primarily be used for irrigation water supply or flood control.
Final remarks
Reducing flood damage is not a task of all dams per se, but can be achieved in a variety of ways:
By demarcation of flood zones before and after construction of a dam project. Frequently flooded areas should be used as nature reserves or for grazing, no permanent buildings shall be built.
For areas which. after construction of the dam, are subject to infrequent, but severe flooding, it is worthwhile to install a flood warning system and to evacuate people, livestocks and valuable items from the area if a major flood is expected.
Cropping calendars can be adapted to the expected time of year and frequency of flooding events.
Buildings in area subject to frequent flooding can be built on stilts to avoid major flood damage in the buildings themselves.
Flood damage mitigation is a complex issue and all options, including changing the operation of reservoir projects must be compared with each other to identify the most efficient solutions.
Introduction
The Nile River is no doubt one of the great natural wonders of the world. With an estimated length of over 6 800 km and a total area of about 3.2 million km2 it is the longest river in the world and one of the five largest in terms of size of its drainage area. Yet, its annual runoff is more than modest as compared to other rivers in the world and the Nile River is quite unique in this respect as illustrated in Table 1.
TABLE 1
The Nile River in comparison with several other major rivers in the world
| River | Length [km] | Drainage area [km2] | Total annual runoff | |
| [km3] | [mm] | |||
| Nile | 6,825 | 3,112,000 | 84 | 27 |
| Amazon | 6,700 | 7,050,000 | 5,518 | 728 |
| Congo river | 4,700 | 3,820,000 | 1,248 | 326 |
| Mekong | 4,200 | 975,000 | 470 | 590 |
| Niger | 4,100 | 2,274,000 | 177 | 78 |
| Zambezi | 2,700 | 1,200,000 | 223 | 185 |
| Rhine | 1,320 | 224,000 | 70 | 312 |
| Mississippi | 970 | 3,270,000 | 562 | 170 |
The Nile Basin is shared by ten African countries - Burundi, Rwanda, Tanzania, Uganda, D.R. Congo (former Zaire), Kenya, Ethiopia, Sudan and Egypt - and its total drainage area represents one tenth of the African continent. A wide range of climates is found in the basin which ranges from 4° south to 31° north while its total annual runoff per unit area is extremely small. This is due to the fact that almost all the runoff in the Nile Basin is generated on an area covering only 20% of the basin, while the remainder of its drainage area is in arid or semi-arid regions where the runoff is minimal or zero and where evaporation and seepage losses are large.
The major runoff contributing areas in the basin are located in the Ethiopian Highlands of the Blue Nile sub-catchment and in the Equatorial Lake Plateau in Burundi, Rwanda, Tanzania, Kenya, D.R. Congo and Uganda of the White Nile sub-catchment with an average rainfall of well over 1 000 mm per year. Figure 1 depicts the Nile River basin while Table 2 provides some basic data on distribution of the basin over the ten countries, average rainfall in the basin area in each country and population.
Mihailo M. Andjelic, Food and Agriculture Organization of the United Nations,
Lake Victoria Water Resources Project, P.O. Box 521, Kampala, Uganda
FIGURE 1
Nile Basin with an Example of Spatial Rainfall Distribution over Basin as estimated by the Nile
Forecast Centre
TABLE 2
Distribution of the Nile Basin over the countries, average rainfall and population
| Country | Total country area [km2] | Area in the Nile Basin [km2] | As % of the Nile Basin area | As % of the total country area | Rainfall in the basin [mm/year] | Population in 1995 (millions) |
| Burundi | 27,834 | 13,260 | 0.4 | 47.6 | 895–1,570 | 6.34 |
| Rwanda | 26,340 | 19,876 | 0.7 | 75.5 | 840–1,935 | 8.33 |
| Tanzania | 945,090 | 84,200 | 2.7 | 8.9 | 625–1,630 | 30.74 |
| Kenya | 580,370 | 46,229 | 1.5 | 8.0 | 505–1,790 | 27.89 |
| Congo | 2,344,860 | 22,143 | 0.7 | 0.9 | 875–1,915 | 43.51 |
| Uganda | 235,880 | 231,366 | 7.4 | 98.1 | 395–2,060 | 20.41 |
| Ethiopia | 1,100,010 | 365,117 | 11.7 | 33.2 | 205–2,010 | 55.04 |
| Eritrea | 121,000 | 24,921 | 0.8 | 20.4 | 540–665 | 3.00 |
| Sudan | 2,505,810 | 1,978,605 | 63.6 | 79.0 | 0–1,610 | 28.96 |
| Egypt | 1,001,450 | 326,751 | 10.5 | 32.6 | 0–120 | 58.52 |
| Total | 8,889,534 | 3,112,369 | 100.0 | 35.0 | 282.74 |
The arid zone starts in Sudan, the biggest country in Africa, which can roughly be divided into three rainfall zones: the extreme south of the country with rainfall ranging from 1 200 to 1 500 mm per year; the fertile plains with rainfall between 400 and 800 mm per year; and the vast desert area in the northern part of the country, where rainfall averages only 20 mm per year. Further north, in Egypt, rainfall falls to less than 20 mm per year.
In the text that follows more information is given about the importance of the Nile water for the basin countries as well as the description of several technical cooperation projects and activities executed within the FAO Nile Program which are addressing some of the many water resources and flood management issues in the Nile river basin.
The role of Nile water resources in the basin countries
For some countries in the Nile Basin, such as the D.R. Congo for example, the Nile waters form only a small part of their total water resources. Other Nilotic countries, as Rwanda, Uganda, Sudan and Egypt, are almost completely dependent on the Nile Basin for their water resources. While all the water in Burundi and Rwanda and more than half of the water in Uganda is generated inside the countries' borders, most of the water resources of Sudan and Egypt originate outside their national boundaries. As shown in Table 3, about 77% and 97% of water resources of Sudan and Egypt, respectively, originate from upstream basin areas outside their national borders.
TABLE 3
Water resources and water availability per inhabitant in the Nile Basin countries (FAO, 1993)
| Country | IRWR1 (km3/yr) | ARWR2 (km3/yr) | Dependency ratio in % | IRWR per inhab. (m3/inhab) | ARWR per inhab. (m3/inhab) |
| Burundi | 3.6 | 3.6 | 0.0 | 579 | 563 |
| Rwanda | 6.3 | 6.3 | 0.0 | 833 | 792 |
| Tanzania | 80.0 | 89.0 | 10.1 | 2733 | 2998 |
| Kenya | 20.2 | 30.2 | 33.1 | 739 | 1069 |
| Zaire | 935.0 | 1019.0 | 8.2 | 21973 | 23211 |
| Uganda | 39.2 | 66.0 | 40.9 | 1891 | 3099 |
| Ethiopia | 110.0 | 110.0 | 0.0 | 2059 | 1998 |
| Eritrea | 2.8 | 8.8 | 68.2 | 815 | 2492 |
| Sudan | 35.0 | 88.5 | 77.3 | 1279 | 3150 |
| Egypt | 1.8 | 58.3 | 96.9 | 29 | 926 |
1 IRWR: Internal renewable water resources
2 ARWR: Total actual renewable water resources
A threshold figure of 1 000 m3 of water available per inhabitant per year is often used to flag attention to a condition of water scarcity. As the figures in Table 3 show, the most Nilotic countries are rather close to water stress, if not already stressed. Since water resources are a fairly constant datum, it is predictable that water availability per capita is going to decrease with increasing population given the current rapid population rise in the Nile countries and projections for the future. For instance, while the world's total population currently increases by 1.5% annually, most of the Nile Basin countries grow twice as fast. As a result, the Basin population is expected to double every 30 years. Thus, the current population of 280 million people may well exceed 600 million by the year 2025. Table 4 presents figures on present and projected (by the year 2020) future water consumption in the Nile Basin countries.
TABLE 4
Present and predicted future (2020) water consumption in the Nile Basin
| Country | Present Consumption (bcm/yr) | Future Consumption (bcm/yr) | ||||
| Domestic | Industrial | Agricult. | Domestic | Industrial | Agricult. | |
| Burundi | 0.04 | 0 | 0.06 | 0.1 | 0 | 2.74 |
| Rwanda | 0.04 | 0.01 | 0.1 | 0.07 | 0.01 | 0.82 |
| Tanzania | 0.1 | 0.02 | 0.36 | 1.1 | 0.21 | 0.92 |
| Kenya | 0.35 | 0.08 | 0.18 | 1.04 | 0.18 | 0.31 |
| Zaire | 0.4 | 0.18 | 0.12 | 1.23 | 0.63 | 0.05 |
| Uganda | 0.06 | 0.02 | 0.12 | 0.24 | 0.12 | 3.97 |
| Ethiopia | 0.24 | 0.07 | 1.9 | 1.26 | 0.96 | 33.2 |
| Eritrea | - | - | - | - | - | - |
| Sudan | 0.74 | 0.15 | 16.82 | 1.5 | 1 | 26.8 |
| Egypt | 2.96 | 6.52 | 49.73 | 3 | 8.3 | 54.4 |
| Total | 5.1 | 7.05 | 69.39 | 9.54 | 11.41 | 123.21 |
(Source: Nile 2002 Conference series)
One of the most compelling challenges of populations in the Nile Basin is no doubt poverty and the imperative to economic development. The economies are heavily depended on agriculture, which accounts for more than half of the Gross Domestic Product and employs more than 80% of the workforce. However, a lack of water supply infrastructure, the variability of the climate, and poor cultivation practices have seriously restrained economic growth.
Due to the economic importance of agriculture, water plays a key role for the economic future of the Nile Basin. However, current water consumption already equals water supply, and future water demands are physically untenable and this accentuates the importance of a basinwide, integrated water management in the Nile Basin; in fact, this is an inevitable necessity. The basis for lasting and sustainable water use agreements can only be established by considering the river as a whole, not as a set of fragments.
Moreover, since healthy economic growth is the ultimate goal of all Nile states, water use agreements should not just seek to allocate water; rather, they should facilitate the creation of efficient markets of food and energy and stimulate environmentally-sound industrial and economic growth. Such agreements, however, are not in place as of yet; they can be negotiated only after each country has assessed and weighted the economic and other benefits and impacts of various water development and management strategies accuring to themselves and to the other Nile partners. Pre-requisite elements in this process are the existence of:
an institutional co-operative framework;
adequate water resources monitoring network;
a geo-referenced data base and information system including hydro-meteorological, water demand, operational real-time and other data necessary for the water resources planning and management process;
shared-vision planning, water resources modelling and management support tools; and
the technical expertise to use them in an effective manner.
FAO technical assistance programme in the Nile Basin
Towards this end, within the framework of its technical assistance programme FAO - in cooperation with various Nile Basin countries, several research institutions, donors and international organizations - is addressing some of the above pre-requisite elements and water resources issues in the Nile Basin. In particular, it has been assisting the Nile Basin countries in:
developing a monitoring, forecasting and simulation system of the Nile River and a control/decision support system to manage the High Aswan Dam reservoir in Egypt;
capacity building in the Nile Basin countries to (1) facilitate adoption of adequate, well harmonized national water policies in the participating Nile Basin States; (2) institutional strengthening and training in legal, organizational and technical issues related to integrated river basin management and the allocation of trans-boundary water resources; and (3) development GIS-based database and other tools;
establishing and strengthening the technical capacity in the Lake Victoria countries (Kenya, Tanzania and Uganda) to monitor water resources in the Lake Victoria basin and developing modelling tools for sustainable regionally coordinated water resources planning and management in the Lake Victoria sub-basin.
Monitoring, forecasting, simulation and decision support system of the Nile River in Egypt
Being almost entirely dependent on the Nile River water for its socio-economic development, Egypt embarked in early 1990s on a comprehensive program aimed at increasing water use efficiency and reduction of water losses through better planning and, in particular, management of the High Aswan Reservoir. The programme also included implementation of a FAO technical assistance project entitled Monitoring, Forecasting, Simulation and Decision Support System (MFS) of the Nile River in Egypt which has been implemented since 1991 with financial support of the US Agency for International Development. Major objectives of the MFS Project in Egypt include:
establishment of a viable system for real-time monitoring in the Nile Basin;
development of a forecasting model for a short, medium and long-term (seasonal) forecasting of Nile inflows into the High Aswan Dam (HAD) reservoir;
development of a control-simulation decision support system (DSS) for optimizing operation and management of HAD reservoir;
establishment of a Nile Forecast Centre within the Ministry of Public Works and Water Resources (MPWWR).
Within phase I of the MFS project (1991–1993) the following outputs have been achieved: (1) a functional physical facility for the File Forecast Centre was provided by the MPWWR; (2) Meteosat Primary Data User System (PDUS) for real-time satellite monitoring of the Nile Basin was installed and fully operational; (3) Meteorological Data Distribution (MDD) system for receiving real-time raw synoptic meteorological data and weather analysis/ forecasting products installed and operational; (4) four workstations for data processing, forecasting and simulation of hydrological and meteorological processes in the Blue Nile Basin was installed and made operational; (5) PDUS, MDD and four IBM workstations were integrated into an Ethernet based Local Area Network for transfer of data and information; (6) a Nile Forecast System was developed, installed, tested and started to be used in operational mode; and (7) a number of Egyptian engineers trained and assigned on regular duty to the Nile Forecast Centre.
FIGURE 2
Flow regime at the Hydrological Profile Dongola of the Nile River (control profile for forecasting
inflows into High Aswan Reservoir)
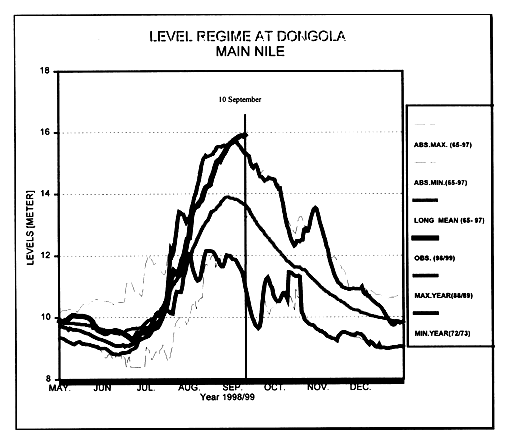
FIGURE 3
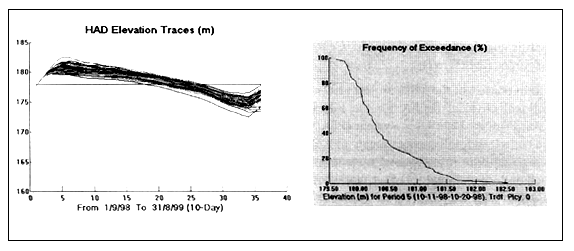
An example of HAD elevation traces and probability of excedance for a given water release
policy, as estimated by HAD Decision Support System
Building on achievements of the MFS Phase I, Phase II of the project (1994–1995) concentrated on improvement of the overall performance and capability of the Nile Forecast Centre in Cairo and its Forecasting System by:
expanding initial monitoring, forecasting and simulation system to the White Nile and the Sobat and Atbara Rivers and thus to the whole Nile River Basin;
establishing a comprehensive hydro-climatic data base and file retrieval system for the whole Nile Basin;
providing better and more powerful data monitoring and processing facilities;
improving lead-time and accuracy of forecasts by adding quantitative precipitation forecast capability and improving Extended Stream-flow Prediction (ESP) algorithm; and
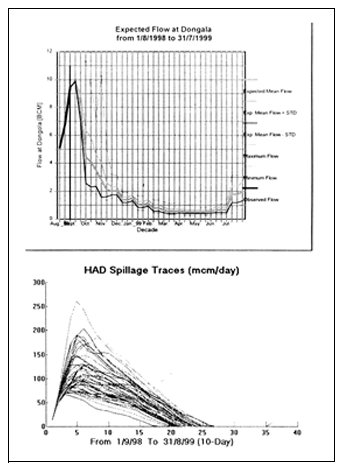
adding a Control and Decision Support System (DSS) of crucial importance for better management of the HAD reservoir; HAD DSS is using the traces of forecasted inflows into the reservoir as its major input and then simulates and quantifies the HAD reservoir response to different water release policies aimed at reaching the following major objectives: (a) to satisfy water demand for irrigation; (b) to optimize power generation of the HAD hydropower station, and (c) avoid spillage. Thus, the DSS provides a number of products concerned with HAD response, such as elevation traces and probability of excedance of different reservoir levels, energy production, spillage traces and probability, the best release policies given the forecasts of inflow, etc.
FIGURE 4
An example of predicted inflow into HAD and
spillage traces for a given water release policy
The Nile Forecast Centre and its MFS and Decision Support Systems have become fully operational in Egypt since 1995 and proved to be of great benefit for the country.
Lake Victoria water resources project
Land and water resources of the Lake Victoria basin constitute one of the main development potentials in Kenya, Tanzania and Uganda. The area is densely populated and there is a pressing need for irrigation in dry areas of Kenya and Tanzania and for urban, rural and industrial water supplies in all three countries. Uganda needs an undiminished flow of water from the Lake Victoria basin for power generation at the Victoria Nile. Each Lake Victoria country is placing, with slight variations in the emphasis and scope, a high priority on water resources development in the Lake region in order to satisfy rapidly increasing demand for irrigation to increase food production, domestic and industrial water supply and hydropower production. Major natural and anthropogenic disturbances of the Lake basin water balance can change the water level and flow regime with serious effects the scope of which is unknown or not completely understood and is yet to be properly investigated and quantified. Lake Victoria is also the source of the Victoria Nile and thus the subject of keen interest by downstream countries.
TABLE 5
Lake Victoria surface area, shoreline and basin area per country
| Country | Lake surface area | Shoreline | Tributary basin | |||
|---|---|---|---|---|---|---|
| [km2] | [%] | [km] | [%] | km2] | [%] | |
| Kenya | 4,113 | 6.0 | 550 | 17.0 | 38,913 | 21.5 |
| Tanzania | 33,756 | 49.0 | 1,150 | 33.0 | 79,570 | 44.0 |
| Uganda | 31,001 | 45.0 | 1,750 | 50.0 | 28,857 | 15.9 |
| Rwanda | 0 | 0 | 0 | 0 | 20,550 | 11.4 |
| Burundi | 0 | 0 | 0 | 0 | 13,060 | 7.2 |
| Total | 68,870 | 100.0 | 3,450 | 100.0 | 180,950 | 100.0 |
Lake Victoria has a surface area of about 69 000 km2 shared by three countries, with a land drainage area of slightly over 181 000 km2 in five countries (Table 5). The mean depth is about 40 m with a recorded maximum depth of 84 m, and the volume of water stored is estimated at about 2 760 km3.
Lake Victoria moved into the focus of attention in the 19th century, when it was first identified as one of the sources of the Nile. Because it has a control structure for a large hydropower plant at its Oven Falls outlet, the Lake is classified as a very large reservoir. Hydrologically, however, the Lake behaves like a closed system, as can be seen from the estimated water balance components in Table 6.
TABLE 6
Lake Victoria water balance components
1965–1990
| Water balance component | Volume | Lake level equivalent |
| [km3] | [m] | |
| Lake rainfall | 125 | 1.81 |
| Lake evaporation | 110 | -1.60 |
| Lake net rainfall | 14.5 | 0.21 |
| Catchment rainfall | 293 | n.a. |
| Catchment evaporation | 270 | n.a. |
| Inflow from catchment | 23 | 0.34 |
| Net basin supply | 37.5 | 0.55 |
| Outflow at Owen Falls | 38 | -0.57 |
It takes about 73 years for a volume of water equivalent to the Lake to flow out of it. Historically, somewhat above average rainfall in the early 1960s resulted in a sudden rise in water level of 2 m and extensive shore flooding. Since then, the lake level has receded to historic averages but rose again, quite significantly, in the first half of this year as a result of El Nino. Limnologically, the Lake is monomictic and primary productivity is high.
The water balance of the Lake Victoria has been the subject of substantial scientific scrutiny, largely in an attempt to explain the significant and sudden rise in water levels in the early 1960s. Yet, the results of a number of water balance studies and the early 1960s phenomena cannot be still considered conclusive; this is mainly due to a rather poor insight into the rainfall and, partly, evaporation regime over the Lake surface which are by far the largest components of the Lake water balance as demonstrated in Table 6. An adequate explanation of the perennial ‘Lake rainfall puzzle’ could radically change current conventional wisdom about the major causes of the Lake's water level fluctuations and, thus, significantly influence all current and future plans for water resources management in the Lake Victoria basin.
On the other hand, the much needed water resources monitoring network and information system, as well as mathematical modeling tools for water resources planning and management are unavailable. This introduces a high degree of uncertainty in the planning and management process, which practically hinders productive cooperation in the region while viable options for an environmentally sustainable regionally coordinated water resources development in the Lake basin have been, and still remain, distant and unclear.
Lake Victoria Water Resources project (LVWRP) is in response to some of the above needs. It's a regional project funded by Japan, executed by FAO, and being implemented since January '96 in the three riparian countries of the Lake Victoria - Kenya, Tanzania and Uganda. In a nutshell, the LVWRP is implementing in the Lake Victoria region (a) a limited in scope water resources monitoring network; (b) a geo-referenced water resources data base and information systems; (c) mathematical modelling tools and decision support system in support of a harmonized, regionally coordinated water resources planning and management in the Lake Victoria region; and (d) training and technology transfer.
The project with its limited resources is in the process of establishing (a) a limited network of 17 key water resources monitoring stations in the Lake basin - a meagre replacement for a once operational but now defunct historic hydrometric network in the region established in 1970s; (b) remote sensing facilities and processing hardware/software for reception of Meteosat image data, storage, image processing and satellite-based rainfall estimation over the whole Lake region; (c) a geographically referenced data base system loaded with a number of spatial data layers and historical hydrological and climatological time series; (d) a distributed, GIS-based modelling and decision support system of the Lake Victoria region; and (e) a water demand database with estimates of present and future projections of water use and demand in the region on the basis of an analysis and compilation of data from the existing documentation and planning documents without possibility to embark on a detailed and more reliable studies of water use and demand in various sectors of economy in the three countries of the region. Lastly, the regional governing body of the project - the Project Steering Committee - is mandated to serve as a transitional arrangement for coordinating water management activities among the three East African countries pending the formulation of more complete organizational framework (a Lake Victoria Authority) for sustainable planning and management of the Lake Victoria water and other resources.
Decision Support System
One of the key outputs of the project is a water resources planning/management decision support system (DSS) of the Lake Victoria basin; it is a user friendly modelling system which integrates all other components and outputs and provides a versatile tool to managers and decision makers in the Lake Victoria region. The development of the Lake Victoria decision support system is a collaborative effort of FAO and its Lake Victoria Water Resources Project, and the Georgia Water Resources Institute (GWRI) at the Georgia Institute of Technology, in Atlanta, Georgia.
The decision support system is being developed in accordance with the following guiding principles:
The DSS should be a “shared vision” system, able to capture all relevant information pertaining to the management decisions, and represent it in a form that the users can intuitively appreciate;
The role of the DSS will be to assist the Lake Victoria Partners in their efforts to formulate mutually-agreed upon management strategies. As such, it should have the ability to generate trade-offs among the various water uses, and assess the gains and costs of various development and management scenarios.
The Lake Victoria Partners should be able to continue to utilize and develop the DSS technology under a changing environment.
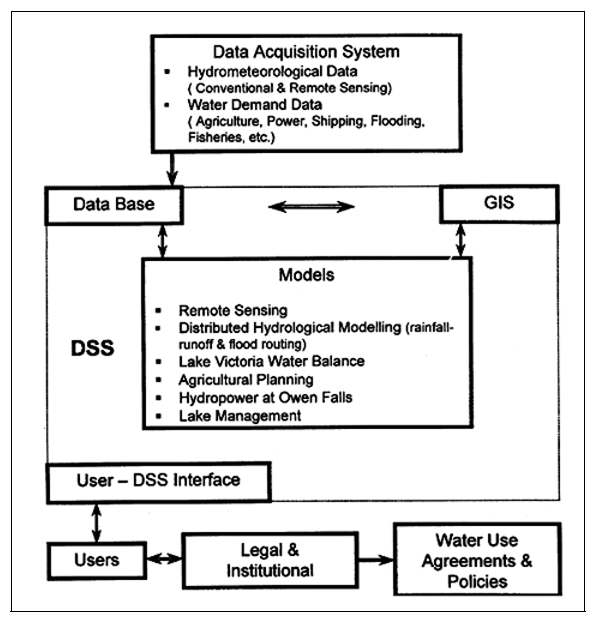
The decision support system components being developed within the LVWRP (Figure 5) can be grouped in the following general categories: (1) water resources monitoring network and remote sensing; (2) water demand component; (3) geo-referenced database system; (4) water availability component; and (5) integrated water management component.
FIGURE 5
Lake Victoria Decision Support System
Integrated Water Management based on Lake Victoria DSS aims at (a) integrating the water availability and water demand products into a comprehensive, “shared-vision,” decision support system, and (b) establish a framework within which the Lake Victoria Partners can assess the impacts of various development and operational scenarios and formulate mutually agreed upon management strategies.
Nile Basin Water Resources Project
The project “Operational Water Resources Management and Information System in the Nile Basin Countries” or shorter “Nile Basin Water Resources Project” (NBWRP) is being implemented with FAO technical assistance and funding from Italy. It aims at strengthening regional coordination and at increasing the capacity of Nile Basin countries to negotiate joint management, equitable sharing and utilization of water resources and environmental protection of the Nile Basin. The participating countries are Burundi, D.R. Congo, Ethiopia, Kenya, Rwanda, Sudan, Tanzania and Uganda.
Outputs being achieved within the project can be summarized as follows:
strengthening water development and management institutions in each country with communication facilities and equipment as needed for reinforcing national and regional coordination in the Nile Basin;
capacity building in the fields of water policy, international water law and negotiation;
establishment of a Nile Basin GIS unit in each country with equipment, trained staff and a basic database;
capacity building in mathematical modelling in each country for analysing alternative development scenarios using simulation and optimization models;
upgrading of meteorological and hydrological data base and remote sensing capabilities for acquisition and use of improved data in water resources planning.
The major thrust of the project is to improve technical capabilities of the Nile riparians in planning equitable and profitable use of trans-boundary water resources, including legal and management aspects, and in assessing relevant socio-economic and environmental implications of water resources development and management in the Nile Basin. To this end, the project already completed (a) assessment of countries' needs in capacity building on water policy; (b) development of a program on water policy and related legal and institutional capacity building based on the assessed needs; (c) a number of national and regional capacity building workshops on trans-boundary policy, international water law and river basin organizations, on improvement of skills concerned with water resources project identification, prioritization, cost/benefit assessment, poverty alleviation impact, international cooperation, joint benefit and other issues which need to be addressed in the run-up to actual investment.
The basic rationale of the project's efforts is to raise awareness and prepare the Nile Basin riparians for future cooperation in utilizing the shared and scarce water resources of the Nile River in an integrated, equitable and sustainable manner.
Keeping in mind that many Nile Basin countries are already close to water stress (Table 4), such a cooperation is inevitable, both on the basin wide and the sub-basin levels; the above three projects being implemented within FAO technical assistance programme in the Nile Basin are to be considered as essential building blocks in achieving such a goal.
Some new positive winds in the nile basin
Owing partly to the achievements described above, some new and positive winds started to blow in the Nile Basin in the past several months of 1998 - with the emergence of Nile Basin Initiative, and the so-called D3 project in the Nile Basin.
These new initiatives are raising new expectations of the riparians for better future cooperation in the Basin and will briefly be discussed below.
Nile Basin Initiative
The Nile Basin Initiative (NBI) was recently launched by the World Bank (WB) and the Council of Ministers (COM) of Water Affairs of the ten riparian states of the Nile Basin - Burundi, Democratic Republic of Congo, Egypt, Eritrea, Ethiopia, Kenya, Rwanda, Sudan. Tanzania, and Uganda - to promote cooperation and development in the Nile Basin. This initiative has evolved from previous or ongoing co-operative work in the Nile Basin but in 1998 these efforts took a historic step and further evolved to include all ten riparians of the Nile as equal members. The current Nile Basin Initiative is operating under a transitional arrangement which includes the COM representing Water Affairs Ministers from the ten riparian states, and a Technical Advisory Committee consisting of two technical experts from each of the ten countries, and a small Secretariat.
The Nile Challenge. The NBI recognizes that the Nile is one of the world's greatest rivers and is of inestimable value for all of its people. Yet, Nile remains one of the least developed rivers in the world, and half of the Nile riparians rank among the 10 poorest countries in the world. Sustainable development and management of the Basin, therefore, presents a great challenge - at the heart of which is the imperative to alleviate poverty.
A Strategic Action Programme. The NBI is motivated by a shared vision to achieve sustainable socio-economic development through equitable utilization of, and benefit from, the common Nile Basin water resources. As a first step towards realizing this vision, the Nile Basin states are now in the process of formulating a strategic action programme which consists of two complementary subprograms: the “Shared Vision Program” and the “Subsidiary Action Programs”. The Shared Vision Program will promote the shared vision through a limited, but effective, set of basin wide activities and projects aimed at creating an enabling environment for investments and action on the ground within a basin-wide framework (such as the FAO Nile Basin Water Resources Project); it has, however, to be nourished by concrete actions on the ground which provide tangible benefits and meet the needs of the people of the riparian countries. The Subsidiary Action Programs are planned to comprise of actual development projects at the sub-basin level, involving two or more countries, formulated within the basin wide framework (such as the FAO Lake Victoria Water Resources Project). The World Bank, in cooperation with UNDB, CIDA and FAO, has agreed to play a lead role in coordinating the inputs of external agencies to finance and implement projects proposed within the strategic action program of the Nile Basin Initiative. The first such consultative meeting, proposed as the International Consortium for Cooperation on the Nile (ICCON) is tentatively planned to be held in the spring of 1999.
The Nile Basin Cooperative Framework (D3 Project)
The basic objective of this recently launched UNDP-funded project is to enable Nile Basin states to determine equitable entitlements for each riparian country for the consumptive and non-consumptive use of the Nile waters, and to enhance and promote the utilization of the Nile for optimum sustainable socio-economic benefits of people living in the Basin.
To this effect, the project is expected to:
provide recommendations for appropriate multi-disciplinary framework for legal and institutional arrangements of water resources development in the Nile Basin;
recommend process, methodology and activities which will lead to the determination of equitable and legitimate rights of water use in each riparian country.
The project is being implemented through a Panel of Experts (POE) of the Nile Basin, and Study Teams selected from among the members of POE which are to implement legal, institutional and basin wide data sub-components.
Bibliography
Acres International Limited, 1998. Hydrology of the Victoria Nile.
Andjelic M. M., Attia B., 1991. Hydrological Forecasting: Basin Notions and Role in National; Egyptian Water Resources Journal, Cairo.
Andjelic M. M., Attia B., 1992. Monitoring, Forecasting and Simulation Project Started Moving Faster; Water Resources Journal, Cairo.
Andjelic M. M., 1993. Nile Forecast Center and its Monitoring, Forecasting and Simulation System; Proceedings from the Nile 2002 Conference, Aswan, Egypt.
Andjelic, M. M., Attia B., Barrett C., 1993. Satellite Based Distributed Operational Hydro-meteorological Forecast System for the Nile River; Proceedings from the Nile 2002 Conference, Aswan, Egypt,
Ehlin Consulting, 1997. Lake Victoria Basin - National Resource under Stress; Report for SIDA from a Fact Finding Mission to Kenya, Tanzania and Uganda, April 1997, Main Report, Publications on Water Resources No. 11:1
FAO, 1995. Lake Victoria Environmental Management Programme, Task Force II, Final Report by the FAO Regional Consultants on Tasks 11, 16 and 17 (Water Quality, Land Use and Wetlands)
Georgakakos A. P., Andjelic M.M., 1998. A Decision Support System for Lake Victoria; Nile 2002 Conference, Kigali.
Georgakakos, A. P., Yao H., 1995. A Decision Support System for the High Aswan Dam Reservoir; School of Civil and Environmental Engineering, MPWWR, FAO, USAID, GIT/CEE-HYDRO-1995-1.
Georgakakos A. P., Yao H. et al, 1998. Lake Victoria Decision Support System Version 1.0, Georgia Water Resources Institute and Georgia Institute of Technology; GWRI/GIT-98-2.
Institute of Hydrology; A Review and Update of the Water Balance of Lake Victoria in East Africa, IH/ODA Report No. 93/3
JICA, 1987. Lake Basin Development Authority, Kenya; The Study of Integrated Regional Development Master Plan for the Lake Basin Development Area, Final Report.
Klohn W., Andjelic M. M., 1997. Lake Victoria: A Case in International Cooperation; In Lakes and Reservoirs: Research and Management, ILEC.
Permanent Tripartite Commission for East African Cooperation; Draft Treaty for the Establishment of the East African Community
Secretariat of the Commission for East African Cooperation 1996. East African Cooperation Development Strategy Paper (1997 – 2000), EAC/C6/3/96
Statement from EAC Secretariat; Arrangements for Tripartite Cooperation in Water Resources Management in the Lake Victoria Basin under the Aegis of the East African Cooperation
Uganda Water Action Plan, Water Resources Development and Management, Main Report, WAPDOC 005, July 1994, Directorate of Water Development, Uganda
World Bank, 1996. Kenya, Tanzania, Uganda, Lake Victoria Environmental Management Project: Project Document, Report No. 15541-AFR, Global Environment Division, Environment Department
World Bank, 1998. Draft Outline of Strategic Action Plan for Support of Uganda as Part of the Nile Basin Initiative.
![]()
![]()
![]()
