![]()
![]()
![]()
Food consumption and nutrition
Nexus between hunger and poverty
Demand and supply at 2015/2030
Prospects for agricultural production
During the 31 years 1965-1996 (the Green-Revolution period), developing-countries per caput food consumption increased by 28 percent; from 2053 to 2626 kcal/person/day (Table 1). Increases for South Asia and East Asia were respectively 20 and 43 percent - the latter being the highest among the world's regions and sub-regions. Between 1980 and 1997, developing-world under-nourishment declined by 11 percentage points (FAO, 2000a) - with the bulk of that decline in Asia. In East and Southeast Asia, the percentage of undernourished population decreased from 29 to 13, and in South Asia from 38 to 23 (Table 2) (FAO, 2001b).
Table 1: Per caput food consumption (kcal/person/day)
|
Country Grouping |
1964/66 |
1995/97 |
2015 |
2030 |
|
World |
2357 |
2761 |
2960 |
3100 |
|
Developing countries |
2053 |
2626 |
2860 |
3020 |
|
South Asia |
2013 |
2424 |
2790 |
3040 |
|
East Asia |
1953 |
2783 |
3020 |
3170 |
|
Industrial countries |
2945 |
3374 |
3490 |
3550 |
Source: Agriculture: Towards 2015/2030, FAOTable 2: Undernourished population (percentage, developing regions)
|
Region |
Percentage undernourished |
||
|
1979-81 |
1990-92 |
1996-98 |
|
|
Sub-Saharan Africa |
37 |
35 |
34 |
|
Near East and North Africa |
9 |
8 |
10 |
|
East and Southeast Asia |
29 |
17 |
13 |
|
South Asia |
38 |
26 |
23 |
|
Latin America and the Caribbean |
13 |
13 |
11 |
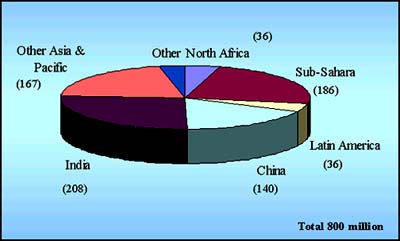
Source: FAO, CFS: 2001/2Notwithstanding these significant declines, A-P R continues to be home to two-thirds of the world's malnourished people - with India home to one-fourth of them (Figure 1).
Mortality rates for children under five provide a good indicator of the nutritional status both the children and of their mothers. In 1998, child-mortality rate in developing countries was 13 times that of OECD countries (Table 3). Malnutrition is acknowledged to be the major cause of child mortality in developing countries. The child-mortality rate in developing countries declined by 14 percent between 1990 and 1998, against a targeted decline of 30 percent; declines in East Asia and Pacific and in South Asia were respectively 22 and 26 percent.
Figure 1: Undernourishment (numbers of persons, by region)
Source: SOFI 2000, FAOTable 3: Mortality (per l000) children under five; (selected years: 1970-98)
|
Region |
1970 |
1980 |
1990 |
1997 |
1998 |
Reduction |
|
East Asia & Pacific |
126 |
82 |
55 |
46 |
43 |
22% |
|
Europe & Central Asia |
n.a. |
n.a. |
34 |
29 |
26 |
24% |
|
Latin America & Caribbean |
123 |
78 |
49 |
41 |
38 |
24% |
|
Middle East & North Africa |
200 |
136 |
71 |
58 |
55 |
22% |
|
South Asia |
209 |
180 |
121 |
100 |
89 |
26% |
|
Sub-Saharan Africa |
222 |
188 |
155 |
153 |
151 |
3% |
|
Developing countries |
167 |
135 |
91 |
84 |
79 |
14% |
|
OECD |
26 |
14 |
9 |
6 |
6 |
30% |
Source: World Bank Statistical Information Management and Analysis (SIMA) database.The distribution (WHO Global Database on Child Growth) of the numbers of underweight, stunted, and wasted children (0-5 years) indicates that in 2000 the developing-countries total number of underweight (low weight-for-age) children was 149 million or 27 percent - ranging from 3.2 percent in South America to 44 percent in South-Central Asia.
Note: n.a. = Not Available
Between 1980 and 2000, stunting decreased (globally) from 221 million (47 percent) to 182 million (32.5 percent). Southeast Asia experienced the strongest decline, followed by South Asia and South America. South-Central Asia has the highest prevalence of children underweight and stunting; because that sub-region has very high population, it accounts for about one-half of the global total of malnourished children. More than half of South Asia's young children suffer from protein-energy malnutrition - about five times the prevalence in the Western hemisphere, at least three times the prevalence in the Middle East, and more than twice that of East Asia.
There are gender as well as rural-urban divides in nutritional attainments. Female children face gender bias in the allocation of food: the nutritional status among girls, particularly in South Asia, is inferior to that of boys. Similarly - and primarily due to higher poverty and illiteracy - rural-area children are more malnourished than their urban counterparts. These divides have implications for the inter-linkages of social, economic, biological, and physical sciences.
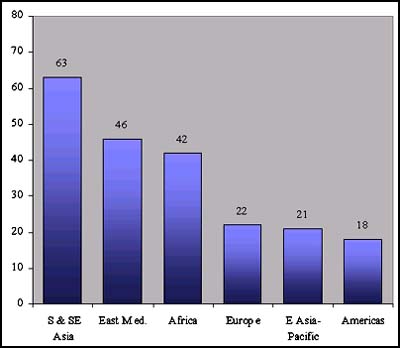
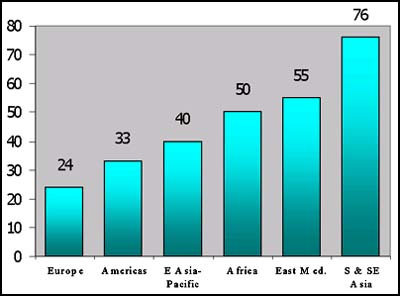
Micro-nutrient deficiencies - as well as calorie and protein malnutrition - are severe in Asia, causing serious health and human-development problems. Nutritional deficiencies of iron, iodine, and Vitamin A are major concerns in South and Southeast Asia; rickets and zinc and selenium deficiencies are additional concerns in some areas. Anemia, caused mainly due to iron deficiency, is most prevalent in South and Southeast Asia, where 76 percent of pregnant woman and 63 percent of pre-school children are anemic (Figure 2). In Bangladesh, India, Myanmar, and Nepal, more than 70 percent of pregnant women are anemic, and South Asia accounts for about 50 percent of the world's anemic women (WHO, 1999; FAO, 1998a). Babies of anemic women are more likely to be born prematurely, to be underweight, or to die as newborns or to remain anemic if they survive; thus by their very birth they compound their nation's health and development problems. Although not well appreciated, besides the depressed overall physical and mental ability, there is a devastating effect on economies: in South Asia alone there is an estimated total annual loss of $ 5 billion (ACC/SCN and IFPRI, 2000).
Two hundred million people in the world suffer from goiter. In addition, 6 million have cretinism (severe mental retardation). About half of these are reportedly in South and Southeast Asia. Nepal, Indonesia, Bhutan followed by Myanmar, Sri Lanka, Bangladesh, India, Mongolia, as also China, Thailand and South Korea have high incidence of iodine deficiency. Children born to mothers with goiter, on attaining adulthood, are likely to be 10 percent less productive than the children born to mothers without goiter (Gillespie and Haddad, 2000). Iodized salt intake has fortunately caught up rather fast and has been effective in reducing iodine deficiency. Agricultural approaches such as dipping potassium iodate into irrigation water and genetic manipulation for efficient absorption of iodine by crops could greatly supplement the other efforts in managing the deficiency.
Figure 2: Anaemia: pre-school children and pregnant women (by region, 1999)
Source: ACC/SCN and IFPRI, 2000Although the incidence of severe Vitamin A deficiency is declining, as many as 125 million children are currently at risk in South and Southeast Asia. A recent report reveals that in Bangladesh 0.62 percent of school children and 2.7 percent of pregnant women suffer from night blindness. Massive Vitamin-A dosing programmes have been instrumental in fighting the malady. While this approach must continue, there is need to strengthen production and consumption of Vitamin A-rich foods.
There is a strong link between poverty and food insecurity. As seen from Table 4, during the period from 1987 to 1998, as the incidence of poverty fell in Asia and the Middle East-North Africa, the prevalence of undernourishment concurrently declined. South Asia, which in 1998 had 522 million people with incomes less than US $ 1 a day, 44 percent of the world's people in this category, also had the largest number of undernourished people, 294 million, over 39 percent of the world's hungry people. National incomes (measured by per caput GNP) are lowest in the countries where undernourishment is high (Figure 3). It is a matter of concern to note that during the last decade of the 20th century, there is a negligible improvement in per caput incomes in those countries that have over 20 percent of their population undernourished. Therefore, the twin objectives of the World Food Summit (WFS) and the UN Millennium Summit of halving undernourishment and poverty by 2015 are highly interconnected and interdependent.
Table 4: Poverty and undernourishment compared
|
Region |
1998 |
1996-98 |
1996-98 |
1998 |
|
People living in households that consume less than $1/day |
Share undernourished |
Number of undernourished |
Number of poor |
|
|
(percent) |
(percent) |
(million) |
(million) |
|
|
South Asia |
39.99 |
23 |
294.2 |
522.00 |
|
East Asia |
15.32 |
12 |
155.0 |
278.32 |
|
Eastern Europe and Central Asia |
5.14 |
6 |
26.4 |
23.98 |
|
Latin America and the Caribbean |
15.57 |
11 |
54.9 |
78.16 |
|
Middle East and North Africa |
1.95 |
10 |
35.9 |
5.55 |
|
Sub-Saharan Africa |
46.3 |
34 |
185.9 |
290.87 |
Source: FAO, CFS, 2001/2Figure 3: GNP per caput (1995 $ US) by prevalence of undernourishment
Source: World Bank, World Development Indicators, 2000It is projected that per caput food consumption in developing countries will increase to 2860 and 3020 Kcal in 2015 and 2030, respectively (see Table 1). In South Asia the corresponding figures are 2790 and 3040 Kcal. In East Asia, the figures are still higher at 3020 and 3170 Kcal. These increases would lead to a further significant drop in the share of persons undernourished: to 10 percent in 2015 and 6 percent in 2030 for the developing countries, to 10 percent and 4 percent for South Asia and to 7 percent and 4 percent for East Asia (Table 5). However, due to demographic growth, in absolute numbers, globally the decrease of persons undernourished will be to 576 in 2015 and 401 million in 2030 from 790 in 1995/97; for Asia to 309 in 2015 and 168 million in 2030 from 524 in 1995/97. Likewise, Asia's share of persons undernourished in the world will decrease from 66 percent in 1995/97 to 42 percent in 2030. Thus, the Asian countries are not too far from meeting the target set at the World Food Summit in 1996. However, as the things stand today, largely due to the unsatisfactory situation in Sub-Saharan Africa, the WFS goal of halving the number of undernourished persons no later that 2015, will only be reached toward 2030 (Figure 4) (FAO, 2000b).
Table 5: Undernourishment: developing countries
|
Region |
Million persons |
Percent of population |
||||
|
1995/97 |
2015 |
2030 |
1995/97 |
2015 |
2030 |
|
|
Developing countries |
790 |
576 |
401 |
18 |
10 |
6 |
|
South Asia |
284 |
165 |
82 |
23 |
10 |
4 |
|
East Asia |
240 |
144 |
86 |
13 |
7 |
4 |
Source: Agriculture: Towards 2015/2030, FAOFigure 4: Undernourishment (million of persons)
Source: SOFI 2000, FAOThe latest FAO analysis of the State of Food Insecurity in the World (FAO, 2001a) reveals that the world is further slipping away from the target rate of reduction of undernourished people. Continuing at the current rate, it would take more than 60 years to reach the target. In the Asia-Pacific Region, the number declined from 565 million in 1990-92 to 497 in 1997-99: an average annual reduction rate of 9.7 million against the target figure of 11.2 million. Performance of the individual countries, however, varied widely (Table 6). In 1990-92, India, with 215 million and China with 198 million, had the largest concentration of undernourished in the world. Seven years later, in 1997-99, while China had lessened by 77 million its total of hungry, India had added 11 million to its total.
Table 6: Undernourishment: Asia-Pacific region
|
Region/Sub-region/country |
Number of people |
Proportion of |
|||
|
1990-92 |
1997-99 |
1990-92 |
1997-99 |
||
|
Developing world |
816.3 |
777.2 |
20 |
17 |
|
|
Asia and the Pacific |
564.8 |
497.1 |
20 |
16 |
|
|
East Asia |
197.6 |
126.9 |
16 |
10 |
|
|
|
China |
192.6 |
116.3 |
16 |
9 |
|
|
DPR Korea |
3.4 |
8.8 |
17 |
40 |
|
|
Mongolia |
0.8 |
1.0 |
34 |
42 |
|
Oceania |
0.9 |
1.2 |
24 |
26 |
|
|
|
Papua New Guinea |
0.9 |
1.2 |
24 |
26 |
|
Southeast Asia |
77.6 |
65.9 |
17 |
13 |
|
|
|
Cambodia |
4.3 |
4.6 |
43 |
37 |
|
|
Indonesia |
16.7 |
12.0 |
9 |
6 |
|
|
Lao PDR |
1.2 |
1.4 |
29 |
28 |
|
|
Malaysia |
0.6 |
0.4 |
3 |
- |
|
|
Myanmar |
3.9 |
3.2 |
9 |
7 |
|
|
Philippines |
16.0 |
17.2 |
26 |
24 |
|
|
Thailand |
16.9 |
12.9 |
30 |
21 |
|
|
Viet Nam |
18.0 |
14.2 |
27 |
19 |
|
South Asia |
288.8 |
303.0 |
26 |
24 |
|
|
|
Bangladesh |
39.2 |
44.1 |
35 |
33 |
|
|
India |
214.6 |
225.3 |
25 |
23 |
|
|
Nepal |
3.5 |
5.0 |
19 |
23 |
|
|
Pakistan |
26.5 |
24.4 |
25 |
18 |
|
|
Sri Lanka |
5.0 |
4.3 |
29 |
23 |
Source: SOFI, 2001, FAO
Food demand in developing countries is essentially a function of population growth and income increase. As regards population, with 4.44 billion people in 1995/97, developing countries accounted for 77 percent of the world population (Table 7). In 2030, the proportion will increase to 83 percent with an estimated population of 6.7 billion. South and Southeast Asia together will continue to account for more than 50 percent of the world's population, 53 and 52 percent towards 2015 and 2030, respectively, although the rates of growth will decelerate considerably, especially in East Asia. Given the high base level population and not-so-low growth rate, the share of South Asia in the world's population will increase from the current level of 22 percent to 24 percent in 2030, annually adding 19 million towards 2015 and 16 million people towards 2030. The corresponding increments for East Asia were 16 and 9 million. During the next 30 years, nearly one billion additional people will be added to the population of South, Southeast and East Asia, and half of this addition will take place in India and China.
Table 7: Population: current and projected
|
Region |
1995/97 |
2015 |
2030 |
Growth rate % |
||||
|
million |
% of world |
million |
% of world |
million |
% of world |
1995/97 - 2015 |
2015-2030 |
|
|
World |
5745 |
100 |
7154 |
100 |
8112 |
100 |
1.2 |
0.8 |
|
Developing countries |
4436 |
77 |
5778 |
81 |
6718 |
83 |
1.4 |
1.0 |
|
South Asia |
1251 |
22 |
1651 |
23 |
1915 |
24 |
1.5 |
1.0 |
|
South East Asia |
1800 |
31 |
2133 |
30 |
2307 |
28 |
0.9 |
0.5 |
Source: Agriculture: Towards 2015/2030, FAOGrowth in per caput income (GDP) in Asian sub-regions between 1995/97 and 2015 and between 2015 and 2030 ranged from 3.6 to 5.7 percent and was generally higher than the corresponding growth for the developing countries as a whole (Table 8). This growth will greatly help in reducing poverty level in the region and maintain a fairly high demand for food and agricultural products, with potential to reduce undernourishment.
Table 8: GDP growth (%/ann)
|
Region |
Total GDP |
Per caput GDP |
||
|
1995/97 - 2015 |
2015 - 2030 |
1995/97 - 2015 |
2015 - 2030 |
|
|
World |
3.1 |
3.6 |
2.0 |
2.7 |
|
Developing countries |
4.8 |
5.4 |
3.4 |
4.3 |
|
South Asia |
5.1 |
5.1 |
3.6 |
4.0 |
|
East Asia |
5.8 |
6.3 |
4.9 |
5.7 |
Source: Agriculture: Towards 2015/2030, FAOOther important features of the demographic shift are the increased proportion of youth, and rapid urbanization. By the year 2010, 50 percent of the population in Asia will be below age 25. Since agriculture will continue to be the main source of employment in the region during the next 25 years, effort must be made to render the agricultural profession both intellectually attractive and economically rewarding so that young persons shall engage in agricultural production and transformation,
Another major demographic shift will be that the urban population will swell to 53 percent of the total population in 2030, from the current level of 34 percent. This shift will cause a significant change in the food basket, necessitating enhanced consumption and production of high value commodities such as animal products, including fish, horticultural products and edible oils. Moreover, to feed the cities, the proportion of marketed grain, processed food and other food products will expand rapidly, necessitating much greater emphasis on food processing, value addition, transport infrastructures, sound market institutions and on peri-urban agriculture.
An analysis of the changes in the commodity composition of food by country groups brings out the relative emphasis to be given between crops and animal production systems in the sub-regions. The data given in Table 9 indicate that in developing countries the use of cereals as food will stabilize at around 178 kg/person/year. In South Asia it will increase from 169kg/person/year in 1995/97 to 192 kg/person/year in 2030, but the reverse is the trend in East Asia, dropping from 194 kg to 187 kg. The relatively higher cereal consumption (as human food) in South Asia may be ascribed to the predominance of vegetarians and to relatively slower rate of urbanization in the sub-region as compared with that in East Asia. The share of pulses in South Asia - a main source of protein and an important group of crops in crop rotation - is expected to decrease, which is a set back from the points of view of nutrition and soil fertility. But the intake of animal products, particularly meat in East Asia and milk and dairy products in South Asia, and of vegetable oils and oilseeds is expected to increase by 80 percent in the two sub-regions. Among meat products, poultry will grow at high rates throughout the region, especially in India, while pig production will particularly be high in China and other East Asian countries.
Table 9: Composition of food (by commodity and major country groups)
|
Commodities |
Developing countries as a whole |
South Asia |
East Asia |
||||||
|
1996 |
2015 |
2030 |
1996 |
2015 |
2030 |
1996 |
2015 |
2030 |
|
|
Cereals, food |
172 |
178 |
178 |
169 |
186 |
192 |
194 |
193 |
187 |
|
Roots and tubers |
65 |
69 |
74 |
21 |
26 |
30 |
63 |
62 |
63 |
|
Sugar |
20 |
23 |
25 |
24 |
29 |
33 |
11 |
14 |
16 |
|
Dry pulses |
6.9 |
6.8 |
6.8 |
10.6 |
9.1 |
8.0 |
|
|
|
|
Veg. oils, oilseeds and oil products |
9.4 |
12.4 |
14.8 |
8.5 |
11.9 |
14.6 |
8.6 |
12.2 |
15.3 |
|
Meat (carcass wt.) |
23 |
30 |
34 |
5.5 |
8.2 |
11.8 |
33 |
47 |
55 |
|
Milk and dairy, excl. butter |
42 |
53 |
67 |
59 |
81 |
116 |
10 |
14 |
19 |
|
Total food (Kcal/person/day) |
2626 |
2860 |
3020 |
2424 |
2790 |
3040 |
2783 |
3020 |
3170 |
Source: Agriculture: Towards 2015/2030, FAOA livestock revolution is underway in the developing countries, particularly in Asian countries, with profound implications for crop-livestock balance, nutrition, income and the environment. Asia had registered the highest growth rate in the world in livestock production in the past decades and is projected to maintain this trend towards the year 2030 (Table 10). South Asia, in particular, will register much higher growth rates, 3.2 percent against 1.7 percent for the world as a whole. East Asia will also maintain a high growth rate particularly during 1997-2015. The projected production growth-rate of livestock is double of that of cereals.
Table 10: Livestock production growth (% ann)
|
Region |
1987-97 |
1995/97 - 2015 |
2015 - 2030 |
|
World |
1.8 |
1.7 |
1.4 |
|
South Asia |
4.3 |
3.2 |
3.2 |
|
East Asia |
8.9 |
2.6 |
1.6 |
Source: Agriculture: Towards 2015/2030, FAODespite the high production growth rate, Asia is and will further be a major net importer of livestock products for meeting the fast-growing demand. South Asia, which consumes relatively smaller quantities of meat, from its current status of a marginal net exporter, is expected to turn into a minor net importer of meat, 80 000 tons in 2015 to 310 000 tons in 2030. The sub-region will further intensify its relatively high level of milk and dairy products consumption by enhancing its net import from 0.6 million tons in 1995-97 to 1.9 million tons in 2015 and 4.8 million tons in 2030. East Asia's net imports will also greatly expand. The current net animal meat import of 0.24 million tons will increase ten-fold to 2.5 million tons in 2015 and fifteen-fold to 3.6 million tons in 2030. As regards milk and dairy products, the already high current net import of 6.7 million tons will grow to 11 million tons in 2015 and 15 million tons in 2030 (FAO, 2000a).
In developing Asia, small farmers who constitute nearly 80 percent of all farming and households and practising integrated farming systems, account for the bulk of livestock production. This trend is likely to continue in the foreseeable future. The insufficient supply of fodder and feed has been a major bottleneck in enhancing livestock productivity in the region. Moreover, frequent natural disasters in the Asia-Pacific region have high depressing effects on livestock population and productivity.
Fisheries and aquaculture contribute significantly to food security in the Asia-Pacific region. The region produces almost 90 percent of the aquaculture products of the world and 52 percent of the capture fisheries products (1998) (Table 11). Between 1988 and 1998, the Asia Pacific production of total fisheries increased by about 27 million tons, while in the rest of the world it declined by 10 million tons. The production increases of 11.4 percent annually in aquaculture in the region were particularly notable. The developing Asia-Pacific countries are net exporters of fish and fish products, annually amounting to over US$9 billion during the late 1990s.
Table 11: Fish catch and supply (million tons/ann)
|
Fish supply |
Asia-Pacific region |
Rest of the world |
||||
|
1988 |
1998 |
GR (%/an) 1988-98 |
1988 |
1998 |
GR (%/an) 1988-98 |
|
|
Marine capture |
31.2 |
38.0 |
2.0 |
51.3 |
40.3 |
-2.2 |
|
Inland capture |
2.9 |
4.9 |
5.5 |
3.3 |
3.1 |
-0.6 |
|
Aquaculture |
9.3 |
27.1 |
11.4 |
2.4 |
3.7 |
4.6 |
|
Total |
43.4 |
70.0 |
- |
57.0 |
47.1 |
- |
Source: Agriculture: Towards 2015/2030, FAOFish make up more than 50% of animal protein in most countries of the region; additionally, they provide nutritional benefits such as calcium, vitamin A, omega-3 fatty acids and iodine; deficiencies in these entities are highly detrimental to the physical and mental development of all people, especially children. Greater recognition must therefore be given to the nutritional role of fish for the poor, especially those living on and near the coast and other water bodies. Fish and other aquatic resources, even when eaten in small quantities, often have a defining role in nutritional security, and it is this security that is most threatened as the natural supplies disappear. Fish should be added adequately in FAO and other world food models and outlook to obtain a more complete picture of food availability and nutritional adequacy.
Cereals and oilcrops are the main group of crops which are consumed both by humans and animals, and allocation of these commodities to livestock is likely to grow faster than in the past. Based on the cereal balances (rice, wheat, and coarse grains) in the production and demand scenario (Table 12), it is seen that in South Asia demand growth will outstrip production growth by 0.1 percentage point up to the year 2030; whereas in East Asia demand will outpace production by 0.2 percentage point up to the year 2015, and will break even afterwards. As regards oilseeds, oilcake and oil: in South Asia consumption will exceed production by 0.7 percentage points up to the year 2015, after which it will even out (Table 13). But in East Asia a gap of 0.3 percentage point will persist up to 2030. The projected production and consumption growth rates for oilseeds and vegetable oils in the region are about 80 percent higher than those for cereals.
Table 12: Cereal: growth in demand, production, and human population (% ann)
|
Region |
Demand |
Production |
Population |
|||
|
1997-2015 |
2015-2030 |
1997-2015 |
2015-2030 |
1997-2015 |
2015-2030 |
|
|
World |
1.4 |
1.1 |
1.4 |
1.1 |
1.2 |
0.8 |
|
South Asia |
2.0 |
1.3 |
1.9 |
1.2 |
1.5 |
1.0 |
|
East Asia |
1.4 |
0.9 |
1.2 |
0.9 |
0.9 |
0.5 |
Source: Agriculture: Towards 2015/2030, FAOTable 13: Vegetable oils/products: production and consumption growth (%/ann)
|
Region |
Total food use |
Production growth rate |
Consumption growth rate |
||
|
1995/97 |
1995/97 - 2015 |
2015 - 2030 |
1995/97 - 2015 |
2015 - 2030 |
|
|
World |
62.9 |
2.1 |
1.9 |
2.2 |
1.9 |
|
South Asia |
10.6 |
2.5 |
2.4 |
3.2 |
2.4 |
|
East Asia |
15.6 |
2.3 |
1.9 |
2.6 |
2.2 |
Source: Agriculture: Towards 2015/2030, FAOBy year 2030, world cereal production shall need to increase to 2.8 billion tons: an addition of nearly 1 billion tons (Table 14). Of this increment, nearly half will be for food, and about 44 percent for feed, with the balance 6 percent for seed, industrial non-food use and other uses. In South, Southeast, and East Asia, cereal production is expected to increase by 380 million tons (based on milled rice), from 720 million tons in 1995/97 to 1100 million tons in 2030. Comparing the sub-regions, South Asia is expected to register an increase of 73 percent, whereas East Asia (including Southeast Asia) is expected to register an increase of 44 percent. Non-food use of cereals in South Asia is currently about 10 percent and is expected to increase slightly to 12 percent towards 2030. But in East Asia (the non-food use proportion - fuelled by the increased livestock and associated feed demands) is much higher: 33 percent in 1995/97 and 45 percent in 2030.
Cereals demand is expected to outstrip production both in South and East Asia, the self-sufficiency rate in South Asia falling from 97 to 94 percent and in East Asia from 94 to 90 percent over 1995/97 - 2030 (Table 14). In order to close the gaps between local production and consumption, South Asia which is currently a net importer of about 1 million tons of cereals, will become a net importer of 16 and 26 million tons in 2015 and 2030, respectively (Table 15). East Asia which is already a high net importer of 37 million tons of cereals, will be enhancing its net import to 60 and 79 million tons in 2015 and 2030, respectively. Most of this increase will occur in China - primarily for meeting the increasing demands for animal feed. The bulk of this increase will consist primarily of coarse grains, particularly maize, as in 1995/97 nearly 79 percent of the use of maize grain in China was for non-food purposes, mostly as feed. After its entry into WTO, China's import of rice is likely to increase.
Table 14: Cereal: balance (million ton/ann) of demand and production
|
Years |
Demand |
Production |
SSR* % |
|
|
Food |
All Uses |
|||
|
World |
||||
|
1995/97 |
979 |
1844 |
1836 |
100 |
|
2015 |
1257 |
2393 |
2397 |
100 |
|
2030 |
1428 |
2801 |
2805 |
100 |
|
Developing countries |
||||
|
1995/97 |
765 |
1107 |
996 |
90 |
|
2015 |
1029 |
1550 |
1352 |
87 |
|
2030 |
1197 |
1886 |
1615 |
86 |
|
South Asia |
||||
|
1995/97 |
211 |
235 |
227 |
97 |
|
2015 |
306 |
343 |
327 |
95 |
|
2030 |
368 |
418 |
392 |
94 |
|
East Asia |
||||
|
1995/97 |
348 |
526 |
493 |
94 |
|
2015 |
413 |
683 |
624 |
91 |
|
2030 |
432 |
787 |
708 |
90 |
*SSR = Self Sufficiency Rate = Production/Demand (all uses)Table 15: Cereals: net trade (million ton/ann)
Source: Agriculture: Towards 2015/2030, FAO
|
Region |
19965/97 |
2015 |
2030 |
|
Developing countries |
-107 |
-198 |
-270 |
|
South Asia |
-1 |
-16 |
-26 |
|
East Asia |
-37 |
-60 |
-79 |
Source: Agriculture: Towards 2015/30, FAO
Agricultural production as a whole at the global level has kept pace with demand. Had there been greater demand, world agriculture would have positively responded to meet the demand. Three main factors were responsible for the limit on the demand side: (a) the slow down in population growth, (b) a growing share of world population has attained fairly high levels of per caput food consumption, and (c) the undernourished were too poor to purchase more food or were too resource-poor to produce more food. The existing situation and projected trends of these factors suggest a slowing of demand. On the other hand, the production side will be greatly influenced by the per caput availability of material and other production resources, the levels of various yield gaps, overall environmental conditions, new technologies, appropriate policies, and nature and quality of socio-economic settings.
As seen from Table 16, demand growth rates for the world, the developing countries, South Asia and East Asia have declined during the period 1997-2015 when compared with those during 1977/1997. This deceleration was in line with population growth rates during the two periods. Production growth at the global level matched the demand growth rates. For the developing countries as well as for South and East Asia the demand growth marginally outstripped production growth. The decrease over the two periods was most pronounced in East Asia, primarily due to the trend in China; the demand growth rate dropping from 4.8 percent in 1977-97 to 1.9 percent in 1997-2015 against corresponding production growth rates of 4.7 and 1.8 percent.
Table 16: Growth (5/ann) in aggregate demand, production, and human population
|
Region |
Demand |
Production |
Population |
|||
|
1977-97 |
1996-2015 |
1977-97 |
1996-2015 |
1977-97 |
1996-2015 |
|
|
World |
2.1 |
1.6 |
2.1 |
1.6 |
1.6 |
1.2 |
|
D'v'p'ng countries |
3.7 |
2.2 |
3.6 |
2.1 |
2.0 |
1.4 |
|
South Asia |
3.3 |
2.6 |
3.3 |
2.5 |
2.2 |
1.5 |
|
East Asia |
4.8 |
1.9 |
4.7 |
1.8 |
1.5 |
0.9 |
|
idem, excl. China |
3.5 |
1.9 |
3.2 |
1.9 |
1.8 |
1.2 |
Source: Agriculture: Towards 2015/2030, FAOBy 2030, total agricultural production in the developing countries is projected to be 87 percent higher than in 1995/97, while the projected increase for meat is 120 percent and for crops 75 percent. By 2030, the developing countries will account for 72 percent of world crop production, up from 66 percent in 1995/97 and 53 percent in 1961/63.
As regards crop production, during the 30-year period 1967 to 1997, the developing countries registered a satisfactory crop production growth rate of 3.1 percent (Table 17). East Asia, with a growth rate of 3.6 percent, played the eminent role in pushing the global average. South Asia, with a growth rate of 2.8 percent, also performed well. During the succeeding 34-year period, the growth will slow down to 1.2 percent in East Asia but will maintain a moderate rate of 1.9 percent in South Asia.
Table 17: Growth (%/ann) in crop production
|
Region |
1967-1997 |
1995/97 - 2030 |
|
South Asia |
2.8 |
1.9 |
|
East Asia |
3.6 |
1.2 |
|
All Developing Countries |
3.1 |
1.6 |
|
Industrial Countries |
1.4 |
0.8 |
|
World |
2.2 |
1.3 |
Source: Agriculture: Towards 2015/2030, FAOThere are three sources of growth in crop production: (i) arable land expansion (ii) increase in cropping intensity and (iii) yield growth. Yield growth will account for 83 percent of production growth in Asia, whereas the net area expansion will contribute only 5 percent and the remaining 12 percent will be through the increase in cropping intensity (Table 18). In other words, 95 percent of the crop production growth in Asia will accrue through crop intensification, while in other regions net area expansion will be contributing between 20 to 30 percent. As regards individual major crops, more than 80 percent of the growth in wheat and rice production in the developing countries will have to come from gains in yield, whereas for maize the area expansion will be an equally important source, even more so than in the past. In Asia, for wheat and rice, there will be negligible or zero net area growth (even negative in some major producing countries), thus yield growth will be the exclusive source of production growth. Since intensification is closely linked with use of new and modern technologies - albeit in conjunction with indigenous technologies and knowledge, science and technology development in Asia-Pacific region will be called upon to play a still greater role than in the past.
Table 18: Proportionate Sources of growth in crop production
|
Region |
Arable land expansion |
Increase in cropping intensity |
Yield increases |
|||
|
1961-1997 |
1995/97 -2030 |
1961-1997 |
1995/97 - 2030 |
1961-1997 |
1995/97 - 2030 |
|
|
South Asia |
7 |
5 |
14 |
12 |
79 |
83 |
|
East Asia |
26 |
5 |
-6 |
12 |
80 |
83 |
|
All developing countries |
24 |
20 |
5 |
11 |
71 |
69 |
Source: Agriculture: Towards 2015/2030, FAO
![]()
![]()
![]()