![]()
![]()
![]()
Undernutrition and malnutrition exist as part of the complex and widespread problem of poverty and deprivation that affects millions of people in Asia. Major improvements in the nutritional situation are suggested in recent assessments of trends in malnutrition from FAO and WHO, with many countries successfully addressing them. These new data show some improvement world wide, but at a substantially slower rate in the last few years than during the 1980's. This slow down is a cause for concern, being contrary to the commitments of the goals from the World Summit for Children of 1990 and the ICN of 1992, of halving the prevalence of malnutrition between 1990 and 2000. The current and achievable challenge therefore is to build upon and accelerate the progress registered in Asian countries. As supplement to the overview of the region in global perspective furnished in the introduction, this section examines some countries to identify regional trends in nutrition and related indicators followed by an exploration of Asian prospects into the next century and beyond 2000.
Economically, Asia and the Pacific remains a fast growing region, with a GDP growth rate of almost 8 per cent. Although it experienced noticeable declines in infant and child mortality, the total numbers of chronically undernourished people is increasing, as is shown in Figure 2. These contradictory trends in development flow from the Asia and Pacific region being home to nearly three-fourths of the world's poor (UNDP 1997). The short- and long-term consequences of poverty and malnutrition among children are reflected in the three anthropometric measures of underweight, wasting and stunting, shown in Table 3 below. Stunting is measured as height for age, under-weight as weight for age and wasting as weight for height. Whether compared to age or height, loss of weight among children reflects a cumulative process of poor growth that can be modified, as children experience weight gains due to greater access to food or the absence of diarrhoea related diseases and other health problems.
| Table 3. Wasted, Stunted and Underweight Children, 1990 | ||||||
| Wasted | Stunted | Underweight | ||||
| Region | per cent | number | per cent | number | per cent | number |
| Developing countries | 9 | 48 | 41 | 215 | 34 | 179 |
| East and South East Asia | 5 | 9 | 33 | 60 | 24 | 42 |
| South Asia | 17 | 27 | 60 | 93 | 58 | 91 |
| Economic Group | ||||||
| Middle-to high-income countries | 6 | 8 | 29 | 40 | 22 | 31 |
| Low income countries | 10 | 40 | 45 | 175 | 38 | 148 |
| Source: The Sixth World Food Survey (Rome: FAO) 1996a. | ||||||
In 1990, one third of children aged 5 years and under in developing countries were underweight in contrast to more than half in South Asia, more than a third in low income countries and about one fourth in East and South East Asia. Half of the underweight children in developing countries live in South Asia. The prevalence of underweight shown in Figure 5 below highlights the wide variation among Asian countries, with high levels in the most populous LIFDCs of South Asia, in contrast to South East Asia.
Figure 5. Underweight Prevalence among Children under Age 5 Years (per cent)
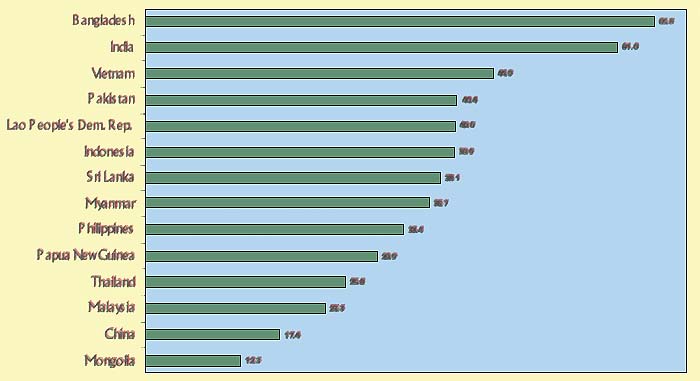
Source: The Sixth World Food Survey (Rome: FAO) 1996.
Wasting is relatively less prevalent, being experienced by nearly ten per cent of children in developing countries, as shown in Table 3 above. In contrast, wasting is experienced by 17 per cent of South Asian children, 10 per cent in low income countries, and 5 per cent in East and South East Asia. Half of the underweight children in developing countries live in South Asia, in contrast to 56 per cent of the wasted children. The data shown in Figure 6 highlights the disparities among Asian countries in this regard, and accents the prevalence in South Asian LIFDCs in contrast to East Asia.
Figure 6. Wasting Prevalence among Children under Age 5 Years (per cent)
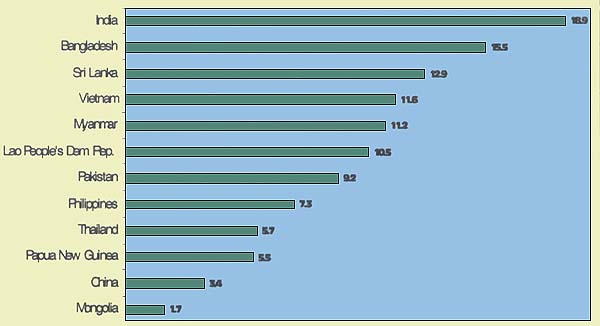
Source: The Sixth World Food Survey (Rome, FAO) 1996.
Data shown in Table 3 indicates that the prevalence of the stunting is higher than underweight or wasting. In developing countries as a whole, 41 per cent of children are stunted, and one third experience retarded growth in East and South East Asia in contrast to more than half, or 60 per cent, in South Asia. More than eighty per cent of total 215 million stunted children in developing countries live in low income countries, such as in the low income food deficit countries (LIFDCs), such as Bangladesh, India, Pakistan, Lao People Democratic Republic, Vietnam, Myanmar, and the Philippines. The high levels for stunting prevalence among children in these Asian LIFDCs are highlighted in Figure 7.
Figure 7. Stunting Prevalence among Children under Age 5 Years
(per cent)
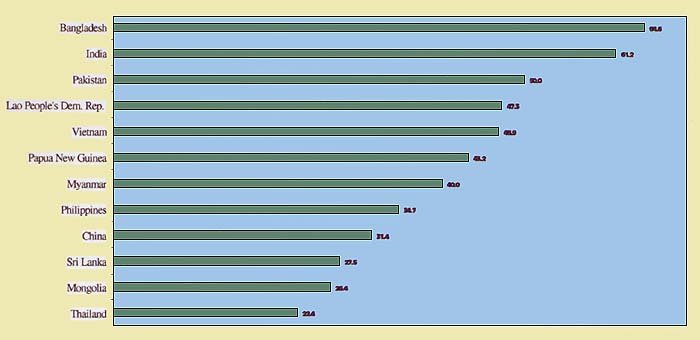
Source: The Sixth World Food Survey (Rome FAO) 1996.
Data shown on Table 4 below highlight the prevalence of stunting among adolescents. It is most prevalent among adolescents in Mindinao in the Philippines, but more prevalent in Nepal than India. The data for India highlight significant disparities between adolescent girls and boys.
Table 4. Prevalence of Stunting among Adolescents in Selected Countries, Latest Available Year
| Study | Stunting prevalence (per cent) (<5th percentile height-for-age) | ||
|---|---|---|---|
| All | Males | Females | |
| India | 32 | 20 | 45 |
| Nepal | 47 | ns | ns |
| Philippines (Cebu) | 43 | ns | ns |
| Philippines (Mindanao) | 65 | ns | ns |
Source: Kurz K et. al., (1994). The nutrition and lives of adolescents in developing countries. ICRW.
ns: statistically none significant
Stunting measured in children and adolescents is the result of a long-term and cumulative process, which can begin in utero with the initial consequence of low birth weight and growth retardation continuing to about age 3 years. Stunting on the whole reflects chronic effects, wasting describes an acute situation and underweight is a compromise between the two. The long-term consequences of undernutrition as stunting among Asian mothers, followed by post-partum underweight as shown in Table 5. Malnutrition of women during pregnancy not only increases the likelihood of infant and maternal mortality during childbirth, these mothers initiate an intergenerational cycle of undernutrition. These mothers are more likely than their well-nourished counterparts to experience early labour and, as a result, there is an increased probability that the infants will be premature and low birth weight.
Table 5. Mean Weights and Heights of Asian Mothers (Post-Partum)
| Country | Weight (kg) | Height (cm) |
|---|---|---|
| India | 42.1 ± 4 | 150 ± 5 |
| Indonesia | 46.0 ± 6 | 149± 4 |
| Myanmar | 46.9± 8 | 151± 5 |
| Nepal: | ||
Rural | 43.0 ± 5 | 150± 5 |
Urban | 46.0 ± 6 | 150±5 |
| Sri Lanka | 43.5 ± 7 | 150± 5 |
| Thailand | 49.9± 7 | 153± 5 |
Source: WHO (1993a)
Throughout the world, low birth weight (LBW) is considered the best single predictor of malnutrition. Weights less than 2,500 grams at birth are closely associated with poor growth during infancy, and throughout childhood (Bavdekar et. al, 1994, Butte et. al, 1996). The share of babies born with low birth weight is a reflection of malnourishment prior to birth and, thus, a consequence of nutritional insecurity among women of reproductive age. LBW in this context assumes significance, as it is an important indicator of foetal/intrauterine nutrition and can lead to stunting in the young child.
The high prevalence and large numbers of LBW infants in South Asia results from infant malnourishment in the womb and/or from cumulative effects of malnourishment among their mothers during infancy, childhood, adolescence and pregnancy (Gillepsie, 1997). Bangladesh and India report LBW prevalence of 50 per cent and 30 per cent respectively, and it is unacceptably high elsewhere in Asia as shown in Table 6 below.
| Bangladesh | 50 |
| India | 30 |
| Pakistan | 25 |
| Myanmar | 23.46 |
| Nepal | 23.2 |
| Maldives | 20 |
| Sri Lanka | 18 |
| Bhutan | 16 |
| Indonesia | 11 |
| Thailand | 7.25 |
Source: WHO (1993a)
The causes of LBW are multifactorial, and include low energy intake, poor weight gain during pregnancy, low pre-pregnancy weight, short stature or stunting, anemia, malaria and female fetus. As a result of these causal relationships, the incidence of LBW deliveries must not only be viewed as an index of our public health in general maternal health in particular, but LBW must be viewed as a consequence of nutritional insecurity among mothers, such as post partum underweight featured in Table 5 above.
Data in Table 7 below highlight trends for some of these factors and the potential for maternal and infant mortality. Maternal mortality remains unacceptably high in South Asian countries, and it is a special cause for policy concern in Bangladesh and Nepal. In many Asian countries, these infant mortality rates remain unacceptably high where large numbers of infants are unable to survive the first month of life. Reduction in infant mortality quickly translates into longer life expectancies for women and men and sustained interventions should therefore be implemented.
| Table 7. Infant, Child and Maternal Mortality, and Life Expectancy, 1978 and 1998 WHO Estimates | |||||||||||
| Infant Mortality Rate | Probability of dying (per 1000) | Maternal Mortality ratio | Life at birth | Expectancy (years) | |||||||
| under age 5 | between age 15 and age 59 | ||||||||||
| (per 1 000) | Males | Females | Males | Females | (per 100 000) | Males | Females | ||||
| 1978 | 1998 | 1978 | 1998 | 1978 | 1998 | 1990 | 1978 | 1998 | 1978 | 1998 | |
| World | 87 | 57 | 83 | 83 | 225 | 156 | 430 | 60 | 65 | 63 | 69 |
| Afghanistan | 183 | 152 | 257 | 257 | 371 | 324 | 1 700 | 40 | 45 | 40 | 46 |
| Bangladesh | 137 | 79 | 106 | 116 | 295 | 276 | 850 | 47 | 58 | 46 | 58 |
| Bhutan | 130 | 63 | 98 | 94 | 268 | 225 | 1 600 | 45 | 60 | 47 | 62 |
| Cambodia | 263 | 103 | 141 | 127 | 400 | 323 | 900 | 30 | 51 | 33 | 55 |
| China | 52 | 41 | 43 | 54 | 164 | 101 | 95 | 64 | 68 | 66 | 72 |
| Dem. People's Rep. of Korea | 38 | 22 | 27 | 25 | 184 | 108 | 70 | 62 | 69 | 69 | 75 |
| India | 129 | 72 | 82 | 97 | 230 | 182 | 570 | 53 | 62 | 52 | 63 |
| Indonesia | 105 | 48 | 69 | 56 | 236 | 184 | 650 | 52 | 63 | 54 | 67 |
| Iran. Islamic Republic of | 100 | 35 | 52 | 51 | 170 | 150 | 120 | 58 | 69 | 59 | 70 |
| Kazakhstan | 45 | 35 | 46 | 36 | 306 | 133 | 80 | 60 | 63 | 70 | 72 |
| Lao People's Dem. Rep. | 135 | 93 | 154 | 146 | 344 | 296 | 650 | 42 | 52 | 45 | 55 |
| Malaysia | 34 | 11 | 16 | 13 | 179 | 107 | 80 | 64 | 70 | 67 | 74 |
| Maldives | 106 | 50 | 53 | 80 | 208 | 222 | … | 56 | 66 | 53 | 63 |
| Mongolia | 88 | 51 | 72 | 75 | 224 | 166 | 65 | 55 | 64 | 58 | 67 |
| Myanmar | 114 | 79 | 121 | 104 | 262 | 207 | 580 | 50 | 59 | 53 | 62 |
| Nepal | 142 | 83 | 110 | 124 | 301 | 287 | 1 500 | 47 | 58 | 45 | 57 |
| Pakistan | 130 | 74 | 108 | 104 | 192 | 148 | 340 | 53 | 63 | 54 | 65 |
| Philippines | 62 | 36 | 49 | 38 | 200 | 151 | 280 | 58 | 67 | 61 | 70 |
| Sri Lanka | 41 | 18 | 22 | 20 | 171 | 93 | 140 | 65 | 71 | 69 | 75 |
| Thailand | 56 | 29 | 37 | 33 | 272 | 173 | 200 | 59 | 66 | 63 | 72 |
| Republic of Korea | 30 | 10 | 13 | 13 | 203 | 98 | 130 | 61 | 69 | 68 | 76 |
| Viet Nam | 82 | 38 | 54 | 57 | 218 | 147 | 160 | 54 | 65 | 58 | 70 |
| Source: WHO (1999) | |||||||||||
Undernourished pregnant women are not only under the threat of long-term disabilities, morbidity and possible mortality, but the process of labour is frequently initiated at an earlier period with the result of premature birth at about 36 weeks of gestation, or earlier. Premature birth is not only a major factor contributing to infant mortality, it also results in this high prevalence of LBW infants, especially in South Asian countries. Premature and LBW infants are less likely to survive infancy and childhood than their normal-birth-weight counterparts (e.g. Bhargava et. al 1985; Bhutta, 1990, 1997). Low-birth-weight survivors experience significant growth retardation, such as lower body weights, heights and head circumferences, in comparison to normal-birth-weight survivors (e.g. Bavdekar et al. 1994 and Bhargava et. al 1995). Longitudinal studies in the region also reveal that LBW infants experience retardation in motor, adaptive, personal, social and language development during the first five years of childhood (e.g. Bhargava et. al 1982 and 1984).
Although there is some potential for their being able to resume normal growth, deficits persist beyond childhood into adolescence (e.g. Bhargava et. al 1995). Young children born in poverty areas, with a high incidence of LBW, already have manifested high cholesterol and blood sugar levels, abnormal insulin levels and elevated blood pressure. Other LBW survivors are significantly more likely to experience impaired glucose tolerance as young adults leading to diabetes during old age, and are twice as likely to die of cardiac disease before reaching old age, than their surviving counterparts weighing more than 4.0 kg at birth (Hoet, 1997).
Recent research thus points to the potential for disease effects in adulthood and projects an entirely new dimension on LBW as posing impending threats to future prospects for nutritional security beyond 2000. There is a need for policy frameworks that respond to three research findings. First, it is not possible to reverse all the negative effects of intrauterine growth retardation (IUGR) by overcoming poverty and nutritional insecurities during postnatal life (Martorell 1994). As a result, LBW survivors are likely to suffer growth retardation and other morbidity throughout childhood, adolescence and into adulthood. Third, growth retarded adult women (e.g. who are either stunted and/or underweight) are likely to give birth to LBW babies and, thereby, contribute to perpetuating the vicious malnutrition cycle into the forthcoming century.
This requires priority to poverty alleviation and special measures for achieving nutritional security for girls and women before they become mothers. The major contributor to LBW is the malnutrition among women reflected in Body Mass Index (BMI) below 18, which are more prevalent in Nepal, Bangladesh, Bhutan and India than in South-East Asian countries, as shown in Table 8 below.
Table 8. Nutritional Status in Selected Asian Countries, Latest Available Year
| S. No | Country | Year | Per cent of low-birth weight babies (weighing <2500 g at birth) | per cent of children <5 yrs under-weight and stunted (<2sd NCHS) wt/age and height/age respectively | Per cent of women with Body Mass index< 18 | Prevalence per cent) of iodine disorders in school children | Prevalence ( per cent) of anaemia | Vitamin A deficiency in children <5 yrs** (Bitot's spots) | ||
| Wt/age | Ht/age | Pregnant women | Children <5 yrs | |||||||
| 1. | Bangladesh | 1993–95 | 50 | 58.0 | 55.0 | 49.9 | 74 | 73 | 0.78 | |
| 2. | Bhutan | 1995 | 16 | 38.0 | 54.0 | 14 | 68 | 58 | Not reported | |
| 3. | India | 1993 | 30 | 53.4 | 52.0 | 2.3–68.8 | 87.5 | 56 | 0.70 | |
| 4. | Indonesia | 1995 | 11 | 36.0 | 38.0 | 27.2 | 51 | 40.5 | 0.3 | |
| 5. | Maldives | 1995 | 20 | 38.0 | 30.1 | 23.6 | 68 | 81.5 | Not reported | |
| 6. | Myanmar | 1995 | 23 | 44.0 | 42.0 | 33.8 | 52 | 48 | 0.38 (small study) | |
| 7. | Nepal | 1996 | 33 | 47.0 | 63.0 | 40.0 | 68 | 79 | 0.84 | |
| 8. | Sri Lanka | 1995 | 18 | 40.0 | 25.0 | 18.0 | 40 | 45 | 0.6 | |
| 9. | Thailand | 1995 | 7.2 | 18 | Not reported | 5.6 | 13.4 | 15 | Reported none | |
Sources: WHO Global Database, 1997 and HFA Country Reports
The micronutrient deficiencies of public health significance in Asia are iodine deficiency disorders (IDD), vitamin A deficiency (VAD) and iron deficiency anemia (IDA). Other micronutrient deficiencies occur under special circumstances, generally because the quantity of the micronutrients is inadequate in food and the diet. Rickets remains a problem in certain parts of the Near East and Southern and East Asia. Zinc and selenium deficiencies are reported in China and some parts of Central Asia.
Approximately 1.6 billion people live in iodine deficient (IDD) environments and are therefore at risk. Over 650 million suffer from goitre, and almost half of the world's goitre sufferers are found in Asia and over half of these live in China and India. Unacceptably high prevalence of goitre among school children is featured in Table 9 below, especially in Bangladesh, India and Nepal. Among pregnant women, IDD is the most common cause of preventable mental retardation in children. Besides, IDD can impair reproductive functions, leading to increased rates of abortion, stillbirth and congenital anomaly.
Table 9. Nutrition Related Indicators in South Asian Countries, Latest Available Year
| Bangladesh | Bhutan | India | Maldives | Nepal | Pakistan | Sri Lanka | |
| IMR Per 1000 live births | 70–126 | 70–126 | 44–126 | 15–44 | 70–126 | 70–126 | 15–44 |
| MMR Per 100,000 Live births | 450–600 | 300–399 | 300–399 | 150–299 | 450–600 | 300–399 | 30–149 |
| LBW per cent | 45–65 | 35–44 | 25–65 | <25 | 25–34 | 25–34 | <25 |
| per cent IDD Goitre rates school children | >40 | 20–29 | <20–>40 | 20–29 | >40 | 30–39 | <20 |
| Malaria per 1000 Population | <3 | >35 | <3–35 | - | <3 | <3 | 13–35 |
| Complementary Feeding in children 6–9 m + Breast feeding per cent | 25–49 | >75 | <25–74 | <25 | 50–>75 | <25–49 | >75 |
| per cent births attended by trained mid wife, nurse or doctor | <20 | 20–49 | <20–100 | 50–74 | <20 | 20–74 | 75–100 |
| Calorie average per capita per day | 2000–2300 | - | 2300–2400 | 2400 | <2000 | 2300–2400 | 2000–2300 |
| Food as percent of total household expenditure | >60 | - | 50–59 | - | >60 | <40 | 40–49 |
| Access to man made water sources | >75 | 50–74 | 25–>75 | .75 | <25–49 | 50–74 | 50–74 |
| Access to sanitation facilities | 20–74 | 50–74 | <20–74 | <20–49 | <20–49 | 50->75 | 50–74 |
Source: UNICEF, 1996
IMR - Infant mortality rate
MMR - Maternal mortality rate
Vitamin A deficiency (VAD) is commonly reflected in eye diseases known as Bitot's spots, which serve as early warning signals about their increased prospects for blindness and subsequent early death. Vitamin A deficiency (VAD) as xerophthalmia is significantly greater in the WHO region of South East Asia than the Western Pacific Region of WHO (see Table 10).
| Region* | IDD | VAD** | |||
| At risk | Affected (goitre) | At risk | Affected (xerophthalmia) | Iron deficient or anaemic | |
| South-East Asia | 280 | 100 | 138 | 10.0 | 616 |
| Western Pacific• | 405 | 30 | 19 | 1.4 | 1058 |
Source: WHO 1992
* WHO regions,
** Pre-school children only,
• Including China
Iron Deficiency anaemia (IDA) is found to affect over 2 000 million people and sufferers live in nearly all Asian countries, with women and children being most affected, particularly in South Asia. Anemia has not markedly decreased in Asia and reports from India indicate 16 per cent of all maternal deaths are attributable to anemia (WHO 1993b) while the corresponding figure in Bangladesh is between 10 to 20 per cent (Chakravarty 1992). Anaemia is one consequence of malaria, which is prevalent in many Asian countries. Anaemia is associated with an increased risk of premature delivery and higher prevalence of LBW infants (Prema et al, 1981). Impaired ability to do physical work in anemic preschool and school age children has been consistently observed in India and Pakistan (Bhatia and Seshadri 1987, Satyanarayana et. al 1990, Paracha et. al 1992). Data shown in Table 11 below highlights the prevalence of anaemia among different demographic groups in some countries of South Asia, where the prevalence is quite high.
Table 11. Prevalence of Anaemia in Selected Groups of South Asian Countries, Latest Available Year
| Countries | per cent | |||||
| Pregnant Women (<11g/dl) | Lactating Women (<11g/dl) | Preschool Children (<11g/dl) | School Children (<11g/dl) | Adult | ||
| Women <12g/dl | Men <13g/dl | |||||
| Bangladesh | 77 | 77 | 73 | 40 – 74 | 70 | - |
| Bhutan (ICN. 1992) | 59 | - | 58 | - | - | - |
| India (Seshadri 1996) | 87 | 77 – 95 | 67 | 50 – 90 | - | |
| Maldives (WHO 1996) | 68 | - | 82 | 62 | - | |
| Nepal | 67 | - | 79 | - | 68 | - |
| Pakistan | 29 –33 (<10g/dl) | - | 65 – 78 | - | - | - |
| Sri Lanka | 39 | - | 45 | 58 | 45 | - |
Source: UNICEF 1997
Life expectancy will increase to the mid-to-high 70s in most South-East Asian countries, but it is expected to be lower, and in the 60s, for several other countries (see Table 12 below). Increases are primarily attributed to increases in the chances for life among infants, reflected in declining rates for infant mortality. These improved prospects are complemented by significant increases in the chances for longer lives among children under age 5 years, reflected in falling trends resulting from dramatic improvements in several countries. Child mortality rates will decline by more than half in Bangladesh and Nepal. As a result of these combined declines in mortality, the share of deaths under age 50 years will decline, though more significantly in some Asian countries than in others.
| Table 12. Life Expectancy, Infant & Child Mortality, Mortality under Age 50, 1995–2025 | |||||||||
| Life | Under 5 | Infant | Deaths | GNP | |||||
| Expectancy | Mortality | Mortality | under age 50 | per | |||||
| at birth (years) | Rate | Rate | as per cent | capita | |||||
| Both sexes | Both sexes | of total | US$ | ||||||
| 1997 | 2025 | 1997 | 2025 | 1997 | 2025 | 1997 | 2025 | 1995 | |
| Bangladesh | 58 | 70 | 104 | 34 | 80 | 29 | 60 | 28 | 240 |
| Bhutan | 53 | 67 | 142 | 50 | 105 | 41 | 70 | 43 | 420 |
| Cambodia | 54 | 67 | 131 | 44 | 104 | 40 | 69 | 33 | 270 |
| China | 70 | 75 | 40 | 17 | 38 | 16 | 24 | 8 | 620 |
| Dem People's R. of Korea | 72 | 77 | 25 | 13 | 22 | 11 | 27 | 8 | .. |
| Fiji | 73 | 77 | 23 | 8 | 20 | 8 | 29 | 8 | 2440 |
| India | 62 | 71 | 90 | 45 | 73 | 38 | 48 | 22 | 340 |
| Indonesia | 65 | 73 | 59 | 26 | 49 | 18 | 43 | 15 | 980 |
| Korea, Rep. Of | 72 | 77 | 12 | 5 | 10 | 5 | 26 | 5 | 9700 |
| Lao People's Dem. Rep. | 53 | 67 | 140 | 46 | 87 | 39 | 72 | 43 | 350 |
| Malaysia | 72 | 77 | 21 | 8 | 11 | 7 | 30 | 10 | 3890 |
| Maldives | 65 | 74 | 65 | 16 | 50 | 15 | 58 | 26 | 990 |
| Mongolia | 66 | 74 | 69 | 33 | 53 | 28 | 46 | 21 | 310 |
| Myanmar | 60 | 71 | 90 | 29 | 79 | 25 | 53 | 22 | .. |
| Nepal | 57 | 70 | 108 | 33 | 83 | 30 | 63 | 33 | 200 |
| Papua New Guinea | 58 | 68 | 80 | 34 | 62 | 30 | 57 | 30 | 1160 |
| Philippines | 68 | 75 | 42 | 16 | 36 | 14 | 44 | 16 | 1050 |
| Samoa | 69 | 76 | 68 | 38 | 58 | 35 | 45 | 23 | 1120 |
| Solomon Islands | 72 | 77 | 27 | 10 | 23 | 9 | 43 | 17 | 910 |
| Sri Lanka | 73 | 78 | 18 | 8 | 15 | 6 | 24 | 8 | 700 |
| Vanuatu | 67 | 75 | 48 | 16 | 39 | 14 | 47 | 23 | 1200 |
| Viet Nam | 67 | 75 | 51 | 21 | 38 | 18 | 43 | 20 | 240 |
| Source: WHO/SEARO 1998 | |||||||||
The projected growth in the number of Asians is among of the foremost contributory factors affecting Asian prospects for the combination of food and nutrition security. Current trends show that another 1.5 billion people will be added to the population of developing Asian countries by 2025. As these human increases coincide with rising needs for food at the global, national and household levels, they require urgent attention, especially in those Asian countries where the numbers of people are likely to double within the next two decades, as shown in Table 13 below. More than half of the global increase towards 2025 is expected to take place in South Asia. Such dramatic growth is likely to coincide with simultaneous increases in the absolute numbers of poor and malnourished people.
| Table 13. Population (in millions) in Selected Asian Countries, 1997–2025 | ||||
| Country | 1997 | 2000 | 2010 | 2025 |
| Bangladesh | 122,013 | 127,209 | 145,019 | 157,342 |
| Bhutan | 1,862 | 1,999 | 2,479 | 2,776 |
| China | 1,243,738 | 1,266,260 | 1,342,235 | 1,465,452 |
| India | 960,178 | 999,823 | 1,131,973 | 1,330,201 |
| Indonesia | 203,480 | 210,269 | 233,399 | 303,387 |
| Malaysia | 21,018 | 21,978 | 25,275 | 31,246 |
| Maldives | 273 | 297 | 380 | 433 |
| Myanmar | 46,765 | 48,757 | 55,583 | 67,800 |
| Nepal | 22,591 | 24,515 | 30,930 | 40,904 |
| Pakistan | 143,831 | 157,232 | 202,002 | 268,904 |
| Philippines | 70,724 | 73,955 | 85,048 | 105,140 |
| Dem P.R. of Korea | 22,837 | 23,529 | 25,882 | 29,893 |
| Sri Lanka | 18,273 | 18,827 | 20,709 | 23,919 |
| Thailand | 59,159 | 60,230 | 63,844 | 69,705 |
Note: Population projected based on the annual growth rates for 1995 and 2025 developed by the United Nations, except for India, Nepal and Pakistan whose figures are based on nutrition country profiles
Worldwide, the food supply is expected to rise to 3074 kcal by 2025, as shown in Table 14 below. These data depict a positive global trend continuing from 1969 to 1990–1992, and projected for 2010 and 2025. These data also highlight the increasing disparities in food insecurity in South Asia as compared to East and South East Asia.
| Table 14. Dietary Energy Supply (DES), 1969–1971 forward, with Projections to 2025* | |||||
| Calories per day per person | |||||
| 1969–1971 | 1979–1981 | 1990–1992 | 2010 | 2025* | |
| South Asia | 2060 | 2070 | 2290 | 2401 | 2674 |
| East & South East Asia | 2060 | 2370 | 2680 | 2948 | 3745 |
| Developing Countries | 2140 | 2330 | 2520 | 2730 | |
| World | 2440 | 2580 | 2720 | 2856 | 3074 |
| Least Developed Countries | 2060 | 2040 | 2040 | ||
| Low-Income Food-Deficit | 2060 | 2230 | 2450 | ||
| Source: FAO 1993 and 1996a * Author's estimates projected on linear trend basis | |||||
An estimated food surplus of about 20 per cent is needed to free market access to people, whose numbers are rapidly increasing. Worldwide, the food supply is enough to meet the energy needs of a growing number of people if it is equitably distributed according to each person's requirements, but food is not equitably distributed.
As a result, despite increases in the food supply, 12 per cent of people living in the developing world will remain food insecure in 2010, as shown in Figure 8 below. Achieving significant though uneven progress towards 2010, 344 million Asians will be chronically malnourished, and most will live in low-income food-deficit countries (LIFDCs), such as China, Bangladesh, India, Mongolia, Nepal and Papua New Guinea.
Figure 8. Number of Food Insecure People
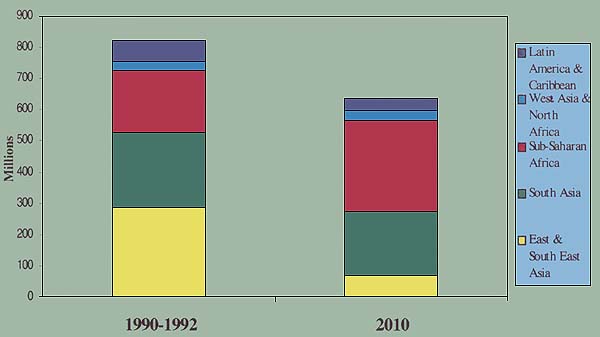
Source:
Agriculture towards 2010 Rome: FAO) 1993 and FAO Homepage, 1999.
The projections for underweight children highlight prospects for overcoming malnutrition. Underweight, even in mild form increases risk of death and inhibits cognitive development in children, leads to reduced fitness and productivity among adults. It perpetuates the problem from one generation to the next, through malnourished women having birth to low-birth-weight babies. Data shown in Table 15 features trends in prevalence for underweight children from 1975 to 1990, with to 2005. Despite projected declines for South Asia, more than half of all children will be underweight in 2005, along with about a third of children in South East Asia.
| Table 15. Prevalence and Number of Underweight Children, under Age 5 Years, 1975–2005 | ||||||
| Per cent Underweight | Number Underweight | |||||
| 1975 | 1990 | 2005 | 1975 | 1990 | 2005 | |
| Eastern Asia | 33 | 21 | 17 | 47.4 | 25.4 | 18.5 |
| Southeastern Asia | 48 | 38 | 32 | 24.6 | 21.6 | 18.4 |
| Southern Asia | 68 | 62 | 57 | 91 | 107.6 | 112.3 |
| Near East (Western Asia) | 22 | 15 | 12 | 2.9 | 2.9 | 3.1 |
| Asia | 49 | 44 | 41 | 163.1 | 154.7 | 149.3 |
| Source: ICN. 1992 * Author's estimates are calculated on the basis of linear trends. | ||||||
In 2025, the great majority of the children at risk of VAD will continue to live in South Asia and South East Asia. Multiple ocular data, featured in Table 16 below, show that these Asian countries experienced reduction in clinical signs of vitamin A deficiency, resulting from programme support for supplement distribution. Elimination of the deficiency seems possible based on projections to 2025, calculated in terms of percentage points per 10 years (pp/10 years), but these projections are optimistic. Thus, Asian prospects for meeting its commitment to eliminate vitamin A deficiency by the end of the decade are limited. Meanwhile, Asian children remain at risk, and its resulting blindness and imminent death.
| Country | Year | Indicator | Prevalance ( per cent) | Percent change Per 10 years | Trend (percentage points/10 yrs) |
|---|---|---|---|---|---|
| India | 1976 | X1B | 1.40 | ||
| 1979 | 0.90 | ||||
| 1988–90 | 0.70 | -42.00 | -0.58 | ||
| 2000@ | 0.44 | ||||
| 2025@ | 0.15 | ||||
| Nepal | 1979–80 | X1B | 0.60 | ||
| 1981 | 0.64 | -10.00 | -0.06 | ||
| 1996 | 0.50 | ||||
| 2000@ | 0.49 | ||||
| 2025@ | 0.42 | ||||
| Sri Lanka | 1975–76 | X1B | 1.10 | ||
| 1987 | 0.33 | -60.00 | -0.64 | ||
| 2000@ | 0.20 | ||||
| 2025@ | 0.06 | ||||
| Philippines | 1982 | Total | 3.20 | ||
| 1993 | 0.50 | -78.00 | -2.50 | ||
| 2000@ | 0.20 | ||||
| 2025@ | 0.02 | ||||
| Bhutan | 1976 | Total | 1.30 | -35.60 | -0.46 |
| 1989 | 0.70 | ||||
| 2000@ | 0.47 | ||||
| 2025@ | 0.18 |
Source : WHO (1995) and UNICEF et. al. (1997b)
@ author's projection based on trend percentage points
Poverty is the major factor limiting Asian prospects for achieving nutritional security for children, women and men. Data in Table 17 highlight the achievements of Asian countries to poverty alleviation in rural areas since the 1970s and as projected towards 2025. Several Asian countries have been able to reduce rural poverty to some extent, but much remains to be done, particularly in response to the current economic crisis and the resulting increases in poverty, though to varying degrees, as discussed in this context in Section V.
| Country | 1970s | 1980s | 2000 | 2025 |
| Bangladesh | - | +- | +- | +- |
| China | + | + | + | + |
| India | ? | + | +? | + |
| Indonesia | + | + | - | +? |
| Malaysia | + | -+ | + | + |
| Nepal | - | - | - | +? |
| Pakistan | + | +- | +- | + |
| Philippines | - | ?- | +? | + |
| Sri Lanka | - | - | - | +? |
| Thailand | + | -+ | +? | + |
Note: - denotes deterioration; + denotes improvement; = denotes no change; ? denotes unclear; two signs for the same decade denotes a change in trend. (For example, +- denotes an improvement in the early part followed by deterioration in the later part.)
Source: Islam (1990).
![]()
![]()
![]()