

In 1956, at the time of the
first forest inventory, 44 percent of Sri Lanka was covered by forests. In
1992, the closed canopy forest cover had declined to about 24 percent. The
total forest cover today, including sparse forests, is around 30.9 percent.
Deforestation has been caused mainly by conversion to other land uses and
shifting cultivation. The remaining forest cover of about two million ha
consists mostly of dry monsoon, sparse and fragments of tropical rain forests
(Table 1).
Table 1. Natural forest types in Sri Lanka (hectares)
|
District |
Land area |
Montane forest |
Submontane
Forest |
Lowland rain
forest |
Moist
monsoon forest |
Dry monsoon
forest |
Riverine dry
forest |
Mangrove |
Sparse
forest |
Total |
|
Ampara |
450 031 |
45 190 |
69 265 |
10 160 |
292 |
41 760 |
166 667 |
|||
|
Anuradhapura |
722 178 |
180 083 |
0 |
0 |
116 693 |
296 776 |
||||
|
Badulla |
285 673 |
93 |
3 888 |
1 577 |
17 517 |
3 353 |
0 |
0 |
27 843 |
54 271 |
|
Batticaloa |
263 983 |
13 302 |
21 770 |
0 |
1 421 |
16 325 |
52 818 |
|||
|
Colombo |
68 469 |
1 832 |
0 |
0 |
0 |
0 |
36 |
1 868 |
||
|
Galle |
161 256 |
18 903 |
0 |
0 |
0 |
187 |
1 699 |
20 789 |
||
|
Gampaha |
141 890 |
273 |
0 |
0 |
122 |
20 |
429 |
|||
|
Hambantota |
262 307 |
220 |
739 |
19 169 |
3 710 |
539 |
55 077 |
79 454 |
||
|
Jaffna |
107 848 |
822 |
0 |
260 |
298 |
1 380 |
||||
|
Kalutara |
164 391 |
20 240 |
0 |
0 |
0 |
70 |
1 266 |
21 576 |
||
|
Kandy |
192 808 |
935 |
8 504 |
14 258 |
3 545 |
0 |
0 |
0 |
5 980 |
33 222 |
|
Kegalle |
168 328 |
3 655 |
11 791 |
0 |
0 |
0 |
0 |
492 |
15 938
|
|
|
Kilinochchi |
132 499 |
32 373 |
0 |
312 |
6 042 |
38 727 |
||||
|
Kurunegala |
489 787 |
1 827 |
8 153 |
0 |
0 |
14 766 |
24 746 |
|||
|
Mannar |
200 148 |
111 389 |
795 |
1 261 |
11 762 |
125 207 |
||||
|
Matale |
206 050 |
89 |
5 314 |
12 831 |
41 337 |
15 237 |
0 |
0 |
9 207 |
84 015 |
|
Matara |
130 829 |
519 |
16 686 |
2 174 |
516 |
0 |
6 |
2 076 |
21 977 |
|
|
Moneragala |
576 763 |
65 |
768 |
63 558 |
113 627 |
4 584 |
0 |
52 569 |
235 171 |
|
|
Millaittivu |
260 946 |
153 769 |
0 |
463 |
17 987 |
172 219 |
||||
|
Nuwara Eliya |
174 109 |
1 943 |
31 078 |
3 977 |
2649 |
0 |
0 |
0 |
3 273 |
42 920 |
|
Polonnaruwa |
344 988 |
|
47 266 |
68 093 |
523 |
0 |
22 949 |
138 831 |
||
|
Puttalam |
315 485 |
79 452 |
814 |
2 264 |
17 104 |
99 634 |
||||
|
Ratnapura |
327 034 |
48 |
15 816 |
38 194 |
4 755 |
3 545 |
0 |
0 |
4 491 |
66 849 |
|
Trincomalee |
267 991 |
4 |
110 491 |
1 826 |
1 491 |
17 629 |
131 441 |
|||
|
Vavuniya |
200 836 |
103 182 |
0 |
0 |
16 504 |
119 686 |
||||
|
Total (ha) |
6 616 627 |
3 108 |
68 839 |
141 550 |
243 877 |
1 094 289 |
22 412 |
8 688 |
463 848 |
2,046,611 |
Source: Legg and Jewell, 1995
Forest plantation
establishment commenced in the 1870s. Over the past 100 years the Forest
Department has established nearly 93 000 ha of forest plantations mainly with
teak, eucalyptus, pine and mahogany. The initial plantation establishment
activities (from 1890 to 1950) focused on replacing the natural forest areas
that had been lost owing to shifting cultivation. Most teak and mahogany
plantations were established during this period under the Cooperative
Reforestation System (modified Taungya system).
The planting of pines and eucalypts in the wet zone and up-country was started
in 1939 in line with the policy of planting patana
grasslands, which are composed mainly of Cymbopogon
confertiflorius, Themeda tremula, Chrysopogon, Pollinia and Arundinelia
grasses.
This trend was continued
until the policy change in 1953. The new policy emphasized the production of
fuelwood and timber as the main role of forest plantations to alleviate the
pressure on natural forests. As a result, large-scale plantations of teak and
eucalyptus in the dry zone and pines in the wet zone were established until the
1980s.
Environmental and social
aspects of plantation development were discussed widely and the importance of
the participation of local people in tree growing was recognized during the
mid-1980s. When the Community Forestry Project (CFP) started in 1982, the
approach to tree growing changed somewhat. This project was funded by the Asian
Development Bank (ADB) and implemented in five administrative districts
(Badulla, Nuwara Eliya, Kandy, Matale and Batticaloa). The main objectives of
the six-year project were to establish fuelwood plantations and community
woodlots with the participation of local people. The project was followed by
the Participatory Forestry Project (PFP), which was also funded by the ADB and
implemented throughout the country between 1992 and 1999. The main components
of the PFP were similar to those of the CFP but the earlier block fuelwood
plantation component was not included. All the components were implemented with
more participation by local communities. Both the CFP and PFP were implemented
by the Forest Department.
The total area under
productive forest plantations is around 93 000 ha to date (Table 2).
Table 2. Forest plantations by species (hectares)
|
Species |
Extent |
|
Conifers (Pinus) |
16 440 |
|
Eucalyptus and
acacias |
27 500 |
|
Teak |
31 713 |
|
Mahogany |
2 800 |
|
Miscellaneous |
14 547 |
|
Total |
93 000 |
There are
different types of tree resources outside the traditional forest areas. Home
gardens, coconut plantations, rubber plantations, shade trees in tea
plantations, roadside plantations, trees on farmlands and other perennial
plantations provide more than 70 percent of the industrial timber and more than
80 percent of the biofuel demand.
Home gardens are perhaps the
best-developed agroforestry system in Sri Lanka. This system of perennial
cropping has been practised for centuries. It is essentially mixed cropping
with a variety of tree species that provide food, fruits, timber, medicine and
spices. Home gardens are widespread and vary in species composition and tree
density. According to FSMP estimates, home gardens covered about 858 000 ha in
1992. Their extent is increasing by about one percent annually.
Table 3 shows the distribution of home gardens by district based on Landsat TM data (Jewell 1995). The districts of the north (Jaffna, Kilinochchi, Mulativu, Mannar, and Vavunia) were not included in the study.
Home gardens in Sri Lanka
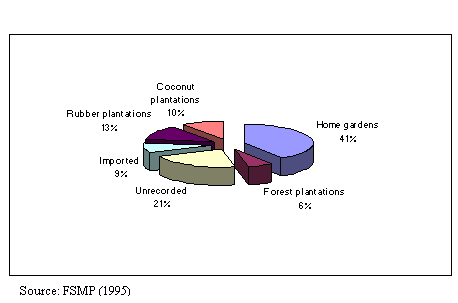
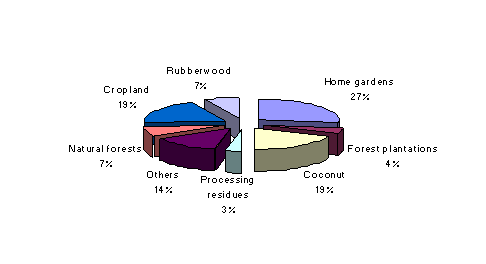
produce 41 percent of national sawlogs and 26 percent of the biofuel demand
(FSMP 1995) (Figures 3 and 4). The National Forest Policy of 1995 has
recognized their important role by stating that “Trees growing on homesteads,
and other agroforestry, will be promoted as a main strategy to supply wood and
other forest products for meeting household and market needs”. According to the
FSMP estimates, home gardens produce 0.95 m2 of sawlogs and 0.5 m2
of poles per hectare per year.
Table 3. Distribution of home gardens in 1992 (hectares)
|
District |
Land area
(ha) |
Area of home gardens |
Home gardens as % of
districts |
|
Ampara |
450 031 |
16 245 |
3.6 |
|
Anuradhapura |
722 178 |
56 143 |
7.8 |
|
Badulla |
285 673 |
50 764 |
17.8 |
|
Batticaloa |
263 983 |
14 359 |
5.4 |
|
Colombo |
68 469 |
8 577 |
12.5 |
|
Galle and Matara |
292 085 |
99 000 |
33.9 |
|
Gampaha |
141 890 |
56 884 |
40.1 |
|
Hambantota |
262 307 |
44 922 |
17.1 |
|
Kalutara |
164 391 |
33 156 |
20.2 |
|
Kandy |
192 808 |
61 029 |
31.7 |
|
Kegalle |
168 328 |
46 782 |
27.8 |
|
Kurunegula |
489 787 |
72 892 |
14.9 |
|
Matale |
206 050 |
20 258 |
9.8 |
|
Moneragala |
576 763 |
56 739 |
9.8 |
|
Nuwara Eliya |
174 109 |
9 172 |
5.3 |
|
Polonnaruwa |
344 988 |
36 180 |
10.5 |
|
Puttalam |
315 848 |
64 747 |
20.5 |
|
Ratnapura |
327 034 |
56 462 |
17.3 |
|
Trincomalee |
267 991 |
14 083 |
5.3 |
|
TOTAL |
5 714 713 |
818 394 |
14.3 |
Figure
3. Sawlog supply sources (1993)

Figure 4. Sources of bio-energy in 1994

Rubber and coconut
plantations supply 13 percent and 10 percent of the national sawlog demand
respectively. There are about 158 000 ha of rubber plantations and 439 000 ha
of coconut plantations. Nearly 30 percent of the rubber plantations are mature
and could be used for timber. About 35 percent of the coconut stock is more
than 50 years old and suitable for timber production. There are about 180 000
ha of tea plantations and shade trees in these plantations are often used for
timber production.
Wood production from non-forest tree resources is highly significant in the Sri Lankan context. Table 4 shows the projected wood production from home gardens and other non-forest tree resources.
Table 4. Projected wood production from home gardens and other non-forest tree resources (‘000 m3)
|
Source/year |
2000 |
2005 |
2010 |
2015 |
2020 |
|
Peeler logs
(rubber) |
7.9 |
8.3 |
8.4 |
8.2 |
8.2 |
|
Sawlogs Home gardens Rubber Coconut and
palmyra Trees on tea
lands Other
perennials Roadside
planting |
582.7 256.3 202.4 75.9 68.6 4.8 |
631.3 269.9 220.0 75.9 71.7 5.0 |
681.4 270.0 210.9 75.9 74.9 5.1 |
731.7 263.3 166.4 75.9 78.3 5.2 |
769.2 265.8 154.3 75.9 81.9 5.2 |
|
Poles Home gardens Other
perennials |
831.4 47.7 |
853.7 49.9 |
873.4 52.1 |
889.5 54.5 |
910.8 57.0 |
Source: FSMP (1995)