![]()
![]()
![]()
J. G. Sutinen
Department of Resource Economics, University of Rhode Island, Kingston, Rhode Island 02881 USA
ABSTRACT
Basic economic concepts are introduced and applied to problems of managing recreational fisheries. Recreational users of a fishery resource are induced by economic factors to overexploit the resource under open access. Management policies for rational use of the resource are developed and explained. When commercial and recreational users compete under open access for the same fishery resource the paper shows how economic factors determine the levels of commercial and recreational effort. The economic principles are explained for determining the optimal allocation between commercial and recreational users when the fishery is rationally managed.
RÉSUMÉ
L'ouvrage applique des concepts économiques fondamentaux au problème de la gestion des pêcheries récréatives. Ceux qui pêchent pour leur plaisir tendent à surexploiter les ressources auxquelles ils ont librement accès. L'auteur expose et explique les meilleures politiques de gestion pour veiller à l'utilisation rationnelle des resources. Lorsque, pour une resource halieutique, il y a concurrence entre la pêche commerciale et la pêche récréative, ce sont des facteurs économiques qui détermient les niveaux d'effort de pêche commerciale et récréative quand l'accès est laissé libre. Il explique aussi les principes économiques permettant de faire de façon rationnelle la répartition.
1 Rhode Island Agric. Exp. Stn. Contribution No. 1927.
INTRODUCTION
In this paper I intend to explain the fundamental economic principles for determining the allocation of fishing effort in recreational and mixed recreational-commercial fisheries. These principles in turn go a long way in explaining individual and group behavior in the fishery and also provide significant guidance for formulating fishery policy. Specifically, I explain why and in what sense a purely recreational fishery is overexploited and discuss the conditions that must hold for optimal fishery conservation and management. These issues are addressed first for a pure recreational fishery and second for a mixed recreational-commercial fishery. Also explained is how the mix of recreational and commercial effort is determined in both an open access and optimally exploited fishery, and how various factors can affect this mix.
RECREATIONAL FISHING
The pleasant experience of recreational fishing yields the individual satisfaction for which the angler is willing to pay. That is, the individual recreational fisherman typically pays out some of his money income on gear, bait, fuel and other items that contribute to the fishing experience. In addition, the individual uses some of his time for the experience, time that could be spent on other activities that also would yield him satisfaction. The individual's decision about whether to fish recreationally depends on how much satisfaction he receives from the experience, the direct costs of fishing and the satisfaction he must forego from other uses of his time. If his satisfaction from recreational fishing is great enough so that he is willing to pay more of his income than he has to (on gear, bait, fuel, etc.), then the individual would decide to fish recreationally and receive some net benefits from the experience. Furthermore, the individual will continue to add recreational fishing experiences (e.g., trips) so long as the added net benefits are positive. When the added gross benefits are not sufficient to cover the foregone satisfaction of other uses of his time and income, then he will no longer add fishing experiences. Instead, he will spend his time and money income on other, more beneficial activities.
I have just illustrated a fundamental principle underlying all allocation decisions. The principle is known as the marginal principle. It means that choices—between alternative actions—are made at the margin, comparing small amounts of additional quantities. A decision maker attempting to maximize total net benefits compares the marginal (i.e., the added or extra) net benefits of alternative acts, and chooses that act which yields the highest marginal net benefits. For example, suppose the cost of all items for another recreational fishing trip is $20; and the individual receives satisfaction from the experience to the extent he would be willing to pay up to $50. Further suppose his next best alternative is to hunt ducks at the cost of $15 for an added hunting trip, and for which he would be willing to pay up to $40. The net willingness to pay for fishing is $30, and for hunting is $25. The marginal net benefit from fishing is the difference of $30 - $25, or $5. Therefore, the individual would choose to fish instead of hunt. Note how the greater satisfaction more than offsets the greater costs of fishing, such that the net willingness to pay for fishing is greater than the net willingness to pay for hunting, thus yielding positive marginal net benefits for fishing.
A recreational fishery can be over-exploited in the same way that a commercial fishery can be over-exploited. The typical fishery is one of open access. Access is open in the sense that no one has the exclusive right to use the resource. All who desire may enter the fishery and exploit the resource. We saw above how individuals will enter when their marginal net benefits are positive and fish up to where their marginal net benefits are zero. If enough time is allowed to pass, and if the economic and physical environment remains fairly steady, the fishery will tend to stabilize at a fixed number of fishermen, with each fishing to the point where his marginal net benefits equal zero. That is, to where no additional trips on average yield additional net benefits. Other, non-fishing individuals in the community do not enter because for them the added net benefits from fishing would not be positive. The total number of fishermen, together with their number of trips and catch levels, determine the total amounts of effort and catch for the fishery.
A greater amount of effort (e.g., measured in fishing trips) of course reduces the stock of fish left to grow and reproduce, and the standing stock size in any period can affect the catch rate. If higher catch rates are valued by recreational fishermen, greater effort in a current period means lower benefits in future periods. In other words, a fish caught today has an associated cost in the form of foregone future net benefits. But because of open access no one has the exclusive right to use the resource, and a fisherman cannot expect to reap these future net benefits by not catching another fish. Therefore, individual fishermen do not consider this added cost of foregone future net benefits and each perceives greater net benefits than he would were he to consider this cost. This perception of greater current net benefits induces some fishermen to enter who otherwise would not, and induces each fisherman to apply more effort than otherwise.
The result is too many fishermen, with each applying too much effort. That is, there is waste in the fishery in the sense that the sum of net benefits over all fishermen and over all periods could be greater with lower levels of fishing effort. Lower levels of current effort would raise the level of future net benefits fishermen receive; and, initially at least, the added future net benefits would more than offset the reduction in current net benefits.
I assume that the essential task of fishery conservation and management is to reduce, if not eliminate, these wasted benefits. Waste will be eliminated when effort in each period is reduced to where two conditions are satisfied:
Condition 1: The realized marginal net benefits equal the foregone future marginal net benefits that result from fishing in the current period.
Condition 2: The realized marginal net benefits are equal for all fishermen.
The conditions are simply derived from an application of the marginal principle. Condition 1 reflects the fact that total net benefits summed over time can be increased by reducing effort in the current period so long as the added future net benefits of this action offset the lost net benefits in the current period. When added future net benefits fail to offset lost current net benefits, the reduction in current effort should halt. If current marginal net benefits exceed foregone future net benefits, an increase in current effort will increase total net benefits. Therefore, one can do no better when effort is allocated over time according to Condition 1. Condition 2 reflects the need to reallocate effort among fishermen if the marginal net benefits of one or more fishermen exceed that of the others. By assigning more effort to those realizing higher marginal net benefits and less effort to those realizing lower marginal net benefits, total net benefits for the period will increase. Hence, total net benefits for the period will be maximized when Condition 2 holds.
Real world complexities often preclude effective implementation of these conditions. For example, environmental fluctuations and unknowns frequently make difficult the determination of foregone future net benefits resulting from current fishing. However, the conditions and the underlying principles should be understood for these constitute a standard against which actual fishery management practices can be compared.
COMMERCIAL AND RECREATIONAL FISHING
I now examine allocation issues in a fishery exploited by both recreational and commercial fishermen. The principles developed in the previous section are applied again to determine the allocation between recreational and commercial fishermen. First, I explain how the allocation under open access is determined, and then address the problem of optimal allocation.
As described above, individuals enter the fishery when they perceive positive net benefits from fishing and they fish up to the point where their marginal net benefits become zero. This principle applies to both recreational and commercial fishermen. One difference, however, is the nature of the benefits realized by each type of fisherman. Recreational fishermen principally derive satisfaction indirectly from the sport of fishing, while commercial fishermen principally derive satisfaction indirectly by spending their fishing income to purchase goods and services. Regardless of the nature of the benefits, however, each type of fisherman continues to enter and fish up to the point where his marginal net benefits from fishing become zero. In this way the number of recreational and commercial fishermen and the amount of effort each exerts are determined.
In view of this it is easy to see that fisheries that yield less of a sport experience will tend to have fewer recreational fishermen, and fisheries that yield low income will tend to have fewer commercial fishermen. Also, if a change occurs in a factor which affects the marginal net benefits of either group then the number of fishermen, the ratio of recreational to commercial fishermen, and the amount of effort each exerts may change. For example, as the economy grows and individuals in society become wealthier, they may choose to spend more of their time in recreational activities. More people may be drawn to recreational fishing and those recreational fishermen already in the fishery may exert more effort than before. The result, other things being constant, would be a tendency for commercial fishermen to reduce their effort and for some to exit the fishery. Thus the fishery would experience an increase in the ratio of recreational to commercial fishermen.
Another example is where the demand for food fish increases, driving up the price of fish. The higher price would cause higher incomes for commercial fishermen, inducing more commercial effort and attracting more commercial fishermen into the fishery. The higher commercial catch may in turn cause a lower catch rate among recreational fishermen, lowering their net benefits and inducing a reduction in recreational effort and fishermen. In this case, the ratio of recreational to commercial fishermen would fall. These are but two examples of how economic forces operate to determine the mix of recreational and commercial fishermen in an open access fishery.
To achieve the optimal allocation of effort over time and between recreational and commercial fishermen our two basic conditions again must be satisfied. As above, the optimal allocation is one which maximizes the sum of net benefits over all fishermen and over all time periods. Condition 2 determine the optimal allocation between recreational and commercial fishermen. That is, the number and effort of each type of fisherman are determined by equating their marginal net benefits. If the marginal net benefits of recreational fishermen exceed that of commercial fishermen, then a greater sum of net benefits can be realized by reallocating some effort to recreational fishermen, and vice-versa.
Starting with an open-access fishery, Condition 1 requires reducing the amount of effort in total and for both recreational and commercial fishermen. A pressing question for fishery policy is which group is to be cut back more, the recreational or commercial? The answer depends on the behavior of marginal net benefits for each type of user as effort is reduced. Suppose, for the sake of argument, that a given decrease in effort reduces net benefits more for commercial fishermen than for recreational fishermen. Therefore, fewer net benefits would be foregone in the period by reducing recreational effort more than commercial effort is reduced.
This situation could arise where commercial fishermen have few or poor alternative opportunities for earning income. Consider, for example, an isolated fishing community where the fishery is dominated by a single species and where agricultural and industrial jobs are limited or pay relatively little. Here, a commercial fisherman has limited alternative income earning opportunities and would likely stand to suffer considerable reductions in current net benefits from a cutback in his effort. If alternative uses of his effort—either in other fisheries or in other industries—can yield the commercial fishermen nearly comparable earnings, then he would stand to lose few current net benefits with a reduction in his effort.
Recreational fishermen would suffer large reductions in current net benefits with an effort reduction where substitute recreational experiences (e.g., hunting, hiking) are not readily available or not similarly valued. Where similarly valued recreational experiences are readily available, a recreational fishermen would lose few current net benefits with a reduction in his effort.
Exactly how marginal net benefits behave for each type of user is an empirical question beyond the scope of this paper. They likely will vary considerably by fishery and by location. To achieve effective management policies that reduce waste in the fishery, the marginal net benefit relationship must be estimated. Without such information, we have no way to evaluate policy.
Given knowledge of the marginal net benefit relationships, however, the rules for allocation are straightforward: Reduce effort more for those fishermen who will lose less in current net benefits at the margin (not in total!). Reduce effort such that the marginal net benefits are equal for recreational fishermen and commercial fishermen. And lastly, reduce effort across all fishermen to where current marginal net benefits become equal to foregone future marginal net benefits.
While these rules will minimize waste in the fishery they may also yield a distribution of net benefits among fishermen that some find inequitable. That is, application of the rules may result in one group receiving a low level of net benefits compared to the other group. Should equity concerns dictate a more even distribution of net benefits than that produced by the above rules, then fishery policy will be forced to tolerate some amount of wasted benefits.
CONCLUSION
I have attempted to explain in this paper the economic principles that determine effort allocation in the fishery. While these principles can be stated with relative ease, the design of policies based on them can meet with numerous difficulties. Perhaps first among these difficulties is obtaining valid estimates of recreational benefit relationships. This is a relatively new area of economic research. For good surveys of methods and problems see Freeman (1979) and McConnell and Norton (1976).
Implementation of suitably designed policies also encounters numerous difficulties. One worth noting is the difficulty associated with assuring fishermen that foregone current net benefits will be at least offset by added future net benefits if effort is reduced in the current period. For recent surveys of fishery management policies see Crutchfield (1979) and Scott (1979).
Lastly, for more advanced economic analyses of the issues examined here, see two papers by McConnell and Sutinen (1979a and b).
LITERATURE CITED
Crutchfield, J.A. 1979 Economics and social implications of the main policy alternatives for controlling fishing effort. J. Fish Res. Board Can., 36(7): 742–752.
Freeman, A.M. 1979 The benefits of environmental improvement. Baltimore and London, Johns Hopkins University Press. 272p.
McConnell, K.E. and V.J. Norton. 1976 An economic evaluation of marine recreational fishing: a review. In R. Stroud, ed. Marine recreational fisheries. Washington, D. C., Sport Fishing Institute. 20p.
McConnell, K.E. and J.G. Sutinen. 1979a Bioeconomic models of marine recreational fishing. J. Environ. Econ. Manage., 6:127–139.
McConnell, K.E. and J.G. Sutinen. 1979b Using the household production function in bioeconomic models. Unpublished mimeo, Kingston, University of Rhode Island. 17p.
Scott, A. 1979 Development of economic theory on fisheries regulation. J. Fish. Res. Board Can., 36:725–741.
Stephen Swales
Freshwater Fisheries Unit, Department of Zoology, Life Sciences Building, Liverpool University, Crown St., Liverpool, U.K.
ABSTRACT
River channel works used in land drainage improvement can often produce changes in the environment which are severely detrimental to the survival of fish and other aquatic fauna. This paper discusses ways in which these adverse effects can be reduced or eliminated while still achieving the objectives of the land drainage scheme. Guidelines for river channel works programs are suggested whereby natural river characteristics can be maintained and damage to the aquatic community consequently reduced. The need for channel works can also be avoided through the implementation of legislative policies which involve management of the river basin.
RÉSUMÉ
L'aménagment des cours d'eau est enterpris à grande échelle en Angleterre pour modifier l'hydrologie et la morphologie du lit des fleuves et rivières et de ce fait améliorer le drainage des terres et réduire les risques d'inondation. Le faucardage et la canalisation des cours d'eau sont des pratiques souvent efficaces du point de vue technique, mais leurs effets sur la faune fluviatile peuvent être néfastes. Ce document étudie les travaux d'aménagement des cours d'eau en Angleterre et en évalue les conséquences possible sur la faune fluviatile, notamment sur les poissons.
It is well established that river channel works used in land drainage improvement schemes, carried out to alleviate flooding or improve field drainage for farming, generally have detrimental effects on the aquatic fauna through changes in the physical characteristics of the river environment (Swales 1979). Channel works carried out to improve land drainage include channel widening, deepening and straightening, and can be used to improve flow for improved land drainage or to increase channel conveyance capacity and thereby reduce the frequency of flooding.
The literature relating to the effects of these activities on stream fauna is extensive (Barton et al. 1972), particularly in North America where channelization is an extremely controversial issue (Gillette 1972). Although fewer studies have been carried out in Europe, similar adverse effects have been recorded (Bou 1977; Bouchaud et al. 1979; Clavel et al. 1978; Huet and Timmermans 1976; Swales 1980).
The main intention of this paper is not to discuss the effects of channel works on the aquatic environment and fauna, as this has been considered in detail elsewhere (Hill 1976; Swales 1979), but to consider ways in which the adverse effects of channel modifications can be reduced, while at the same time achieving the land drainage objectives of the scheme.
Although the term ‘river channel works’ involves two main forms of management, namely channelization and aquatic weed removal, space does not permit a consideration of the latter. Attention will, therefore, be directed towards river channelization, that is, channel widening, deepening and straightening.
The adverse effects of river channelization work on fisheries may be reduced through either environmental and/or legislative control measures.
ENVIRONMENTAL CONTROL
The basis for environmental means of reducing the adverse effects of channelization lies in maintaining as many natural river channel characteristics as possible. This can be achieved in a variety of ways, some of which are detailed below.
Bank Vegetation Removal
Bankside vegetation is an integral component of the river ecosystem, forming an important nutrient supply for both aquatic invertebrates and fish, and providing shade and shelter for fish populations. The elimination of the shelter provided by bank vegetation has been shown to result in reductions in fish stocks (Boussu 1954; Gunderson 1968), while stream channelization work has also been found to disrupt the natural heterotrophic tendency of a river (Gelroth and Marzolf 1978).
The reasons given for removing bank vegetation during channel modification include, 1) to provide access for excavation and maintenance equipment, 2) to remove trees which are in danger of falling into the river and obstructing flow, and 3) to remove overhanging vegetation which is restricting flow. However, if channel excavation can be carried out successfully while operating from one bank only, the vegetation of the other bank can remain intact. Alternatively, if the river is shallow and excavating machinery can operate from within the channel itself, bank vegetation need not be removed to provide access. If these proposals are not feasible and some bank vegetation has to be removed to provide access, every effort should be made to preserve as much vegetation as possible, for example by only cutting short gaps which are sufficient for the equipment to operate successfully.
Where bank vegetation removal is unavoidable, provision should be made for replanting following the completion of the scheme, as recently suggested by the Soil Conservation Service in the U.S. (Bell et al. 1974). However, this will not compensate for the loss in wildlife caused by the destruction of mature timber and overhanging bushes.
Bank vegetation also has the effect of shading the river and restricting aquatic weed growth. The planting of bankside trees such as the alder Alnus glutinosa has recently been suggested as a more ecologically acceptable alternative to current weed control practices, such as mechanical cutting, which are widely used (Dawson 1978; Krause 1977).
Also, since tree root systems and bank vegetation serve to bind the soil together and provide a buffer strip between water and soil, their removal generally leads to increased bank erosion and the introduction of harmful sediment into the river. Therefore, when bankside tree removal is unavoidable, stumps should be left in place wherever possible to maintain maximum bank stability (Nunnally 1978).
Channel Straightening
Channel straightening is carried out to reduce the resistance to flow provided by meanders but also has the effect of increasing the gradient of the river since it now travels a shorter distance for the same drop in height. One of the most detrimental effects of stream channelization is the elimination of fish habitat through reducing the length of the river (Schneberger and Funk 1971). Indeed, in a major study of the effects of channelization of ‘warmwater’ streams in Iowa, North America, Bulkley et al. (1976) estimated that between 1 600–4 800 km of stream were lost through straightening. The removal of meanders also decreases fish habitat diversity, as meanders typically produce a variety of flow patterns and habitat types (Leopold and Langbein 1966). Thus, an important criterion in channel works design should be to straighten the channel and increase the slope as little as possible (Nunnally 1978).
Channel Enlargement
Dredging a river to increase channel capacity often has the most harmful effects on fish populations since this operation both destroys the natural habitat and removes the food supply. When the purpose of an improvement scheme is to increase channel capacity to alleviate flooding, some consideration should be given to increasing the size of the channel by either widening or, more preferably, by building flood embankments to contain the excess discharge. In this way, the harmful effects of dredging can be avoided.
The removal of gravel spawning areas by dredging can be particularly harmful in upland areas where salmonid fish populations predominate since these areas form the spawning substrate of these species. However, if the channel is overdredged it should be possible to replace the lost gravel and so maintain valuable spawning grounds.
Habitat diversity is usually greatly reduced by channel enlargement work which generally produces a uniform, trapezoidal channel, which although it is the optimum channel design for improved land drainage, presents an adverse environment for fish. Since fish community diversity in rivers is largely dependent on habitat diversity (Gorman and Karr 1978), channelization usually decreases fish diversity (Bulkley et al. 1976; Huggins and Moss 1974; Trautman and Gartman 1974). If channel uniformity can be avoided as much as possible, for example, by maintaining a variable pattern of water depth and excavating holding pools along the channel, the harmful effects of channel enlargement may be reduced.
Channelization also often removes the natural pool-riffle pattern of many areas of river (Keller 1978) which is essential in maintaining a balanced fish community. The shallow, turbulent riffle areas are characteristically spawning and rearing areas, while the deep, slow flowing water of pools provides adults with shelter and protection from the main force of the current. Therefore, the removal of the pool-riffle pattern should be avoided as much as possible when channel enlargement is carried out. If the pattern is lost it may be possible to recreate it through the introduction of gravel into the river at specific points equivalent to the position of riffle areas (Soil Conservation Service 1971; Stuart 1959). In the following section, design criteria for channelization are discussed which involve maintaining the natural pool-riffle pattern while at the same time improving flow for land drainage.
Stream Restoration and Pool-Riffle Production
Recently, new design criteria for channelization projects have been suggested which utilize natural fluvial processes to recreate natural channel characteristics. Keller (1978) suggested that by manipulating the river channel cross-section at desired points it is possible to induce the stream to converge and diverge flow in a natural way, resulting in the production of a stable pool-riffle pattern. In this plan, the conventional, uniform trapezoidal channel cross-sections are replaced by a channel which has a 2:1 slope on its inside bank and 3:1 outside bank slope. On Gum Branch, a small stream in North Carolina, North America, point bar deposits were induced at specific locations along alternate banks of a straight channel by sloping the banks appropriately. The point bars were stable features until they were buried 18 months later by the introduction of sediment from a nearby construction site (Keller 1978). A similar field experiment carried out on Briar Creek, North Carolina has also produced encouraging results (Keller 1976; Nunnally 1978).
Flood-Relief Channels and Pilot Channels
Flood alleviation can also be achieved by either re-routing excess discharge along a flood-relief channel, or by superimposing a flood control channel on the natural (pilot) river channel (Keller 1975). These forms of flood alleviation have the major advantage that they do not result in any damage to fish habitat. However, a flood-relief channel is generally only feasible over a short distance of river, usually to avoid a built up area where channel excavations cannot be carried out, and does not eliminate the problem of flooding in the lower reaches of the river. The construction of a flood control channel was suggested by Keller (1975) and involves the construction of a wide channel designed to accommodate high magnitude floods, within which the natural (pilot) river channel flows undisturbed. In this way, when the pilot channel floods, the excessive discharge is contained within the control channel. Although the flood control channel would necessarily be a large structure, Keller (1975) suggested that by vegetating the channel, it should be possible to blend the larger channel into the landscape so that it is indistinguishable from the natural land.
Habitat Improvement Devices
Habitat improvement devices such as current deflectors, low dams and artificial cover structures have often been used successfully to mitigate the adverse effects of river channelization (Barton and Winger 1973; Lund 1976; Swales 1980; White and Brynildson 1967). These structures can be very effective in modifying and diversifying flow patterns in the river channel, recreating the natural pool-riffle pattern, or providing shelter. The use of instream habitat improvement devices in fishery management is reviewed by Swales and O'Hara (1980).
Although these structures can be effective in ameliorating the adverse effects of channelization, their use may not be wholly desirable for land drainage interests since, by their action, these structures impede flow to some extent. However, if the installation of these devices is allowed for at the design stage of the channelization scheme, their effect on flow can be allowed for and land drainage improvement still achieved. The use of improvement structures is feasible over short sections of river but their high cost may preclude their installation on a wider scale. Also, although these structures can be built so that they harmonise with the environment, their artificial appearance may make their widespread introduction into rivers aesthetically undesirable.
Timing of Channel Works
Where possible, channel works should not be carried out during the spawning period of the predominant fish species present. In rivers in the U.K. this period for the ‘coarse’ fish of lowland reaches is generally between March and July, while for the salmonid populations characteristic of the upper reaches the corresponding period is between September and December.
LEGISLATIVE CONTROL
It is becoming increasingly evident in many countries in the world that the structural forms of land drainage improvement commonly used are often ineffective in achieving the desired results (Welcomme 1979). Recently, alternative non-structural forms of flood control have been advocated which involve management of the floodplain using legislative control measures rather than through channel modifications.
The effectiveness of conventional, structural control measures has recently been questioned by Costa (1978) in a study of flood control in the U.S. It was stated that despite the expenditure by the government of $12 billion on structural control since 1936, annual flood losses have increased steadily from an estimated $1 billion in 1958 to $2 billion in 1972, $3,8 billion in 1975 and a projected $6 billion by the year 2000. It was suggested that since there is no evidence in the hydraulic record that flood frequencies or magnitudes are increasing, the sharp rise in flood losses must be caused by, “increasing development of flood-prone areas spurred by unwarranted confidence in flood control structures,” and that as structural control measures often have little effect in alleviating flooding, “instead of continuing a losing battle to control nature, efforts should be made to control man.”
The first legislative measure which can be taken is flood-relief. This can be stated simply as being a transfer of income from taxpayers in general to people who live in floodplains (Brown 1974). In the event of a serious flood, the government makes a payment to the land-owner to offset the financial losses incurred through flood damage. However, flood-relief legislation would probably be largely ineffective in reducing the extent of channelization since most flood control schemes are designed to protect against relatively frequent, small-scale floods which would not qualify as a disaster (Brown 1974).
Alternatively, flood insurance schemes could be used to protect against financial losses caused by flood damage. A national program of flood insurance has recently been instituted in the U.S. to reduce public expenditure on structural control methods, to reduce undesirable development on floodplains and to force those who benefit from living on floodplains to carry the major cost of flood damage (Cordery and Pilgrim 1976).
However, it can be said that both the flood relief and insurance schemes have the disadvantage that they may encourage further development of floodplains, and so exacerbate the problems associated with flooding. There are, however, two legislative control measures which actually reduce floodplain development. The first of these is floodplain zoning which restricts the manner and extent to which floodplains are developed; areas of high flood risk are effectively delineated (Costa 1978). Thus, high flood risk areas would be preserved primarily for low economic activities such as fisheries, recreation, parkland and wildlife, with housing and industry being relegated to low flood risk areas. Such an approach would undoubtedly benefit fishery interests.
It has also been suggested that on some occasions the government could buy the floodplain for less money that it would cost to channelize the river (Brown 1974). Indeed, recently the body largely responsible for channelization in North America, the U.S. Army Corps of Engineers, suggested that they buy 3 400 ha of marshland neighboring Charles River in Massachussets as a substitute for channelization (Brown 1974). If this was carried out, not only would fisheries benefit, but floodplain land could be developed for recreation and amenity purposes, or used as wildlife sanctuaries.
In North America, as a result of the 1969 National Environmental Policy Act (NEPA) passed by the U.S. Congress, it is required by law that all major channelization projects requiring federal subsidy should prepare an environmental impact statement (E.I.S.) prior to the initiation of the work (Gangstad 1978). The EIS requires the planning and construction agency responsible for the channelization scheme to consider and evaluate all environmental aspects of the proposed scheme. The proposals are then discussed, and the plan passed to the Council on Environmental Quality for a final decision (Gangstad 1978).
If such a procedure were adopted in all channelization projects, fishery interests could be more effectively protected.
ACKNOWLEDGEMENTS
This paper was written whilst the author was carrying out a research project on the interrelationships between land drainage works and fisheries, sponsored by the Severn-Trent Water Authority.
The views expressed in this paper are those of the author, and not necessarily those of the Severn-Trent Water Authority.
LITERATURE CITED
Barton, J.R., E.J. Peters, D.A. White and P.V. Winger. 1972 Bibliography on the physical alteration of the aquatic habitat (channelization) and stream improvement. Brigham Young Univ. Pub.; Provo, Utah. 30p.
Barton, J.R., AND P.V. Winger. 1973 A study of the channelization of the Weber River, Summit County, Utah. Final report presented to the Utah Division of Wildlife Resources and Utah State Dept. of Highways. 188p.
Bell, A.L., E.D. Holcombe and V.H. Hicks. 1974 Vegetating stream channels—a multipurpose approach. Soil Conservation, 40:16–18.
Bou, C. 1977 Conséquences écologiques de l'extraction des alluvions récentes dans le cours moyen du Tarn. Bull. Ecol., 8:435–444.
Bouchaud, B. et al. 1979 Incidences des extractions de matériaux alluvionnaires et de l'aménagement des cours d'eau sur l'ecosystème aquatique. Bulletin Français de Pisciculture, 273:138–156.
Boussu, M.F. 1954 Relationship between trout populations and cover on a small stream. J. Wildl. Manage., 18:229–239.
Brown, J. P. 1974 Stream channelization: the economics of the controversy. J. Nat. Res., 14:557–576.
Bulkley, R.V., R.W. Bachmann, K. D. Carlander, H. L. Fierstine, L.R. King, B.W. Menzel, A.L. Witten and D.W. Zimmer. 1976 Warmwater stream alteration in Iowa. Extent, effects on habitat, fish and fish food, and evaluation of stream improvement structures (summary report). U.S. Dept. of the Interior, Fish and Wildlife Service, Biological Services Program, FWS/OBS-76/16.
Clavel, P., R. Cuinat, Y. Hamon, C. Romaneix. 1978 Effets des extractions de mateŕiaux alluvionnaires sur l'environement aquatique. Synthèse des résultats de 1974 à 1976. Bulletin Français de Pisciculture, 268:122–154.
Cordery, I., and D.H. Pilgrim. 1976 Engineering attitudes to flood risk. Water Services, 80:673–676.
Costa, J.E. 1978 The dilemma of flood control in the United States. Environmental Management, 2:313–322.
Dawson, F.H. 1978 Aquatic plant management in semi-natural streams—the role of marginal vegetation. J. Environ. Manage., 6:213–221.
Gangstad, E. O. 1978 Weed control methods for river basin management. C.R.C Press Inc., West Palm Beach, Florida. 229p.
Gelroth, J. V., and G.R. Marzolf. 1978 Primary production and leaf litter decomposition in natural and channelled portions of Kansas stream. Amer. Mid. Nat., 99(1):238–243.
Gillette, R. 1972 Stream channelization: conflict between ditchers, conservationists. Science, 176:890–894.
Gorman, O.T., and J.R. Karr. 1978 Habitat structure and stream fish communities. Ecology, 59:507–515.
Gunderson, D. R. 1968 Floodplain use related to stream morphology and fish populations. J. Wildl. Manage., 32:507–514.
Hill, A.R. 1976 The environmental impacts of agricultural land drainage. J. Environ Manage., 4:251–274.
Huet, M, and J.A. Timmermans. 1976 Influence sur les populations de poissons, des aménagements hydrauliques de petits cours d'eau assez rapides. Station de Recherches des Eaux et Forêts. D. No. 46:1–27.
Huggins, D.G., and R.E. Moss. 1974 Fish population structure in altered and unaltered areas of a small Kansas stream. Trans. Kentucky Acad. Sci., 77(1):18–30.
Keller, E.A. 1975 Channelization: a search for a better way. Geology, 3(5):246–248.
Keller, E.A. 1976 Channelization: environmental, geomorphic, and engineering aspects, pages 115–138 in D.R. Coates, ed. Geomorphology and engineering. Dowden, Hutchinson and Ross, Strondsburg, Pa.
Keller, E.A. 1978 Pools, riffles and channelization. Environmental Geology, 2:119–127
Krause, A. 1977 On the effect of marginal tree rows with respect to the management of small lowland streams. Aquatic Botany, 3:185–192.
Leopold, L. B., and W. B. Langbein. 1966 River meanders. Sci. Am. 214 (6):60–70.
Lund, V.A. 1976 Evaluation of channelization and mitigation on the fishery resources of the St. Regis River, Montana. U.S. Dept. of the Interior, Fish and Wildlife Service, Biological Service Programme, FWS/OBS-76/06.
Nunnally, N.R. 1978 Stream renovation: an alternative to channelization. Env. Mgmt., 2(5):403–411.
Schneberger, E., and J.L. Funk. 1971 Stream channelization—a symposium. Amer. Fish. Soc., Washington NCD/AFS, Spec. Publ. No. 2, 83pp.
Soil Conservation Service. 1971 Planning and design of open channels. Chapter 7: Tech. release 25.
Stuart, T.A. 1959 The influence of drainage works, levees, dykes, dredging etc. on the aquatic environment and stocks. Proc. I.U.C.N. Tech Meeting, Athens, 4:337–345.
Swales, S. 1979 Effects of river improvements on fish populations. Proc. First British Freshwater Fisheries Conference, Liverpool University, April 1979, pp 86–100.
Swales, S. 1980 Investigations into the effects of river channel works on the ecology of fish populations. Ph.D. Thesis, Liverpool University, 471p.
Swales, S., and K. O'Hara. 1980 Instream habitat improvement devices and their use in freshwater fisheries management. J. Environ. Manage. 10:167–179.
Trautman, M.B., and D.K. Gartman. 1974 Re-evaluation of the effects of man-made modifications on Gordon Creek between 1887 and 1973 and especially as regards its fish fauna. Ohio J. Sci., 74:162–173.
Welcomme, R. L. 1979 Fisheries ecology of floodplain rivers. Longman, London and New York, 297p.
White, R.J., AND O.M. Brynildson. 1967 Guidelines for management of trout stream habitat in Wisconsin. Wis. Dep. Nat. Resour. Tech. Bull. No. 39, 65p.
Daniel R. Talhelm
Dept. of Fisheries and Wildlife, Michigan Stage University, East Lansing, Michigan 48824 USA
ABSTRACT
Few angling demand studies accurately evaluate realistic management alternatives. Typically such studies estimate the all-or-none value of an existing site without evaluating the qualitative changes managers are concerned about and without specifying (or misspecifying) the influence of alternative sites. Angling supply is not adequately specified. Specific angling “products” can be defined by observing which sites anglers consider alike and which they consider different, using a kind of discriminant analysis. Thus, if any two sites offer the same product they are “perfect” substitutes, so anglers only go to the most convenient (least expensive) site. Angling supply differs from the supply of most products because the consumer is also the producer: the angler must transport himself to the site for the product to exist for him. The supply of each specific angling product is defined by the costs anglers must incur to fish at the least expensive location offering that product. For anglers from a specific origin the distance and “price” of each product is constant, so the supply of each product is perfectly elastic (horizontal). Here, several variations in angling success rate and fish species composition at several locations in Michigan were evaluated, simulating various fishery management strategies.
RÉSUMÉ
Rares sont les études de la demande de pêche à la ligne qui évaluent de façon précise les possibilités d'aménagement réelles. Elles déterminent généralement si un site donné est intéressant ou non, sans tenir compte des modifications qualitatives ni de l'influence des autres sites. Certaines études évaluent les demandes simultanées relatives à plusieurs sites, en précisant certaines formes d'interaction pratique mais non justifiée en théorie entre les sites qui empêchent de déterminer de façon impartiale la valeur—ou l'absence de valeur—des nouveaux sites, mais n'évaluent pas les modifications qualitatives que les responsables pourraient souhaiter effectuer. Ces difficultés proviennent de ce que l'offre de pêche à la ligne n'est pas précisée correctement. La qualité de la pêche à la ligne varie selon les sites, tout comme des produits commerciaux connexes diffèrent l'un de l'autre. Les études de la demande de produits commerciaux définissent tout d'abord la gamme des produits, puis elles estiment la demande de l'un des produits ou de l'ensemble de ceux-ci. On peut définir les différents “produits” de pêche à la ligne en déterminant les sites que les pêcheurs considèrent comme semblables et ceux qu'ils jugent différents. Ainsi, la pêche à la ligne dans les grands lacs du Michigan a été classée en fonction de 87 différents produits de pêche à la ligne sur la base d'une sorte d'analyse discriminante d'après laquelle deux sites offrant le même produit sont considérés comme de “parfaits” substituts, si bien que les pêcheurs choisissent le plus avantageux (c'est-à-dire le moins cher) d'entre eux. L'offre de pêche à la ligne diffère de celle de la plupart des autres produits, en ce que le consommateur est également le producteur, c'est-à-dire que le pêcheur à la ligne doit se rendre lui-même sur le site et participer à l'activité pour que le produit qu'il consomme existe. L'offre de chaque produit de pêche à la ligne est définie par les dépenses que les pêcheurs doivent engager pour pouvoir pêcher dans le site qui offre ce produit aux conditions les moins onéreuses. Pour les pêcheurs qui viennent du même endroit la distance et le “prix” de chaque produit sont constants, si bien que l'offre de chaque produit est parfaitement souple (horizontale). Après avoir estimé la demande de chaque produit, il est possible d'évaluer de nombreux changements potentiels de l'offre. C'est ainsi que l'on a évalué plusieurs variations du taux de succès de la pêche à la ligne et de la composition des captures dans divers sites du Michigan en simulant différentes stratégies d'aménagement des stocks.
INTRODUCTION: SEARCHING UNDER THE STREETLIGHT
The reason I became interested in economics and began a Ph.D. program in that field was that somehow I had faith that economic studies could answer all of my perplexing questions about recreation resource allocation. I had been told that demand and supply analyses could estimate people's preferences for all the various goods and services, and estimate society's ability to provide these goods. Then we could choose the optimum combination. Since angling and other forms of recreation were consumer goods, I thought economics could easily tell the local resource manager how to balance logging, fish production, wildlife production and trail hiking opportunities for timber users, anglers, hunters, birdwatchers, hikers and others. It sounded simple.
Now I know that the problem is not simple at all. However, my conviction remains that a lot of the information recreation resource managers need about user values can be estimated with reasonable accuracy. For example, we should be able to estimate the values of additional fish stocking programs by species and location, of changes in regulations at certain locations, of rehabilitating certain lakes in certain ways, of pollution control programs in various locations, of constructing fish ladders for migrating salmon and on and on. The list is “endless.”
From this perspective I am disappointed to find that very few economic analyses provide the kinds of information that fishery and other resource managers need to evaluate practical management problems such as these. Too often the studies amount to academic exercises that only answer questions that are so broad as to be of little or no practical use to resource managers, such as the all-or-none value of angling in a state. A major exception to this is the studies' usefulness for defending program budgets before legislators who know even less about economic studies. Furthermore, the estimates of these studies are usually either statistically biased or depend upon some vague, implicit assumptions. The analytical problems generally arise from the fact that such studies inappropriately follow the traditional travel cost method, so they (1) mis-specify demand and supply equations, (2) ignore the variation over a given geographic area in the “quality” of recreation available at the various sites, and (3) measure value only in all-or-none terms. Confused managers end up either ignoring the information or using it the wrong way.
Why do economists do this? I believe it is the old problem often put in the form of a joke about searching for a lost wallet under the streetlight where the light is available rather than in the dark where the wallet was lost. In this case economists have been concentrating on demand and ignoring supply. For example, many economists have analyzed changes in recreation quality as if they can be described totally as a shift in demand, rather than the changes in supply they really are. The same economists would probably never think of the advent of inexpensive calculators as a shift in demand; rather a shift in supply and, if the calculators are sufficiently different, a shift to a new demand curve for a new product. Ignoring changes in supply might be acceptable in estimating the all-or-none value of a highly unique site such as Yosemite National Park because the only possible variation in supply in question is present supply as opposed to none. However, it also assumes that either no substitutes affect the demand curve, or that the all-or-none value calculation assumes something unspecified about availability of substitutes. It also answers a question about the park that almost no one was asking, except for some academics and some non-economist administrators. At least I have heard of no proposals to eliminate the park.
Below, it is shown that if we define recreation supply in the same way we would for other kinds of goods, both demand and supply may be estimated, and accurate values may be estimated for the marginal kinds of resource changes mentioned above. Other points addressed are: (1) how the non-market nature of recreation as a good influences the valuation problem, (2) the fact that the consumer is also the producer of recreation at a given site, so for this good to be consumed the consumer must be transported to the production site, rather than the product being transported to the proximity of the consumer, and (3) the problem of developing a product classification system that reflects user choice patterns. The problems of equation form and simultaneous estimation are addressed briefly. This approach is briefly contrasted with the traditional travel cost method as differences arise. Finally, this method is illustrated with results of studies of angling for Great Lakes fish in Michigan.
ADDING THE OTHER BLADE: DEFINING ANGLING SUPPLY AND ANGLING QUALITY
Supply
A standard economic definition of supply is: the minimum prices for which each given quantity of a good per unit of time will be forthcoming within a given time framework. In other words, the supply of a good is the “availability” of a good as measured in terms of its price. Angling supply for anglers from a given location fishing at a given site is usually horizontal or perfectly elastic, as will be shown later. The “good” we are concerned with at this point in this paper is angling at a given location. Later a more comprehensive definition will be offered. The quantity of angling is measured in terms of activity time, often approximated as angling “days” or visits. It is important to emphasize this because the product is angling at a particular site, but not the site itself. The supply of angling is quite different than the supply of angling sites. Confusion on this point has apparently misled several economists. This paper addresses the demand and supply of angling only, not the demand and supply of angling sites, except that the demand for angling sites is the net value of angling—derived from the demand and supply of angling.
The “price” of angling from the consumer's viewpoint includes both the monetary cost and the opportunity cost of time incurred for the purpose of angling. Because the consumer must travel to the site to produce angling, major cost items are the monetary and time costs of transportation. Virtually every site differs in “price” because travel costs vary with distance, travel mode and other factors; and virtually every angler faces different prices for angling than all other anglers because each person's opportunity costs of time, expenditure pattern and travel distances differ. Becker (1965), Talhelm (1972) and others have shown that one's opportunity cost of time may be approximated by his net wage rate (or “take-home pay”). Therefore angling price may be defined as Equation (1),
where Pf is the price of fishing; Tt is the time spent traveling, preparing and related activities; Pt is the opportunity cost of time; Tf is time spent fishing; Ct is the monetary cost of travel; and Cf comprises other monetary costs attributable to angling.
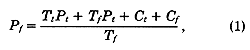
It is useful to express price as a function of either travel time or travel distance, because for a given individual with a given style of angling, Pf varies mainly with travel time (Tt), travel cost (Ct) and time spent angling (Tf). Talhelm (1972) showed that for any given travel time (or distance) there is one length of stay (Tf) for which Pf is lowest, so anglers tend to choose that Tf. For short distances (under about 16 km), short lengths of stay (about 4 hours or less) are least expensive; for intermediate distances, intermediate lengths of stay are least expensive; and for long distances (over about 160 km), trips involving one or more nights' lodging are least expensive. In several empirical studies of angling (and other outdoor recreation) prices, I have found that price increases rapidly with distance for about the first 15–30 km, then increases fairly steadily with distance thereafter. For example, Fig. 1 illustrates the “price equation” for angling in inland lakes in Michigan in 1972, Equation (2) (from Talhelm 1976),
| P = 10,8 + 0,064T + 1,93 · ln (T + 1), | (2) |
where P is angling price per angler day and T is travel time. Variation about such price equations is high—only about 20% is attributable to travel time or travel distance—but the equations seem quite consistent between studies. This variation is apparently attributable mainly to variation between individuals in Pt and Cf.
For a given individual the supply curve for angling at a particular site is horizontal or perfectly elastic, since one may visit the site “any” number of times over a long-run period at approximately the same price. A price equation could estimate the average price of angling at a particular site for a cross-section of individuals originating from the same city, county or other geographic area with sufficiently small variation in travel cost. Thus the supply of angling at a particular site for individuals from a given origin is a price estimated by the price equation. This assumes that congestion, travel conditions and other price-related factors pertaining to that site are sufficiently similar to the assumptions of the price equation.
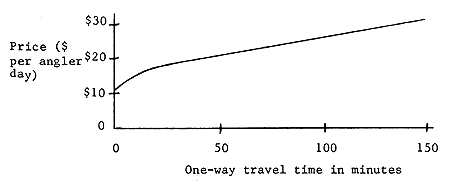
Fig. 1. Price equation for inland angling in Michigan.
So far this definition of supply is consistent with the implied in the traditional travel cost method. However, recreation “supply” has almost never been explicitly recognized in the literature in this form.
Quality
Few recreation demand/supply studies have recognized differences in recreation quality. The vast majority either just study one site and ignore any others, or merely assume that each site is different. These approaches are not satisfactory for common forms of recreation which vary greatly in “quality”, such as angling. Anglers and managers seem to speak in general terms about angling quality as if all sites could be rated on a scale from one to ten. Upon closer inspection, however, I find that a “ten” for one angler might only be a “five” for another. For example, a flies-only site may be preferred by one angler but avoided by another. It seems much more useful to think in terms of a variety of kinds of angling as we do with other products such as automobiles or wines. Obviously each angling site differs in some way from each other, but if we can discover the important attributes of angling sites that make them essentially alike or different to anglers we can develop an angling classification system to define the angling products available.
One technique I have used is a discriminant analysis of angler travel patterns in relation to site attributes. If anglers think two sites are alike, we can consider the sites as offering the same product, or as “perfect” substitutes. Anglers would have no incentive to travel to the farther site if the closer site were a perfect substitute. The extent that anglers are willing to incur “unnecessary” expenditures (“excess expenditures”) to reach a farther site indicates the extent to which they differentiate between the sites. The only exceptions are: (1) anglers who have other purposes for their trips to particular areas and (2) anglers who are unaware of the alternatives. The former may easily be excluded from the discriminant analysis.
I have used this method to define angling products for (1) trout fishing in streams in Tennessee and North Carolina (Talhelm 1971, 1972, 1973a), (2) angling on inland lakes throughout Michigan (Talhelm 1976), (3) angling for salmon and steelhead trout throughout Michigan (Talhelm 1973b, 1973c), and (4) a current study of angling for salmonids in Michigan's Great Lakes, for non-salmonids in Michigan's Great Lakes and for lake-run salmon and steelhead trout in Michigan's Great Lakes tributaries (Korson and Talhelm 1978; Korson 1979; Jordan and Talhelm 1979). I will use examples from the current study in the remainder of this paper. The first step was to inventory the likely attributes of angling in each Michigan county during each of the three seasons studied (winter-spring, summer, fall). For example, attributes inventoried included catch per angler day of each salmonid species and various salmonid species groups, publicity, whether the county had a bay, and whether complementary forms of recreation were important there. Success rates and other attributes were defined in categories such as high and low; or high, medium and low. Each alternate definition was treated as a separate attribute. The second step was to hypothesize that various sets of attributes define the products available within the system. These hypotheses are accepted or rejected on the basis of observed excess expenditures (E), defined as the cost of travel in excess of the cost of traveling to the least-expensive site in the same product category. This is shown in Equation (3) where P' is the actual price per visit from origin j to site k (defined as belonging to product i), Pij is the price per visit at the least expensive site of product i from origin j, and Vjk is the number of visits from origin j to site k.
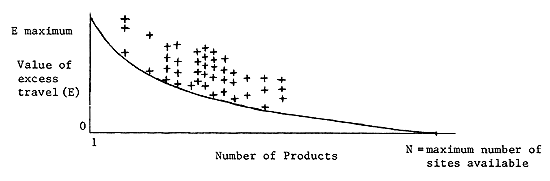
Fig. 2. Typical pattern of excess travel data in product classification.
The objective of the comparisons find those classification that minimize excess travel within product category in relation to the number of products defined. A relationship similar to that illustrated in Fig. 2 is expected, where each “+” represents a combination of excess travel and number of products resulting from one hypothesis. The minimum number of products is one, equivalent to assuming all sites are alike, whereas the opposite is to assume that all sites are unique. Excess travel is maximum in the former case and zero is the latter. A curved frontier should be formed by the “best” hypotheses for various numbers of products defined, with the frontier asymptotically approaching zero as the products are defined in more detail.
Table 1 illustrates the product classification system for salmonid angling in Michigan's Great Lakes in summer 1976. The “product identification number” is not a ranking, but an arbitrary number assigned for identification purposes. A total of 79 products were identified in the entire study.
With the products identified we can be more specific in our definition of supply: the supply of any angling product is the minimum price at which that product is available to potential consumers within a specified time framework. Therefore for each origin (county) the supply of each product is the price of angling for that product at its least expensive location. The price of angling for any product in any other location is redundant, since all locations offering the same product are defined as perfect substitutes. In reality some anglers do go “farther than necessary” and I have separated them from the following demand analysis, later acknowledging their presence for the final participation and value estimates.
Table 1. Identification key defining seven different kinds (products) of Great Lakes salmonid fishing during the 1976 summer period.
| Catch rates | Product identification number | Number of counties | |
| Any trout | Aggregate salmon | ||
| High | High | 1 | 3 |
| Moderate | 2 | 3 | |
| Low | 3 | 5 | |
| Moderate | High | 4 | 1 |
| Moderate | 5 | 5 | |
| Low | 6 | 15 | |
| Low | High | - | - |
| Moderate | - | - | |
| Low | 7 | 9 | |
Demand
Since the several products defined in Fig. 2 are simultaneously available to anglers from each origin, the demand and supply of all products may be simultaneously estimated. Supply is exogenous so that the problem is greatly simplified. After trying several equation forms, an equation with the form of Equation (4) is theoretically satisfactory and works well empirically.
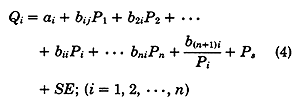
Here Qi is the quantity of angling per capita from the given origin at the nearest destination (county) offering angling product i, a and b are coefficients, P is the supply price of each respective product, Ps represents the prices and coefficients of a set of other substitutes, SE represents a set of socioeconomic variables and coefficients, and n is the number of angling products in the product group (e.g., salmonid angling on Michigan's Great Lakes). One observation of all variables is available for each origin (county). This equation is curvalinear and may asymptotically approach the price axis. That is important because I have usually found many valid observations of zero quantity of use at high prices. Linear equations would be biased by such observations.
Burt and Brewer (1971) showed that in income-compensated demand equations, cross-price and substitution effects are symmetrical. If sufficiently small budget amounts are involved, the income effect of substitution is negligible and the total cross-price effects in related statistical demand equations such as these should be approximately equal. I have seen no conclusive evidence yet, so I plan to explore this possibility. I have not constrained cross-price coefficients in the estimates reported here.
However, I have added another constraint: none of the cross-price coefficients should be negative. Briefly, my reasoning is that angling in one county would not likely compliment angling of the same general kind in another county. Such compliments should not appear in these equations because there is no constraint that sites with simultaneously similar prices would be adjacent—they could be in opposite directions for anglers from many origins. Complimentarity can be expressed either as part of the definition of the product, or as a reduced price for one site once the angler reaches the complimentary site. I have not attempted to formulate equations of the latter form.
Simulating Changes in Supply
The specific kinds of angling available at various sites can be changed by actions which alter any attributes anglers find important. For example, this is usually the objective of management activities such as improving stream habitats, planting hatchery-reared fish, or imposing new angling regulations; but it also may result from other sources such as industrial pollution, crowding, or riparian development activities.
Changing the product available at any site has two opposite effects for at least some anglers: decreasing the supply (or availability) of the former product and increasing the supply of the new product. The price of the former product increases for those anglers who must now travel farther for that product, whereas the price of the new product decreases for anglers who now find that product closer. These effects will differ for anglers from each different origin, but anglers from some origins may not be affected at all if perfect substitutes are less expensive elsewhere.
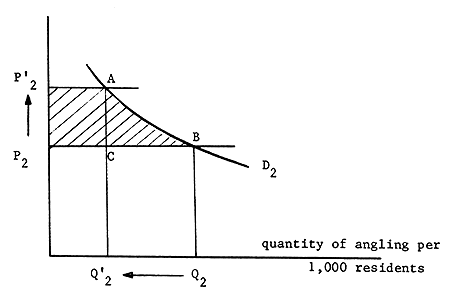
The gains and losses in value to anglers from each origin may be estimated as the areas under the demand curves between the new and old prices (supply curves) as illustrated in Fig. 3. If the new product and former product are substitutes for each other, each demand curve will shift as the prices of the substitutes change. The demand curves for other products may also shift. An arbitary but common sense evaluation procedure is to consider the reduction in supply of the former product assuming that the price of the new product has not changed, and to consider the increase in supply of the new product assuming that the price of the former product has already increased (see Fig. 3). This seems to follow a logical time sequence of events.
This procedure estimates the maximum consumer willingness to pay to promote and prevent the change, including the associated changes in consumer surplus. This is the all-or-none value of the change in supply. However, for some purposes the market value of the change is more appropriate. For example, in Europe, owners of angling rights may wish to know how a potential change in angling attributes will influence their revenue. Changes in revenue for a given origin can easily be estimated from Fig. 3. A fishery resource owner who can discriminate among anglers on the basis of origin could theoretically collect all of the change in willingness to pay except the consumer surplus triangles ABC and DEF in Fig. 3. There is also a maximum revenue available to a non-discriminating resource owner. Other revenue strategies are also possible. The presence of markets for angling rights in Europe helps establish market values, but in the U.S. any one market price strategy may be difficult to defend as establishing “the” market value.
Price ($ per angler day)
a.
Price ($ per angler day)
b.
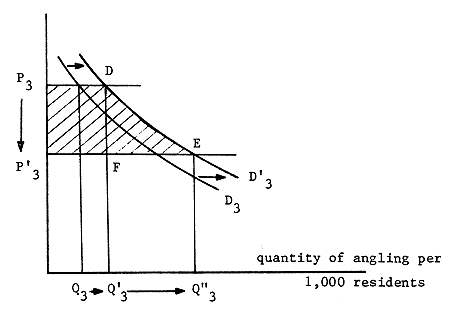
Fig. 3. Illustration of the change in value brought about by a change in the angling product at a particular location, evaluated for anglers residing at that location.
Loss in value due to reduction in supply (increase in price) of product 2. The quantity of angling is reduced from Q2 to Q'2 as the price increases.
Shift in the demand for product 3 (brought about by an increase in P2) increases the amount of angling from Q3 to Q'3. The shaded area indicates the value of the increase in the supply (lower price) of product 3. The quantity of angling increases from Q'3 to Q"3 as price decreases.
SIMULATING AND EVALUATING ANGLING SUPPLY ALTERNATIVES IN MICHIGAN
In my studies mentioned earlier I have constructed computer models capable of simulating a wide range of supply conditions. These simulation models include (1) the demand equations, (2) the price equation, (3) the inventory of products and substitutes available throughout the system, (4) population and other socioeconomic variables for each origin, and (5) the travel time or distance from each origin to each destination. My simulation model of Michigan's Great Lakes angling in 1976 includes 79 demand equations for eight different general kinds of angling: angling for salmonids on the Great lakes during the winter-spring, summer and fall periods; angling in tributaries for lake-run salmon and steel-head trout during the winter-spring and fall periods; and angling in the Great Lakes for nonsalmonids during the winter-spring, summer and fall periods (Korson and Talhelm 1978; Korson 1979; Jordan and Tallhelm 1979).
Four different kinds of supply changes evaluated with the simulation model will be briefly discussed here to illustrate the use of the technique: (1) completely eliminating Michigan's entire Great Lakes sport fishery, (2) eliminating Michigan's salmonid angling in areas in which American Indians are claiming unlimited commercial fishing rights, (3) extending the Grand River's fall salmon and fall-winter-spring steel-head trout migration farther upstream into central lower Michigan by constructing “fish ladders” on several dams that presently block the migrations on the upper half of the river, and (4) eliminating salmonid angling in Michigan's Lake Superior, as might result from a reduction in the sea lamprey control program there. All values are given in 1976 dollars. Other kinds of changes may also be evaluated, such as changing the angling success rate in one county or a series of counties by altering fish stocking activities, or simulating possible competition between sport and commercial fisheries to estimate the tradeoffs.
The all-or-none value (willingness to pay) of Michigan's entire Great Lakes fishery was estimated at $78 to $149 million per year in 1976 dollars depending upon various assumptions. About 6,7 million angler days per year would be lost. An all-or-none value of $105 million per year was estimated by simultaneously increasing the prices of all 79 products in small increments. When products were eliminated sequentially, starting with product one and ending with product 79 the loss was estimated at $85 million per year. In this case after each product was eliminated, its price in subsequent calculations (as a substitute in the demand equation for other products) was assumed to be arbitrarily high at a price based upon the maximum travel distance found within Michigan. A larger value of $149 million per year was estimated in the same manner but starting with product 79 and working backwards. Evaluating each product independently of all others—assuming that the prices of all substitutes remain at their current levels—the all-or-none value was estimated at $78 million per year. In all of these cases the prices of inland angling were assumed to remain unchanged. In some cases this is unrealistic since additional crowding at inland sites would probably reduce success rates, reducing the supply of moderate and high success rate angling.
The effects of eliminating salmonid angling in the Indian fishing areas—most of Lakes Michigan and Superior and a small part of Lake Huron—were estimated in two phases. First, eliminating angling for salmonids in the treaty counties would represent a loss of about $8-10 million per year, a reduction in angling effort of about 700 000 angler days, and a shift to other areas of about 1,8 million angler days. Second the shift in effort would likely reduce angling success per unit of effort in other portions of the state, representing a second loss of about $9 million and a reduction of effort of another 1,5 million angler days.
Extending the salmon and steelhead trout migrations farther up the Grand River would increase angler values by $5 to 410 million, depending upon the level of angler success per unit of effort and other assumptions. Four Michigan counties would have the new fisheries. Programs such as this can also be evaluated under several different assumptions: (1) that each county experiences a change in supply independently of the others (this would be unrealistic unless only one county were actually to be changed), (2) that the change occurs first in one county, then the next, and so on, or (3) that the change is simultaneous in all counties. The first and second cases are easier to estimate, and both were tried in evaluating this change. The first assumptions greatly overestimate the impacts. The second may also overestimate the impacts, but to a lesser degree. Estimates in the second case also depend upon the order in which the changes are simulated in the counties.
Reducing the sea lamprey control program in Lake Superior will reduce angling values by an estimated $1,4 million per year.
LITERATURE CITED
Becker, G.S. 1965 A theory of the allocation of time. Econ. J., 75:493–519.
Burt, O.D. and D. Brewer. 1971 Evaluation of net social benefits from outdoor recreation. Econometrica, 39:813–837.
Jordan, S.W. and D.R. Talhelm. 1979 An economic model for evaluating alternative management strategies for Great Lakes salmonid and nonsalmonid fisheries. Mich. State Univ., E. Lansing. Unpublished paper presented at Int. Assoc. for Great Lakes Research, Buffalo, NY, 23p.
Korson, C.S. 1979 Defining angling quality, and estimating demand for Michigan's 1976 Great Lakes salmonid and non-salmonid sport fisheries. Unpubl. M.S. Thesis, Mich. State Univ., Lansing, xi+132 p.
Korson, C.S. and D.R. Talhelm. 1978 Defining angling quality for Michigan's salmonid and nonsalmonid fisheries. Mich. State Univ., E. Lansing. Unpublished paper, presented at Int. Assoc. for Great Lakes Research, Windsor, Ont., 18p.
Talhelm, D.R. 1971 Measurements of non-market resource values. Am. J. Agric. Econ., 53:904.
Talhelm, D.R. 1972 Analytical economics of outdoor recreation: a case study of the Southern Appalachian trout fishery. Ph. D. thesis, N.C. State Univ., Raleigh, xvii+308 p.
Talhelm, D. R. 1973a Defining and evaluating recreation quality. Trans. N. Am. Wildl. Nat. Resour. Conf., 38:183–191.
Talhelm, D. R. 1973b Evaluation of the demands for the salmon and steelhead sport fishery of 1970-A condensed report. In Mich. Dept Natural Resources, Michigan's Great Lakes trout and salmon fishery (1969–72). Lansing. Fish. Manage. Rep., 5:62–70.
Talhelm, D.R. 1973c Evaluation of the demands for the salmon and steelhead sport fishery of 1970. Fishery Rep. 1797. Lansing, Mich. Dep. Nat. Resour., 69p.
Talhelm, D.R. 1976 The demand and supply of fishing and boating on inland lakes in Michigan. Lansing, Mich., Dep. Nat. Resour., Recreation Services, 67p.
Hendrik A. van Alderwegen
Institute for Land and Water Management Research, Wageningen, The Netherlands
ABSTRACT
A geographical confrontation among sport fishermen within the Netherlands over available inland-fishing waters is illustrated. Some results of recent Dutch research regarding the assessment of demand for sport fishing are given and an objective method to determine the capacity norm of banks used for sport fishing is elaborated. Application of the thus gained data in a regional supply and demand analysis for sport fishing is explained and illustrated.
RÉSUMÉ
L'ouvrage fait une étude comparative, pour toutes les régions du pays, de la densité de pêcheurs et des ressources en eaux intérieures disponibles pour la pêche. Il donne quelques résultats des recherches récemment effectuées en Hollande sur l'évaluation de la demande de pêche sportive et établit une méthode objective pour déterminer la capacité en pêcheur des berges utilisées. L'ouvrage explique et illustre l'application des données ainsi obtenues dans une analyse de la demande régionale de pêche sportive.
INTRODUCTION
The natural facilities for sport fishing in the Netherlands are the North Sea shores and the many inland waters, such as estuaries, streams, canals and lakes. In Fig. 1 the surface area as well as the location of the inland waters are schematically given. A detailed assessment of the suitability of fishing did bring to light, however, that no less than two-thirds of the total area of inland waters is unfit for sport fishing (de Groot and van Haasteren 1979).
The primary condition for recreational use of inland waters is location near urban areas. In the Netherlands the population is mostly concentrated in the mid-western part of the country and so are the sport fishermen. For the rest, the number of people having a sport fishing licence varies greatly in accordance with the supply of inland waters. The geographical confrontation between population (sport fishermen) and inland (fishing) waters is illustrated in Fig. 2 for the eleven Dutch provinces. It appears that from a national point of view there is no large spatial discrepancy between supply and demand of sport fishery facilities. This does not imply, however, there is no discrepancy on a regional and local level as well. To achieve the aim of the actual governmental recreation policy, i.e., creation of a diversity of recreation facilities in accordance with the preference of the population with emphasis on good attainability for all social groups, a system for a regional supply and demand analysis for sport fishing has been developed.
In this paper some results of recent research in this field are discussed and the way in which results can be applied in the analysis method is illustrated.
DATA GATHERING AND INTERPRETATION
With respect to research on behavior, preferences and needs of sport fishermen, there are two ways to collect data, i.e.,
by way of surveying ‘users’ (on site);
by way of surveying ‘people’ (at home).
A result of a national home survey about the participation in sport fishing, as derived from the recreation survey of the Netherlands Central Bureau for Statistics (CBS 1978), is shown in Fig. 3. Here the participation of the Dutch population in sport fishing is given for the weekends.
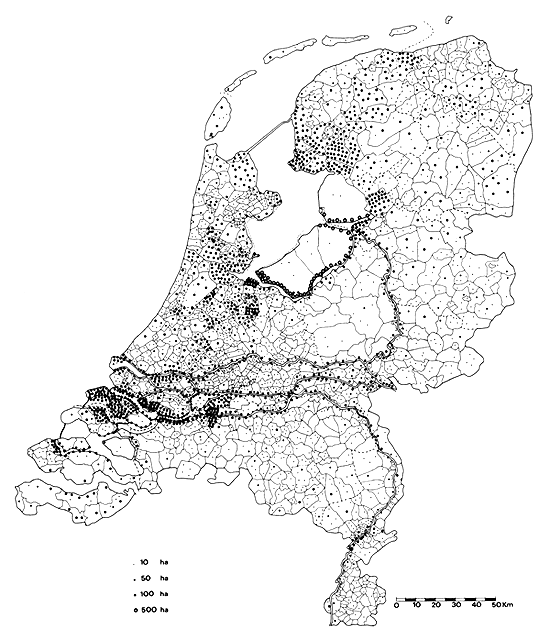
Fig. 1. Municipality map of the Netherlands with indication of the surface area of inland waters.
The course of the number of sport fishermen in possession of a sport fishing licence is known from the Yearbooks of Issued Licences (Steinmetz 1976 and 1979). The yearly increase of the number of Dutch sport fishermen having a sport fishing licence since 1964/1965 is given in Fig. 4. Similar results are obtained from ‘on site’ data gathering through the administration of day-permits being issued in the fishing locations of Hoensbroek and Achttienhoven during a number of years, see Fig. 5. Besides giving an insight into participation development, these data can also be applied for the construction of curves for the amount of day visits reached or exceeded. The curve based on the CBS-survey in 1975 is given in Fig. 6, while curves for four separate places are given in Fig. 7.
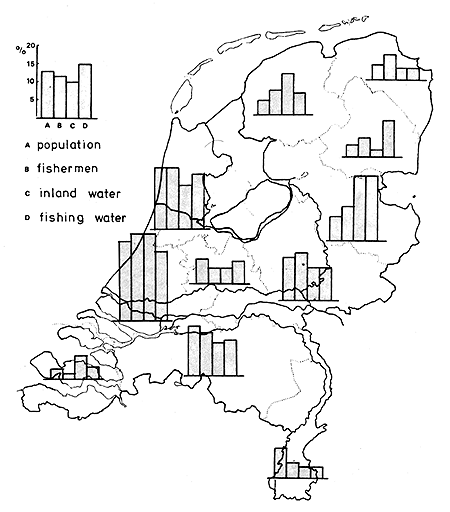
Fig. 2. Spatial distribution over the 11 Dutch provinces of total population, sport fishermen, inland waters and fishing waters.
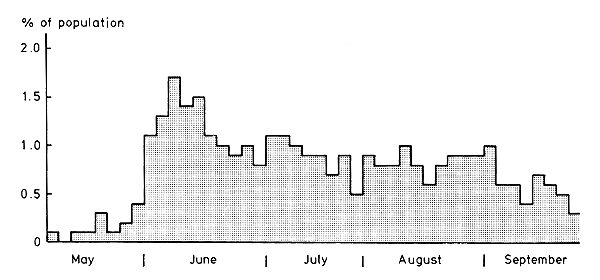
Fig. 3. Participation of Dutch population in sport fishing during weekends of the period April through September 1975.
In general it is advisable to base these curves on data over a range of years to eliminate the effects of seasonal fluctuations, in particular of meteorological origin. The relation between participation in sport fishing and weather conditions in the Netherlands is shown in Table 1. Here the weather has been characterized by mean temperature, cloudiness and precipitation.
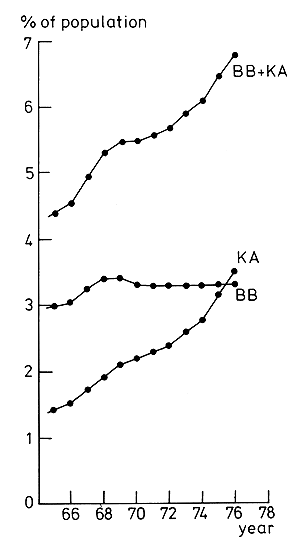
Fig. 4. Increase in the number of Dutch sport fishermen with a licence since 1963/64 (3-year means). BB = angling certificate for fishing with one rod only; KA = small fishing licence.
For regional analysis, knowledge is also required about the willingness of sport fishermen to bridge a certain distance to their fishing sites, analogous to the sphere of influence of a place in an on-site survey. Cumulative distance distribution curves for anglers visiting four different fishing waters as based on on-site surveys and of all fishing trips of the Dutch sport fishing population as based on a home survey, respectively, are given in Fig. 8. The course of the place curves is influenced by the location of population areas and alternative fishing waters; Hoensbroek for instance is a typical urban facility while Achttienhoven is a typical rural site. Results of onsite surveys indicate the way in which the objects are being used. On-site surveys are also useful for obtaining information about the preferences and needs of the users, i.e., anglers.
For the adjustment of the supply of fishing facilities to the demand, determination of the capacity of the supply expressed as a number of fishing places is required. Therefore, some onsite surveys have been carried out to assess a capacity norm for the banks used for sport fishing, for which the preferred minimum distance between fishing individuals is to be known.
Sport fishing (coarse fishing) in the Netherlands can be considered to be a social occupation, as is demonstrated by the preference of many respondents of an on-site survey to sit more close to companions than to other people, as is illustrated in Table 2 (van Oostrum 1971).
An objective method to obtain from these data a norm for the social capacity of banks used for sport fishing can be described as follows.
In an on-site survey the opinion of the respondents about the acceptability of crowding present at the moment of the interview, as well as the location of anglers near the respondent are registered. After having classed the respondents per number of other fishermen present within a certain distance, a histogram as given in Fig. 9 is drawn. In this graph the percentage of respondents who are of opinion that it is too crowded at that moment is plotted against the number of other anglers being within a certain distance, for example 50 and 100 m respectively. From this, the nomogram of Fig. 10 can be derived, which gives the observed number of other sport fishermen within a certain distance for several percentages of respondents being of the opinion that it is too crowded. The tangents give a norm for the social capacity of the banks expressed as a number of anglers per 100 m. If the policy maker accepts a capacity norm accepted by 90% of the sport fishermen in this fictional case, this norm will be 15 m of bank per sport fisherman (= 100/6,6).
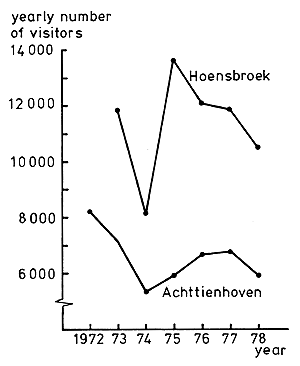
Fig. 5. Course of the yearly number of visitors to Hoensbroek and Achttienhoven since 1972.
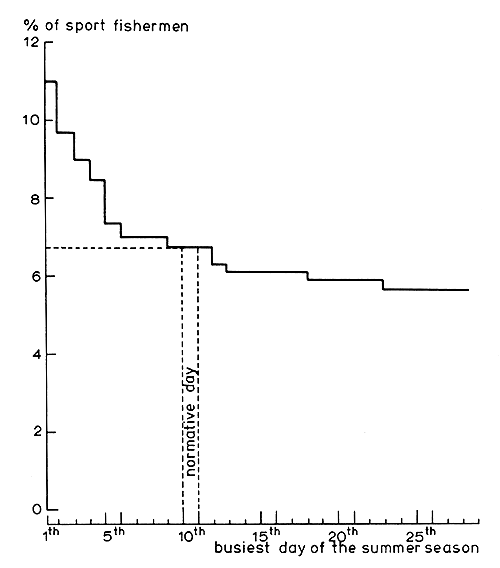
Fig. 6. Curve of the amount of day visits reached or exceeded by Dutch sport fishermen during 1975.
REGIONAL SUPPLY AND DEMAND ANALYSIS
The results of such research can be applied in a scheme for a regional supply and demand analysis. The starting point of this analysis agrees with the aim of the actual recreation policy: there has to be sufficient space (number of fishing places) for anyone who wants to fish on the tenth crowded day in a normal year and the distance between fishing site and home should not exceed 15 km. The capacity norm applied for the banks is 25 m per sport fisherman.
The method consists of three parts:
Determination of the number of anglers in a municipality. In the Netherlands angling licences are obtainable in all post-offices and the number of licences per municipality is published yearly. Therefore the number of sport fishermen with a licence is known per municipality. Not all anglers buy a licence, however (illegal fishermen and a large number of children). One of the results of the national recreation survey (CBS 1978) is that 1 909 000 Dutchmen had been angling in inland water one or several times during that season, whereas in 1975 a total of only 863 700 sport fishing licences had been issued. So the total number of sport fishermen in a municipality proves to be about 2,2 times the number of licences that have been issued.
Determination of the percentage of sport fishermen that will be fishing on the normative day. To assess the number of fishing sites needed, one has to take into account that not all sport fishermen will be fishing on the same day. As premise, the tenth crowded day is taken as the normative day. From the participation curve of the Dutch sport fishermen (Fig. 6) it appears that on the 10th day, 7% of the sport fishermen will be angling.
Determination of the percentage of sport fishermen that will be fishing on the most crowded moment of the normative day. With the aid of the results of the national sport fishery survey (ITS 1975) concerning the start and finish time of fishing trips on crowding days during the summer season, the maximum number of anglers as part of the day visits can be calculated (see Fig. 11). Evidently the maximum momentary visit on the normative day amounts to 63% of that day visit.
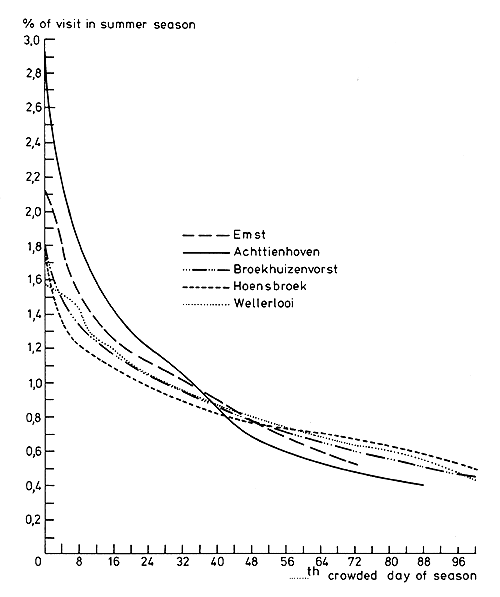
Fig. 7. Curves of the amount of day visits reached or exceeded for five fishing places as derived from data obtained during several seasons.
Table 1. Relation between the index of participation of Dutchmen in sport fishing and weather conditions.
| Precipitation | ||||||||||
| <2 mm | 2–5 mm | >5 mm | ||||||||
| Sunny | Half | Cloudy | Sunny | Half | Cloudy | Sunny | Half | Cloudy | ||
| Temperature | ||||||||||
| Above normal | 100 | 103 | 112 | 88 | 86 | 119 | 73 | |||
| Normal | 89 | 91 | 76 | 73 | 71 | |||||
| Below normal | 129 | 81 | 124 | 93 | 118 | 85 | 81 | 116 | ||
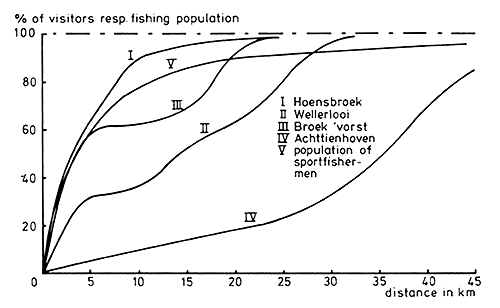
Fig. 8. Cumulative distance distribution of visitors to four fishing places and of the population engaged in sport fishing.
Table 2. Preferred distance between respondents and companions and between respondents and other fishermen.
| Preferred distance | To companion fishermen | To other fishermen |
| 0–10 m | 76% | 37% |
| 10–20 m | 15% | 35% |
| 20–50 m | 8% | 19% |
| >50 m | 0% | 8% |
| no opinion | 1% | 1% |
| Total | 100% | 100% |
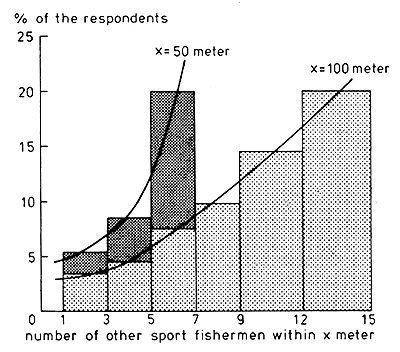
Fig. 9. Percentage of respondents who are of the opinion it is too crowded with respect to the observed number of fishermen within distances of 50 or 100 meters.
On the basis of these data the need of sport fishing facilities can be estimated per municipality. The number of fishing sites needed by the population of a municipality is equal to the number of sport fishermen fishing simultaneously on the 10th crowded day of a normal year and is equal to the number of sport fishing licences being issued in that town multiplied by 2,2×0,07×0,63.
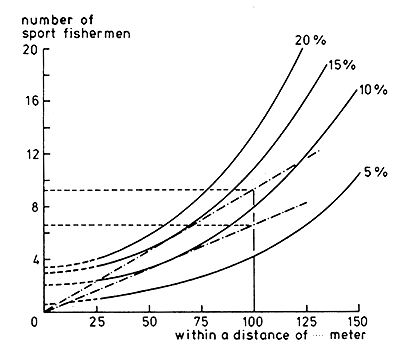
Fig. 10. Observed number of fishermen within a certain distance for several percentages of respondents who feel it is too crowded.
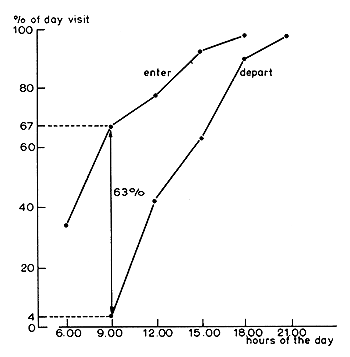
Fig. 11. Cumulative frequency of start and finish time of fishing stays on the normative day for the determination of the maximum momentary visit.
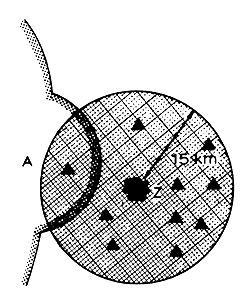
 | boundary of planning area |
 | normative distribution area of anglers from origin Z |
| ▲ | 100 ha inland water |
Fig. 12. Spatial distribution of anglers from origin Z on the basis of the spatial distribution of fishing water.
To answer the question whether the supply of sport fishing facilities within a certain planning area will answer the demand for fishing, the following scheme can be used. In this scheme the number of sites needed per municipality has been converted into the demand for sport fishing sites within a planning area.
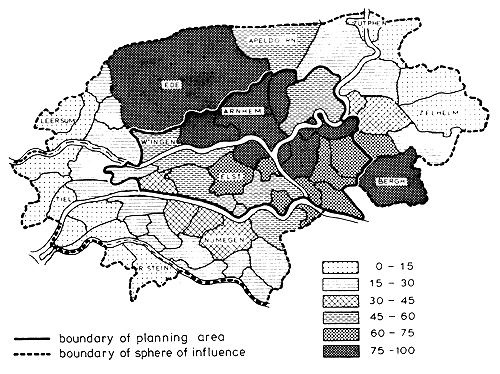
Fig. 13. Percentage of sport fishermen living in municipalities within the sphere on influence of the planning area Veluwezoom, claiming sport fishing facilities in that planning area.
As a matter of policy it is taken, that on a normative day the distance between home and fishing site should not exceed 15 km. Consequently, assessment of the pressure of sport fishermen within a planning area, requires that all municipalities lying within a distance of 15 km from this area should be taken into account. The percentage of sport fishermen coming from a municipality that lays a claim on the facilities within the planning area, is assumed to equal the same percentage of the supply capacity of fishing water within a distance of 15 km from the center of the town, situated within the planning area. So in the hypothetical case of Fig. 12, 10% of the sport fishermen from Z are to be taken into account in the calculation of sport fishing demand in planning area A.
Applying the method given above to the planning area Veluwezoom gives as a result the sport fishing demand as given in Fig. 13.
FINAL REMARKS
The regional supply and demand analysis presented here is based on national behavior and preferences of sport fishermen. Obviously these characteristics will vary per region with the mental constitution of the local people (number of illegal fishermen), their particular behavior (extent of participation in sport fishing on the normative day) and their particular preferences (capacity norm). For an adequate sport fishing policy, therefore, future sport fishing surveys also will have to concentrate on the gaining of specified knowledge about the regional variations in behavior and preferences of sport fishermen.
LITERATURE CITED
Centraal Bureau voor de Statistiek (CBS). 1978 Onderzoek naar vakanties en uitgaan 1975. 's-Gravenhage.
De Groot, A.T. and L.M. van Haasteren. 1979 Samenvatting provinciale informatienota's sportvis-serij. 's-Gravenhage. Directorate of Fisheries.
Instituut voor Toegepaste Sociologie (ITS). 1975 De Nederlandse sportvisser. Nijmegen.
Steinmetz, B. 1976 De in de visseizoenen 1973/74 en 1974/75 per gemeente uitgereikte publiekrechtelijke visdocumenten. Doc. rapport No. 19, Directorate of Fisheries, 's-Gravenhage.
Steinmetz, B. 1979 De in de visseizoenen 1975/76, 1976/77 en 1977/78 per gemeente uitgereikte publiekrechtelijke visdocumenten. Doc. rapport No. 22, Directorate of Fisheries, 's-Gravenhage.
van Alderwegen, H.A., B. Steinmetz and A.T. de Groot. 1978 Rekenschema voor bepaling huidige vraag naar visplaatsen in een regio. Miscellaneous Reprint No. 207, Institute for Land and Water Management Research (ICW), Wageningen.
van Alderwegen, H.A., J.G. Bakker and A.C. Distel. 1979 Verslag van vooronderzoek naar druktebeleving door sportvissers. Internal Report, Institute for Land and Water Management Research (ICW), Wageningen.
van Oostrum, H.J. 1971 Resultaten van een sportvisserij-onderzoek in Drente. Cultuurt. Tijdschr., 10:275–288.
![]()
![]()
![]()