![]()
![]()
![]()
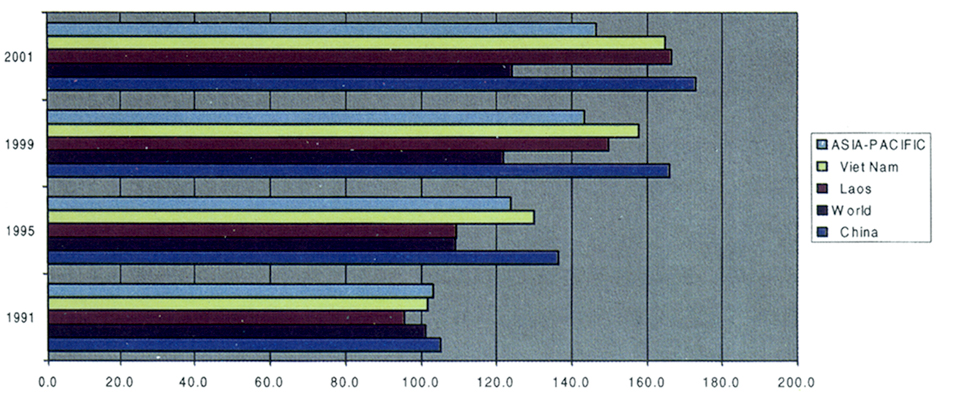
Table 10. Agricultural production indices
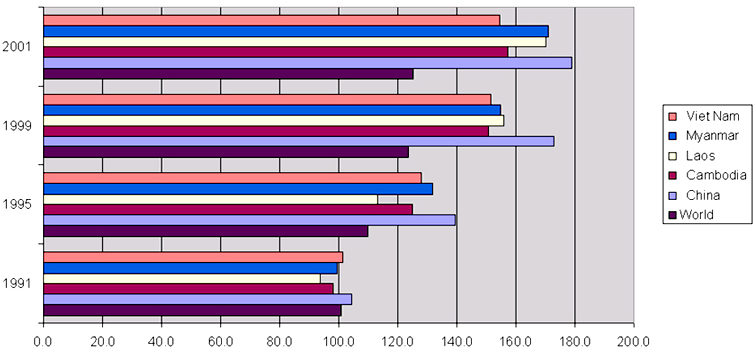
Table 11. Food production indices
|
(1989-91 = 100, gross production of agricultural products)* |
||||||
|
Country |
1991 |
1993 |
1995 |
1997 |
1999 |
2001 |
|
DEVELOPING COUNTRIES |
||||||
|
1. Bangladesh |
102.2 |
103.4 |
103.2 |
111.6 |
127.0 |
139.2 |
|
2. Bhutan |
101.6 |
104.6 |
113.2 |
119.7 |
117.5 |
117.5 |
|
3. Cambodia |
98.7 |
104.1 |
125.0 |
132.3 |
149.6 |
155.8 |
|
4. China |
105.1 |
120.7 |
136.5 |
154.7 |
166.1 |
173.0 |
|
5. Cook Islands |
95.2 |
86.8 |
77.2 |
89.4 |
96.9 |
96.9 |
|
6. DPR Korea |
102.5 |
96.7 |
79.5 |
72.8 |
87.5 |
87.8 |
|
7. Fiji |
95.3 |
95.0 |
102.4 |
97.2 |
100.2 |
98.8 |
|
8. India |
100.9 |
108.2 |
115.1 |
121.6 |
129.6 |
127.8 |
|
9. Indonesia |
102.2 |
111.8 |
120.2 |
117.9 |
117.6 |
116.9 |
|
10. Iran |
106.8 |
125.9 |
131.1 |
134.6 |
144.7 |
130.9 |
|
11. Laos |
95.6 |
101.7 |
109.4 |
124.5 |
149.7 |
166.6 |
|
12. Malaysia |
103.4 |
114.2 |
117.2 |
121.2 |
124.6 |
131.7 |
|
13. Maldives |
102.7 |
108.5 |
112.9 |
115.5 |
130.4 |
129.9 |
|
14. Mongolia |
105.3 |
81.3 |
83.5 |
88.2 |
104.5 |
103.4 |
|
15. Myanmar |
99.5 |
121.7 |
131.1 |
136.4 |
154.5 |
170.3 |
|
16. Nepal |
100.4 |
106.1 |
112.3 |
118.2 |
121.3 |
132.1 |
|
17. Pakistan |
106.9 |
108.6 |
123.3 |
129.3 |
138.6 |
136.9 |
|
18. Papua New Guinea |
98.8 |
110.5 |
106.8 |
113.4 |
123.2 |
125.6 |
|
19. Philippines |
100.0 |
107.2 |
111.0 |
123.0 |
124.1 |
133.7 |
|
20. Rep. of Korea |
98.0 |
111.3 |
112.9 |
125.4 |
129.4 |
128.6 |
|
21. Samoa |
86.0 |
93.3 |
88.0 |
94.0 |
92.3 |
99.1 |
|
22. Solomon Islands |
103.7 |
107.4 |
122.3 |
131.1 |
138.2 |
147.0 |
|
23. Sri Lanka |
100.6 |
105.3 |
116.4 |
111.2 |
119.8 |
122.5 |
|
24. Thailand |
103.8 |
106.5 |
113.4 |
118.9 |
116.6 |
122.5 |
|
25. Tonga |
105.2 |
123.1 |
91.6 |
96.0 |
98.3 |
97.6 |
|
26. Vanuatu |
98.4 |
99.9 |
104.4 |
122.7 |
107.9 |
111.1 |
|
27. Viet Nam |
101.9 |
116.9 |
129.9 |
143.3 |
157.8 |
164.9 |
|
DEVELOPED COUNTRIES |
||||||
|
1. Australia |
101.4 |
108.0 |
107.9 |
118.3 |
131.5 |
131.3 |
|
2. Japan |
97.4 |
94.0 |
97.2 |
95.1 |
92.3 |
91.5 |
|
3. New Zealand |
101.6 |
103.1 |
112.5 |
120.2 |
114.4 |
123.8 |
|
ASIA-PACIFIC |
103.1 |
113.5 |
123.8 |
134.6 |
143.3 |
146.5 |
|
WORLD |
101.2 |
104.1 |
109.2 |
116.7 |
121.9 |
124.0 |
|
*Including all crops and livestock products except fodder crops. |
||||||
|
(1989-91 = 100, gross production of food
products)* |
||||||
|
Country |
1991 |
1993 |
1995 |
1997 |
1999 |
2001 |
|
DEVELOPING COUNTRIES |
||||||
|
1. Bangladesh |
102.0 |
103.5 |
103.7 |
111.3 |
129.0 |
141.2 |
|
2. Bhutan |
101.6 |
104.6 |
113.2 |
119.8 |
117.5 |
117.5 |
|
3. Cambodia |
98.2 |
104.3 |
125.0 |
132.4 |
150.7 |
157.4 |
|
4. China |
104.6 |
122.6 |
139.7 |
158.1 |
172.8 |
179.0 |
|
5. Cook Islands |
95.1 |
86.8 |
76.8 |
89.0 |
96.8 |
96.8 |
|
6. DPR Korea |
102.6 |
96.9 |
79.4 |
72.6 |
88.0 |
88.2 |
|
7. Fiji |
95.3 |
95.0 |
102.7 |
97.4 |
100.5 |
99.1 |
|
8. India |
101.0 |
108.5 |
115.2 |
122.3 |
130.1 |
128.8 |
|
9. Indonesia |
102.1 |
112.0 |
120.6 |
118.3 |
117.5 |
117.0 |
|
10. Iran |
106.9 |
126.8 |
131.1 |
134.7 |
144.2 |
130.1 |
|
11. Laos |
93.6 |
103.2 |
113.2 |
126.2 |
156.2 |
170.3 |
|
12. Malaysia |
105.2 |
121.1 |
124.6 |
131.2 |
138.7 |
148.3 |
|
13. Maldives |
102.7 |
108.5 |
112.9 |
115.5 |
130.4 |
129.9 |
|
14. Mongolia |
105.4 |
79.5 |
79.1 |
88.2 |
104.8 |
103.1 |
|
15. Myanmar |
99.6 |
122.0 |
131.8 |
136.0 |
155.0 |
170.8 |
|
16. Nepal |
100.4 |
106.3 |
112.5 |
118.5 |
121.6 |
132.5 |
|
17. Pakistan |
103.8 |
113.9 |
127.3 |
137.3 |
144.6 |
143.5 |
|
18. Papua New Guinea |
100.4 |
110.5 |
107.9 |
114.5 |
121.2 |
123.6 |
|
19. Philippines |
100.1 |
107.5 |
112.1 |
124.6 |
126.2 |
136.2 |
|
20. Rep. of Korea |
98.1 |
110.9 |
113.2 |
126.7 |
130.5 |
129.9 |
|
21. Samoa |
85.4 |
92.9 |
87.4 |
93.7 |
91.8 |
99.0 |
|
22. Solomon Islands |
103.8 |
107.4 |
122.4 |
131.2 |
138.3 |
147.1 |
|
23. Sri Lanka |
99.4 |
106.3 |
119.2 |
108.9 |
120.4 |
123.3 |
|
24. Thailand |
103.5 |
104.9 |
111.7 |
117.1 |
114.9 |
120.2 |
|
25. Tonga |
105.2 |
123.1 |
91.6 |
96.0 |
98.4 |
97.6 |
|
26. Vanuatu |
98.4 |
99.9 |
104.4 |
122.6 |
107.8 |
111.0 |
|
27. Viet Nam |
101.4 |
116.3 |
128.0 |
138.6 |
151.6 |
154.8 |
|
DEVELOPED COUNTRIES |
||||||
|
1. Australia |
100.2 |
114.4 |
118.4 |
129.6 |
147.4 |
145.2 |
|
2. Japan |
97.4 |
94.3 |
97.6 |
95.6 |
92.8 |
92.1 |
|
3. New Zealand |
102.8 |
107.8 |
117.0 |
127.2 |
121.6 |
133.2 |
|
ASIA-PACIFIC |
102.7 |
114.9 |
125.7 |
137.0 |
147.0 |
150.0 |
|
WORLD |
100.9 |
104.6 |
110.0 |
117.7 |
123.6 |
125.4 |
|
*Including all products that are considered edible and
contains nutrients |
||||||
![]()
![]()
![]()