![]()
![]()
![]()
Table 68. Jute and jute-like fibres: production
Table 69. Jute and jute-like fibres: yield
Table 70. Jute and jute-like fibres: area harvested
Table 71. Seed cotton: production
Table 72. Seed cotton: yield
Table 73. Seed cotton: area harvested
Table 74. Raw silk: production (including waste)
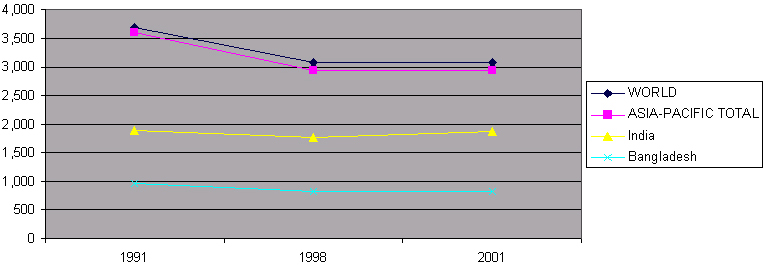
Production of jute and jute-like fibres (1000 MT) and largest producers in Asia-Pacific region
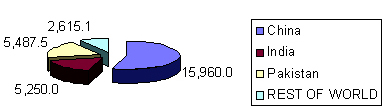
Seed cotton production (1000 MT) in 2001
|
Unit: 1000 MT |
||||||||||||
|
|
|
|
|
|
|
|
|
|
|
|
Annual |
|
|
Country |
1991 |
|
1998 |
|
1999 |
|
2000 |
|
2001 |
|
Growth Rate |
|
|
|
|
|
|
|
|
|
|
|
|
|
1991 - 2001 |
|
|
DEVELOPING COUNTRIES |
||||||||||||
|
1. Bangladesh |
966.9 |
|
813.0 |
|
712.0 |
|
822.0 |
|
822.0 |
F |
-1.6 |
% |
|
2. Bhutan |
0.3 |
F |
0.3 |
F |
0.3 |
F |
0.3 |
F |
0.3 |
F |
0.9 |
% |
|
3. Cambodia |
1.3 |
|
1.1 |
|
0.3 |
|
0.2 |
|
0.2 |
|
-19.6 |
% |
|
4. China |
513.0 |
* |
248.0 |
* |
165.0 |
* |
125.9 |
* |
136.0 |
F |
-14.9 |
% |
|
5. Cook Islands |
- |
|
- |
|
- |
|
- |
|
- |
|
- |
|
|
6. DPR Korea |
- |
|
- |
|
- |
|
- |
|
- |
|
- |
|
|
7. Fiji |
- |
|
- |
|
- |
|
- |
|
- |
|
- |
|
|
8. India |
1,895.4 |
|
1,766.0 |
|
1,896.1 |
|
1,867.7 |
|
1,875.0 |
F |
1.4 |
% |
|
9. Indonesia |
10.3 |
|
7.2 |
|
7.5 |
F |
7.5 |
F |
7.5 |
F |
-4.1 |
% |
|
10. Iran |
0.1 |
|
0.1 |
F |
0.1 |
F |
0.1 |
F |
0.1 |
F |
-0.1 |
% |
|
11. Laos |
- |
|
- |
|
- |
|
- |
|
- |
|
- |
|
|
12. Malaysia |
- |
|
- |
|
- |
|
- |
|
- |
|
- |
|
|
13. Maldives |
- |
|
- |
|
- |
|
- |
|
- |
|
- |
|
|
14. Mongolia |
- |
|
- |
|
- |
|
- |
|
- |
|
- |
|
|
15. Myanmar |
24.3 |
|
33.1 |
|
33.5 |
|
33.4 |
|
41.9 |
|
4.1 |
% |
|
16. Nepal |
16.0 |
|
15.5 |
|
15.7 |
|
15.2 |
|
16.4 |
|
1.3 |
% |
|
17. Pakistan |
3.5 |
|
1.9 |
|
1.9 |
|
2.2 |
|
2.2 |
F |
-5.2 |
% |
|
18. Papua New Guinea |
- |
|
- |
|
- |
|
- |
|
- |
|
- |
|
|
19. Philippines |
- |
|
- |
|
- |
|
- |
|
- |
|
- |
|
|
20. Rep. of Korea |
- |
|
- |
|
- |
|
- |
|
- |
|
- |
|
|
21. Samoa |
- |
|
- |
|
- |
|
- |
|
- |
|
- |
|
|
22. Solomon Islands |
- |
|
- |
|
- |
|
- |
|
- |
|
- |
|
|
23. Sri Lanka |
- |
|
- |
|
- |
|
- |
|
- |
|
- |
|
|
24. Thailand |
142.9 |
|
49.5 |
|
34.3 |
|
33.6 |
|
33.6 |
F |
-16.1 |
% |
|
25. Tonga |
- |
|
- |
|
- |
|
- |
|
- |
|
- |
|
|
26. Vanuatu |
- |
|
- |
|
- |
|
- |
|
- |
|
- |
|
|
27. Viet Nam |
25.3 |
|
14.6 |
|
9.4 |
|
11.3 |
|
11.5 |
|
-8.1 |
% |
|
SUB-TOTAL |
3,599.2 |
|
2,950.3 |
|
2,876.0 |
|
2,919.2 |
|
2,946.7 |
|
-1.7 |
% |
|
DEVELOPED COUNTRIES |
||||||||||||
|
28. Australia |
- |
|
- |
|
- |
|
- |
|
- |
|
- |
|
|
29. Japan |
0.0 |
|
0.0 |
|
0.0 |
|
0.0 |
|
0.0 |
|
|
|
|
30. New Zealand |
- |
|
- |
|
- |
|
- |
|
- |
|
- |
|
|
SUB-TOTAL |
0.0 |
|
0.0 |
|
0.0 |
|
0.0 |
|
0.0 |
|
|
% |
|
ASIA-PACIFIC TOTAL |
3,599.2 |
|
2,950.3 |
|
2,876.0 |
|
2,919.2 |
|
2,946.7 |
|
-1.7 |
% |
|
REST OF WORLD |
106.1 |
|
121.6 |
|
118.6 |
|
116.2 |
|
118.0 |
|
-2.8 |
% |
|
WORLD |
3,705.3 |
|
3,072.0 |
|
2,994.6 |
|
3,035.5 |
|
3,064.6 |
|
-1.8 |
% |
|
Unit: kg/ha |
|||||||
|
|
|
|
|
|
|
Annual |
|
|
Country |
1991 |
1998 |
1999 |
2000 |
2001 |
Growth Rate |
|
|
|
|
|
|
|
|
1991 - 2001 |
|
|
DEVELOPING COUNTRIES |
|||||||
|
1. Bangladesh |
1,643 |
1,698 |
1,741 |
1,829 |
1,829 |
1.1 |
% |
|
2. Bhutan |
3,556 |
3,889 |
3,889 |
3,889 |
3,889 |
0.9 |
% |
|
3. Cambodia |
929 |
1,081 |
1,011 |
865 |
848 |
0.2 |
% |
|
4. China |
1,902 |
2,675 |
2,538 |
2,488 |
2,720 |
2.7 |
% |
|
5. Cook Islands |
- |
- |
- |
- |
- |
- |
|
|
6. DPR Korea |
- |
- |
- |
- |
- |
- |
|
|
7. Fiji |
- |
- |
- |
- |
- |
- |
|
|
8. India |
1,610 |
1,722 |
1,831 |
1,824 |
1,786 |
1.4 |
% |
|
9. Indonesia |
970 |
1,279 |
1,250 |
1,250 |
1,250 |
1.6 |
% |
|
10. Iran |
370 |
400 |
400 |
400 |
400 |
0.4 |
% |
|
11. Laos |
- |
- |
- |
- |
- |
- |
|
|
12. Malaysia |
- |
- |
- |
- |
- |
- |
|
|
13. Maldives |
- |
- |
- |
- |
- |
- |
|
|
14. Mongolia |
- |
- |
- |
- |
- |
- |
|
|
15. Myanmar |
954 |
972 |
897 |
912 |
953 |
0.7 |
% |
|
16. Nepal |
1,143 |
1,267 |
1,345 |
1,044 |
1,452 |
1.0 |
% |
|
17. Pakistan |
632 |
675 |
675 |
696 |
696 |
1.0 |
% |
|
18. Papua New Guinea |
- |
- |
- |
- |
- |
- |
|
|
19. Philippines |
- |
- |
- |
- |
- |
- |
|
|
20. Rep. of Korea |
- |
- |
- |
- |
- |
- |
|
|
21. Samoa |
- |
- |
- |
- |
- |
- |
|
|
22. Solomon Islands |
- |
- |
- |
- |
- |
- |
|
|
23. Sri Lanka |
- |
- |
- |
- |
- |
- |
|
|
24. Thailand |
1,375 |
1,611 |
1,728 |
1,748 |
1,748 |
2.4 |
% |
|
25. Tonga |
- |
- |
- |
- |
- |
- |
|
|
26. Vanuatu |
- |
- |
- |
- |
- |
- |
|
|
27. Viet Nam |
2,410 |
2,179 |
2,293 |
2,055 |
2,054 |
0.1 |
% |
|
AVERAGE |
1,458 |
1,621 |
1,633 |
1,583 |
1,635 |
1.2 |
% |
|
DEVELOPED COUNTRIES |
|||||||
|
28. Australia |
- |
- |
- |
- |
- |
- |
|
|
29. Japan |
0 |
0 |
0 |
0 |
0 |
|
% |
|
30. New Zealand |
- |
- |
- |
- |
- |
- |
|
|
AVERAGE |
0 |
0 |
0 |
0 |
0 |
|
% |
|
ASIA-PACIFIC TOTAL |
1,631 |
1,745 |
1,807 |
1,814 |
1,798 |
1.0 |
% |
|
REST OF WORLD |
1,233 |
1,545 |
1,559 |
1,548 |
1,542 |
-1.0 |
% |
|
WORLD |
1,616 |
1,736 |
1,796 |
1,802 |
1,787 |
0.9 |
% |
|
Unit: 1000 ha |
||||||||||||
|
|
|
|
|
|
|
|
|
|
|
|
Annual |
|
|
Country |
1991 |
|
1998 |
|
1999 |
|
2000 |
|
2001 |
|
Growth Rate |
|
|
|
|
|
|
|
|
|
|
|
|
|
1991 - 2001 |
|
|
DEVELOPING COUNTRIES |
||||||||||||
|
1. Bangladesh |
588.4 |
|
478.9 |
|
408.9 |
|
449.3 |
|
449.3 |
F |
-2.7 |
% |
|
2. Bhutan |
0.1 |
F |
0.1 |
F |
0.1 |
F |
0.1 |
F |
0.1 |
F |
0.0 |
% |
|
3. Cambodia |
1.4 |
|
1.0 |
|
0.3 |
|
0.2 |
|
0.3 |
|
-19.7 |
% |
|
4. China |
269.6 |
* |
92.7 |
* |
65.0 |
* |
50.6 |
* |
50.0 |
F |
-17.2 |
% |
|
5. Cook Islands |
- |
|
- |
|
- |
|
- |
|
- |
|
- |
|
|
6. DPR Korea |
- |
|
- |
|
- |
|
- |
|
- |
|
- |
|
|
7. Fiji |
- |
|
- |
|
- |
|
- |
|
- |
|
- |
|
|
8. India |
1,177.0 |
|
1,025.4 |
|
1,035.6 |
|
1,024.0 |
|
1,050.0 |
F |
0.1 |
% |
|
9. Indonesia |
10.6 |
|
5.7 |
|
6.0 |
F |
6.0 |
F |
6.0 |
F |
-5.6 |
% |
|
10. Iran |
0.0 |
|
0.0 |
F |
0.0 |
F |
0.0 |
F |
0.0 |
F |
-0.3 |
% |
|
11. Laos |
- |
|
- |
|
- |
|
- |
|
- |
|
- |
|
|
12. Malaysia |
- |
|
- |
|
- |
|
- |
|
- |
|
- |
|
|
13. Maldives |
- |
|
- |
|
- |
|
- |
|
- |
|
- |
|
|
14. Mongolia |
- |
|
- |
|
- |
|
- |
|
- |
|
- |
|
|
15. Myanmar |
25.5 |
|
34.1 |
|
37.3 |
|
36.6 |
|
44.0 |
|
3.3 |
% |
|
16. Nepal |
14.0 |
|
12.3 |
|
11.7 |
|
14.5 |
|
11.3 |
|
0.4 |
% |
|
17. Pakistan |
5.5 |
|
2.8 |
|
2.8 |
|
3.1 |
|
3.1 |
F |
-6.1 |
% |
|
18. Papua New Guinea |
- |
|
- |
|
- |
|
- |
|
- |
|
- |
|
|
19. Philippines |
- |
|
- |
|
- |
|
- |
|
- |
|
- |
|
|
20. Rep. of Korea |
- |
|
- |
|
- |
|
- |
|
- |
|
- |
|
|
21. Samoa |
- |
|
- |
|
- |
|
- |
|
- |
|
- |
|
|
22. Solomon Islands |
- |
|
- |
|
- |
|
- |
|
- |
|
- |
|
|
23. Sri Lanka |
- |
|
- |
|
- |
|
- |
|
- |
|
- |
|
|
24. Thailand |
103.9 |
|
30.7 |
|
19.9 |
|
19.2 |
|
19.2 |
F |
-18.0 |
% |
|
25. Tonga |
- |
|
- |
|
- |
|
- |
|
- |
|
- |
|
|
26. Vanuatu |
- |
|
- |
|
- |
|
- |
|
- |
|
- |
|
|
27. Viet Nam |
10.5 |
|
6.7 |
|
4.1 |
|
5.5 |
|
5.6 |
|
-8.2 |
% |
|
SUB-TOTAL |
2,206.6 |
|
1,690.4 |
|
1,591.7 |
|
1,609.3 |
|
1,638.9 |
|
-2.6 |
% |
|
DEVELOPED COUNTRIES |
||||||||||||
|
28. Australia |
- |
|
- |
|
- |
|
- |
|
- |
|
- |
|
|
29. Japan |
0.0 |
|
0.0 |
|
0.0 |
|
0.0 |
|
0.0 |
|
|
% |
|
30. New Zealand |
- |
|
- |
|
- |
|
- |
|
- |
|
- |
|
|
SUB-TOTAL |
0.0 |
|
0.0 |
|
0.0 |
|
0.0 |
|
0.0 |
|
|
% |
|
ASIA-PACIFIC TOTAL |
2,206.6 |
|
1,690.4 |
|
1,591.7 |
|
1,609.3 |
|
1,638.9 |
|
-2.6 |
% |
|
REST OF WORLD |
86.0 |
|
78.7 |
|
76.1 |
|
75.1 |
|
76.5 |
|
-1.8 |
% |
|
WORLD |
2,292.6 |
|
1,769.1 |
|
1,667.8 |
|
1,684.3 |
|
1,715.4 |
|
-2.6 |
% |
|
Unit: 1000 MT |
||||||||||||
|
|
|
|
|
|
|
|
|
|
|
|
Annual |
|
|
Country |
1991 |
|
1998 |
|
1999 |
|
2000 |
|
2001 |
|
Growth Rate |
|
|
|
|
|
|
|
|
|
|
|
|
|
1991 - 2001 |
|
|
DEVELOPING COUNTRIES |
||||||||||||
|
1. Bangladesh |
41.2 |
* |
60.0 |
* |
36.0 |
* |
45.0 |
* |
54.0 |
* |
-0.1 |
% |
|
2. Bhutan |
- |
|
- |
|
- |
|
- |
|
- |
|
- |
|
|
3. Cambodia |
0.3 |
* |
0.3 |
F |
0.3 |
F |
0.3 |
F |
0.3 |
F |
-1.4 |
% |
|
4. China |
17,025.0 |
|
13,503.0 |
|
11,487.0 |
|
13,251.0 |
|
15,960.0 |
|
-0.3 |
% |
|
5. Cook Islands |
- |
|
- |
|
- |
|
- |
|
- |
|
- |
|
|
6. DPR Korea |
28.5 |
F |
33.5 |
F |
33.5 |
F |
35.0 |
F |
35.0 |
F |
1.4 |
% |
|
7. Fiji |
- |
|
- |
|
- |
|
- |
|
- |
|
- |
|
|
8. India |
4,955.0 |
* |
6,280.5 |
|
5,910.2 |
|
6,732.7 |
* |
5,250.0 |
* |
0.9 |
% |
|
9. Indonesia |
23.8 |
* |
27.0 |
F |
27.0 |
F |
28.0 |
F |
29.0 |
F |
2.1 |
% |
|
10. Iran |
411.8 |
|
459.7 |
|
483.0 |
* |
500.0 |
* |
503.0 |
* |
4.2 |
% |
|
11. Laos |
14.2 |
* |
22.5 |
* |
12.8 |
* |
13.8 |
* |
13.8 |
F |
-1.3 |
% |
|
12. Malaysia |
- |
|
- |
|
- |
|
- |
|
- |
|
- |
|
|
13. Maldives |
- |
|
- |
|
- |
|
- |
|
- |
|
- |
|
|
14. Mongolia |
- |
|
- |
|
- |
|
- |
|
- |
|
- |
|
|
15. Myanmar |
62.3 |
|
163.6 |
|
158.0 |
|
175.6 |
|
152.7 |
|
14.0 |
% |
|
16. Nepal |
1.3 |
F |
0.7 |
|
0.7 |
F |
0.7 |
|
0.8 |
F |
-9.2 |
% |
|
17. Pakistan |
6,542.8 |
|
4,485.4 |
|
5,735.4 |
|
5,487.5 |
* |
5,487.5 |
F |
0.6 |
% |
|
18. Papua New Guinea |
- |
|
- |
|
- |
|
- |
|
- |
|
- |
|
|
19. Philippines |
21.3 |
* |
2.9 |
* |
2.0 |
* |
1.5 |
* |
1.5 |
F |
-21.6 |
% |
|
20. Rep. of Korea |
0.5 |
* |
0.0 |
F |
0.0 |
F |
0.0 |
F |
0.0 |
F |
|
% |
|
21. Samoa |
- |
|
- |
|
- |
|
- |
|
- |
|
- |
|
|
22. Solomon Islands |
- |
|
- |
|
- |
|
- |
|
- |
|
- |
|
|
23. Sri Lanka |
0.0 |
|
0.0 |
|
0.0 |
|
0.0 |
|
0.0 |
|
|
% |
|
24. Thailand |
128.7 |
|
40.4 |
|
34.6 |
|
39.8 |
|
39.0 |
F |
-11.4 |
% |
|
25. Tonga |
- |
|
- |
|
- |
|
- |
|
- |
|
- |
|
|
26. Vanuatu |
- |
|
- |
|
- |
|
- |
|
- |
|
- |
|
|
27. Viet Nam |
8.3 |
|
22.0 |
|
22.2 |
|
18.8 |
|
21.0 |
|
11.7 |
% |
|
SUB-TOTAL |
29,265.1 |
|
25,101.4 |
|
23,942.7 |
|
26,329.7 |
|
27,547.6 |
|
0.3 |
% |
|
DEVELOPED COUNTRIES |
||||||||||||
|
28. Australia |
1,128.8 |
|
1,576.0 |
|
1,617.0 |
|
1,949.0 |
|
1,765.0 |
F |
6.9 |
% |
|
29. Japan |
- |
|
- |
|
- |
|
- |
|
- |
|
- |
|
|
30. New Zealand |
- |
|
- |
|
- |
|
- |
|
- |
|
- |
|
|
SUB-TOTAL |
1,128.8 |
|
1,576.0 |
|
1,617.0 |
|
1,949.0 |
|
1,765.0 |
F |
6.9 |
% |
|
ASIA-PACIFIC TOTAL |
30,393.9 |
|
26,677.4 |
|
25,559.7 |
|
28,278.8 |
|
29,312.6 |
|
0.6 |
% |
|
REST OF WORLD |
29,817.9 |
|
25,232.9 |
|
27,538.5 |
|
26,311.6 |
|
30,413.5 |
|
0.1 |
% |
|
WORLD |
60,211.8 |
|
51,910.3 |
|
53,098.2 |
|
54,590.4 |
|
59,726.1 |
|
0.3 |
% |
|
Unit: kg/ha |
|||||||
|
|
|
|
|
|
|
Annual |
|
|
Country |
1991 |
1998 |
1999 |
2000 |
2001 |
Growth Rate |
|
|
|
|
|
|
|
|
1991 - 2001 |
|
|
DEVELOPING COUNTRIES |
|||||||
|
1. Bangladesh |
2,244 |
1,463 |
1,200 |
1,286 |
1,500 |
-5.3 |
% |
|
2. Bhutan |
- |
- |
- |
- |
- |
- |
|
|
3. Cambodia |
1,500 |
1,378 |
1,368 |
1,400 |
1,400 |
-1.0 |
% |
|
4. China |
2,604 |
3,028 |
3,083 |
3,279 |
3,325 |
4.5 |
% |
|
5. Cook Islands |
- |
- |
- |
- |
- |
- |
|
|
6. DPR Korea |
1,781 |
1,763 |
1,763 |
1,750 |
1,750 |
-0.4 |
% |
|
7. Fiji |
- |
- |
- |
- |
- |
- |
|
|
8. India |
647 |
672 |
675 |
801 |
597 |
-0.9 |
% |
|
9. Indonesia |
1,167 |
1,286 |
1,286 |
1,273 |
1,318 |
1.3 |
% |
|
10. Iran |
2,007 |
2,004 |
2,247 |
2,083 |
2,340 |
1.3 |
% |
|
11. Laos |
1,775 |
3,110 |
2,891 |
2,936 |
2,936 |
4.9 |
% |
|
12. Malaysia |
- |
- |
- |
- |
- |
- |
|
|
13. Maldives |
- |
- |
- |
- |
- |
- |
|
|
14. Mongolia |
- |
- |
- |
- |
- |
- |
|
|
15. Myanmar |
432 |
639 |
608 |
650 |
636 |
5.7 |
% |
|
16. Nepal |
722 |
341 |
360 |
605 |
577 |
-4.9 |
% |
|
17. Pakistan |
2,307 |
1,535 |
1,923 |
1,875 |
1,875 |
0.0 |
% |
|
18. Papua New Guinea |
- |
- |
- |
- |
- |
- |
|
|
19. Philippines |
1,253 |
797 |
899 |
882 |
882 |
-3.1 |
% |
|
20. Rep. of Korea |
960 |
0 |
0 |
0 |
0 |
|
% |
|
21. Samoa |
- |
- |
- |
- |
- |
- |
|
|
22. Solomon Islands |
- |
- |
- |
- |
- |
- |
|
|
23. Sri Lanka |
0 |
0 |
0 |
0 |
0 |
|
% |
|
24. Thailand |
1,315 |
1,405 |
1,363 |
1,575 |
2,294 |
3.0 |
% |
|
25. Tonga |
- |
- |
- |
- |
- |
- |
|
|
26. Vanuatu |
- |
- |
- |
- |
- |
- |
|
|
27. Viet Nam |
516 |
924 |
1,047 |
1,011 |
1,050 |
7.8 |
% |
|
AVERAGE |
1,327 |
1,272 |
1,295 |
1,338 |
1,405 |
0.7 |
% |
|
DEVELOPED COUNTRIES |
|||||||
|
28. Australia |
4,046 |
4,136 |
3,626 |
4,485 |
4,061 |
1.4 |
% |
|
29. Japan |
- |
- |
- |
- |
- |
- |
|
|
30. New Zealand |
- |
- |
- |
- |
- |
- |
|
|
AVERAGE |
4,046 |
4,136 |
3,626 |
4,485 |
4,061 |
1.4 |
% |
|
ASIA-PACIFIC TOTAL |
1,702 |
1,504 |
1,548 |
1,719 |
1,671 |
0.8 |
% |
|
REST OF WORLD |
1,743 |
1,602 |
1,711 |
1,736 |
1,850 |
0.2 |
% |
|
WORLD |
1,722 |
1,550 |
1,628 |
1,727 |
1,758 |
0.5 |
% |
|
Unit: 1000 ha |
||||||||||||
|
|
|
|
|
|
|
|
|
|
|
|
Annual |
|
|
Country |
1991 |
|
1998 |
|
1999 |
|
2000 |
|
2001 |
|
Growth Rate |
|
|
|
|
|
|
|
|
|
|
|
|
|
1991 - 2001 |
|
|
DEVELOPING COUNTRIES |
||||||||||||
|
1. Bangladesh |
18.4 |
|
41.0 |
* |
30.0 |
* |
35.0 |
* |
36.0 |
* |
5.5 |
% |
|
2. Bhutan |
- |
|
- |
|
- |
|
- |
|
- |
|
- |
|
|
3. Cambodia |
0.2 |
|
0.2 |
F |
0.2 |
F |
0.2 |
F |
0.2 |
F |
-0.4 |
% |
|
4. China |
6,538.5 |
|
4,459.2 |
|
3,725.6 |
|
4,041.0 |
|
4,800.0 |
|
-4.6 |
% |
|
5. Cook Islands |
- |
|
- |
|
- |
|
- |
|
- |
|
- |
|
|
6. DPR Korea |
16.0 |
F |
19.0 |
F |
19.0 |
F |
20.0 |
F |
20.0 |
F |
1.8 |
% |
|
7. Fiji |
- |
|
- |
|
- |
|
- |
|
- |
|
- |
|
|
8. India |
7,661.4 |
|
9,342.4 |
|
8,758.7 |
|
8,409.0 |
|
8,800.0 |
* |
1.8 |
% |
|
9. Indonesia |
20.4 |
|
21.0 |
* |
21.0 |
* |
22.0 |
* |
22.0 |
* |
0.8 |
% |
|
10. Iran |
205.2 |
|
229.4 |
|
215.0 |
* |
240.0 |
* |
215.0 |
* |
2.9 |
% |
|
11. Laos |
8.0 |
|
7.2 |
|
4.4 |
|
4.7 |
|
4.7 |
F |
-5.9 |
% |
|
12. Malaysia |
- |
|
- |
|
- |
|
- |
|
- |
|
- |
|
|
13. Maldives |
- |
|
- |
|
- |
|
- |
|
- |
|
- |
|
|
14. Mongolia |
- |
|
- |
|
- |
|
- |
|
- |
|
- |
|
|
15. Myanmar |
144.4 |
|
256.0 |
|
260.0 |
F |
270.0 |
F |
240.0 |
F |
7.8 |
% |
|
16. Nepal |
1.8 |
F |
2.1 |
|
2.0 |
F |
1.2 |
|
1.3 |
F |
-4.5 |
% |
|
17. Pakistan |
2,835.5 |
|
2,922.8 |
|
2,983.1 |
|
2,927.0 |
|
2,927.0 |
F |
0.6 |
% |
|
18. Papua New Guinea |
- |
|
- |
|
- |
|
- |
|
- |
|
- |
|
|
19. Philippines |
17.0 |
* |
3.7 |
* |
2.2 |
* |
1.7 |
* |
1.7 |
F |
-19.1 |
% |
|
20. Rep. of Korea |
0.5 |
* |
0.0 |
F |
0.0 |
F |
0.0 |
F |
0.0 |
F |
|
% |
|
21. Samoa |
- |
|
- |
|
- |
|
- |
|
- |
|
- |
|
|
22. Solomon Islands |
- |
|
- |
|
- |
|
- |
|
- |
|
- |
|
|
23. Sri Lanka |
- |
|
- |
|
- |
|
- |
|
- |
|
- |
|
|
24. Thailand |
97.9 |
|
28.8 |
|
25.4 |
|
25.3 |
|
17.0 |
* |
-14.0 |
% |
|
25. Tonga |
- |
|
- |
|
- |
|
- |
|
- |
|
- |
|
|
26. Vanuatu |
- |
|
- |
|
- |
|
- |
|
- |
|
- |
|
|
27. Viet Nam |
16.1 |
|
23.8 |
|
21.2 |
|
18.6 |
|
20.0 |
|
3.5 |
% |
|
SUB-TOTAL |
17,581.2 |
|
17,356.5 |
|
16,067.8 |
|
16,015.7 |
|
17,104.9 |
|
-0.4 |
% |
|
DEVELOPED COUNTRIES |
||||||||||||
|
28. Australia |
279.0 |
|
381.0 |
|
446.0 |
|
434.6 |
|
434.6 |
* |
5.4 |
% |
|
29. Japan |
- |
|
- |
|
- |
|
- |
|
- |
|
- |
|
|
30. New Zealand |
- |
|
- |
|
- |
|
- |
|
- |
|
- |
|
|
SUB-TOTAL |
279.0 |
|
381.0 |
|
446.0 |
|
434.6 |
|
434.6 |
|
5.4 |
% |
|
ASIA-PACIFIC TOTAL |
17,860.2 |
|
17,737.5 |
|
16,513.8 |
|
16,450.3 |
|
17,539.5 |
|
-0.3 |
% |
|
REST OF WORLD |
17,104.2 |
|
15,748.3 |
|
16,097.2 |
|
15,157.1 |
|
16,439.4 |
|
-0.1 |
% |
|
WORLD |
34,964.5 |
|
33,485.7 |
|
32,611.0 |
|
31,607.4 |
|
33,978.9 |
|
-0.2 |
% |
|
Unit: 1000 MT |
||||||||||||
|
|
|
|
|
|
|
|
|
|
|
|
Annual |
|
|
Country |
1991 |
|
1998 |
|
1999 |
|
2000 |
|
2001 |
|
Growth Rate |
|
|
|
|
|
|
|
|
|
|
|
|
|
1991 - 2001 |
|
|
DEVELOPING COUNTRIES |
||||||||||||
|
1. Bangladesh |
- |
|
- |
|
- |
|
- |
|
- |
|
- |
|
|
2. Bhutan |
- |
|
- |
|
- |
|
- |
|
- |
|
- |
|
|
3. Cambodia |
0.0 |
F |
0.0 |
F |
0.0 |
F |
0.0 |
F |
0.0 |
F |
6.5 |
% |
|
4. China |
59.0 |
|
67.7 |
|
70.2 |
|
57.0 |
* |
62.0 |
F |
-1.6 |
% |
|
5. Cook Islands |
- |
|
- |
|
- |
|
- |
|
- |
|
- |
|
|
6. DPR Korea |
1.3 |
F |
0.2 |
* |
0.2 |
* |
0.2 |
F |
0.2 |
F |
-24.6 |
% |
|
7. Fiji |
- |
|
- |
|
- |
|
- |
|
- |
|
- |
|
|
8. India |
12.6 |
|
15.2 |
|
15.5 |
|
15.2 |
|
15.2 |
F |
2.2 |
% |
|
9. Indonesia |
0.1 |
|
0.1 |
F |
0.1 |
F |
0.1 |
F |
0.1 |
F |
0.0 |
% |
|
10. Iran |
0.3 |
* |
0.8 |
F |
0.8 |
F |
0.8 |
|
0.9 |
F |
11.2 |
% |
|
11. Laos |
- |
|
- |
|
- |
|
- |
|
- |
|
- |
|
|
12. Malaysia |
- |
|
- |
|
- |
|
- |
|
- |
|
- |
|
|
13. Maldives |
- |
|
- |
|
- |
|
- |
|
- |
|
- |
|
|
14. Mongolia |
- |
|
- |
|
- |
|
- |
|
- |
|
- |
|
|
15. Myanmar |
- |
|
- |
|
- |
|
- |
|
- |
|
- |
|
|
16. Nepal |
- |
|
- |
|
- |
|
- |
|
- |
|
- |
|
|
17. Pakistan |
- |
|
- |
|
- |
|
- |
|
- |
|
- |
|
|
18. Papua New Guinea |
- |
|
- |
|
- |
|
- |
|
- |
|
- |
|
|
19. Philippines |
- |
|
- |
|
- |
|
- |
|
- |
|
- |
|
|
20. Rep. of Korea |
0.8 |
|
0.0 |
|
0.0 |
|
0.0 |
|
0.1 |
F |
-39.0 |
% |
|
21. Samoa |
- |
|
- |
|
- |
|
- |
|
- |
|
- |
|
|
22. Solomon Islands |
- |
|
- |
|
- |
|
- |
|
- |
|
- |
|
|
23. Sri Lanka |
- |
|
- |
|
- |
|
- |
|
- |
|
- |
|
|
24. Thailand |
1.3 |
F |
0.9 |
* |
1.0 |
* |
1.0 |
F |
1.0 |
F |
-3.7 |
% |
|
25. Tonga |
- |
|
- |
|
- |
|
- |
|
- |
|
- |
|
|
26. Vanuatu |
- |
|
- |
|
- |
|
- |
|
- |
|
- |
|
|
27. Viet Nam |
0.5 |
F |
0.9 |
* |
0.8 |
* |
0.9 |
F |
0.9 |
F |
5.9 |
% |
|
SUB-TOTAL |
75.9 |
|
85.8 |
|
88.6 |
|
75.3 |
|
80.3 |
|
-1.1 |
% |
|
DEVELOPED COUNTRIES |
||||||||||||
|
28. Australia |
- |
|
- |
|
- |
|
- |
|
- |
|
- |
|
|
29. Japan |
5.5 |
|
1.1 |
|
0.6 |
|
0.6 |
|
0.6 |
F |
-22.2 |
% |
|
30. New Zealand |
- |
|
- |
|
- |
|
- |
|
- |
|
- |
|
|
SUB-TOTAL |
5.5 |
|
1.1 |
|
0.6 |
|
0.6 |
|
0.6 |
|
-22.2 |
% |
|
ASIA-PACIFIC TOTAL |
81.4 |
|
86.9 |
|
89.3 |
|
75.9 |
|
81.0 |
|
-1.7 |
% |
|
REST OF WORLD |
6.7 |
|
9.5 |
|
8.9 |
|
8.4 |
|
8.6 |
|
0.6 |
% |
|
WORLD |
88.2 |
|
96.4 |
|
98.2 |
|
84.3 |
|
89.6 |
|
-1.5 |
% |
![]()
![]()
![]()