Table 1. Indonesian production of sea cucumber and export volume during 1980–1985 period.
| Year | Landing mt | Export volume mt |
| 1980 | 232 | 281 |
| 1981 | 287 | 545 |
| 1982 | 275 | 623 |
| 1983 | 232 | 1 274 |
| 1984 | 456 | 1 318 |
| 1985 | 351 | 3 123 |
Source : Directorate General of Fisheries, 1987a.
Table 2. Target of sea cucumber production and export volume planned under the REPELITA V.
| Year | Production mt | Export volume mt |
| 1989 | 14 335 | 4 300 |
| 1990 | 16 000 | 4 800 |
| 1991 | 17 655 | 5 300 |
| 1992 | 19 335 | 5 800 |
| 1993 | 21 000 | 6 300 |
Source : Directorate General of Fisheries, 1987b.
Table 3. Potential area suitable for sea cucumber culture development
| Province | Area (ha) |
| Lampung | 200 |
| East java | 200 |
| West Nusatenggara | 200 |
| North Sulawesi | 500 |
| Central Sulawesi | 300 |
| Southeast Sulawesi | 500 |
| Maluku | 500 |
| Irian jaya | 100 |
| Total | 2 500 |
Table 4. Area planned for sea cucumber culture development during 1989–1993 period.
| Province | 1989 | 1990 | 1991 | 1992 | 1993 |
| Lampung | 5 | 5 | 10 | 10 | 15 |
| East java | 0 | 0 | 5 | 10 | 10 |
| West Nusatenggara | 0 | 5 | 5 | 10 | 10 |
| North Sulawesi | 10 | 15 | 20 | 25 | 30 |
| Central Sulawesi | 5 | 5 | 10 | 15 | 15 |
| Southeast Sulawesi | 10 | 10 | 15 | 15 | 20 |
| Maluku | 10 | 15 | 20 | 20 | 20 |
| Irian jaya | 0 | 0 | 5 | 5 | 10 |
| Total | 40 | 55 | 90 | 110 | 130 |
Table 5. Hong Kong imports of beche-de-mer during 1981–1985.
| mt | |||||
| Country | 1981 | 1982 | 1983 | 1984 | 1985 |
| Indonesia | 192 | 394 | 837 | 1 060 | 2 439 |
| Philippines | 391 | 287 | 918 | 1 370 | 2 954 |
| Japan | 26 | 30 | 48 | 18 | 21 |
| Korea, DPR | 33 | 39 | 37 | 31 | 26 |
| Singapore | 58 | 56 | 52 | 78 | 308 |
| India | 0 | 16 | 280 | 0 | 0 |
| Africa | 159 | 190 | 145 | 151 | 227 |
| Oceania | 402 | 53 | 59 | 140 | 99 |
| Total | 1 055 | 1 124 | 2 125 | 2 905 | 6 209 |
Source : Van Eys, 1986
Africa1 : South Africa, Mozambique, Kenya, Tanzania, Zanzibar
Oceania2 : U.S Oceania, Oceania Nes, Australia, Tonga, Fiji, Fiji,
Papua New Guinea
Table 6. Hong Kong re-export of beche-de-mer during 1981–1985, by countries of destination.
| kg | |||||
| Country | 1981 | 1982 | 1983 | 1984 | 1985 |
| USA | 36 907 | 40 685 | 53 729 | 59 734 | 38 242 |
| Canada | 3 652 | 4 882 | 8 302 | 5 051 | 9 802 |
| Europe | 1 329 | 2 388 | 1 282 | 2 542 | 2 412 |
| Taiwan | 194 864 | 293 348 | 266 881 | 180 747 | 279 782 |
| Rep of Korea | 166 902 | 165 301 | 146 911 | 387 385 | 24 130 |
| China | 59 438 | 200 262 | 1 002 855 | 1 641 813 | 4 431 306 |
| Singapore | 178 367 | 122 892 | 138 225 | 103 732 | 92 086 |
| Australia | 3 078 | 3 211 | 3 278 | 3 643 | 4 355 |
| Total | 690 785 | 872 481 | 1 637 917 | 2 404 557 | 5 007 752 |
Source : Van Eys, 1986
Table 7. Singapore imports of beche-de-mer during 1980–1984.
| Mt | |||||
| Country | 1980 | 1981 | 1982 | 1983 | 1984 |
| Philippines | 69 | 95 | 74 | 98 | 145 |
| Hong Kong | 15 | 5 | 57 | 50 | 27 |
| India | 63 | 87 | 96 | 95 | 59 |
| Kenya | 0 | 15 | 22 | 50 | 65 |
| Mozambique | 0 | 8 | 48 | 22 | 21 |
| New Caledonia | 0 | 0 | 0 | 0 | 67 |
| Sabah | 164 | 88 | 83 | 77 | 64 |
| Sri Lanka | 97 | 81 | 67 | 52 | 36 |
| Tanzania | 33 | 36 | 20 | 43 | 66 |
| Other countries1 | 26 | 31 | 39 | 46 | 40 |
| Total | 467 | 446 | 506 | 533 | 590 |
Source : Van Eys, 1986
Other countries 1 PR China, Japan, West Malaysia, P.N Guinea
Table 8. Singapore re-export of beche-de-mer during 1980–1984.
| mt | |||||
| Country | 1980 | 1981 | 1982 | 1983 | 1984 |
| Hong Kong | 22 | 42 | 49 | 51 | 78 |
| Rep of Korea | 62 | 0 | 0 | 14 | 5 |
| Malaysia | 337 | 431 | 311 | 515 | 583 |
| Sabah | 18 | 18 | 17 | 18 | 15 |
| Taiwan | 45 | 130 | 96 | 110 | 66 |
| Thailand | 0 | 0 | 0 | 44 | 22 |
| Other countries | 5 | 7 | 12 | 6 | 10 |
| Total | 489 | 630 | 485 | 758 | 799 |
Table 9. Hong Kong imported price of beche-de-mer during 1981–1985.
| HK$/kg 1 | |||||
| Country | 1981 | 1982 | 1983 | 1984 | 1985 |
| Indonesia | 14.37 | 13.36 | 14.01 | 12.22 | 9.74 |
| Philippines | 14.66 | 13.36 | 14.01 | 12.22 | 10.33 |
| Japan | 124.50 | 165.44 | 242.40 | 269.91 | 299.10 |
| Korea, DPR | 76.78 | 80.38 | 87.65 | 112.73 | 147.84 |
| Sri Lanka | 50.87 | 63.31 | 45.86 | 0 | 105.33 |
| Singapore | 31.27 | 31.06 | 35.83 | 60.50 | 35.45 |
| India | 0 | 2.58 | 87.50 | 0 | 0 |
| Africa 2 | 24.75 | 28.83 | 31.49 | 32.25 | 29.34 |
| Oceania 3 | 44.76 | 30.16 | 31.29 | 50.18 | 32.58 |
Source : Van Eys, 1986
1 HK$ = Rp 216
2 Africa : South Africa, Mozambique, Kenya, Tanzania, Zanzibar
3 Oceania : U.S Oceania, Oceania Nes, Australia, Tonga, Fiji, Fiji,Papua New Guinea
Table 10. Percentage loss of weight and moisture of sea cucumber during drying.
| Hours of drying | % of initial weight | % moisture content |
| 00.00 | 100 | 68 |
| 5.00 | 86 | 64 |
| 18.30 | 69 | 58 |
| 28.30 | 55 | 52 |
| 42.30 | 51 | 50 |
| 52.30 | 46 | 39 |
| 66.00 | 45 | - |
| 76.30 | 42 | 27 |
| 90.00 | 42 | 19 |
| 100.00 | 41 | 18 |
| 114.00 | 40 | 17 |
Source : Din, 1986.

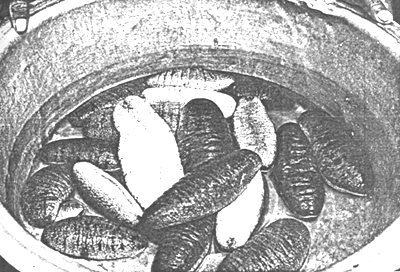
Fig. 1 Sand sea cucumber, Holothuria scabra

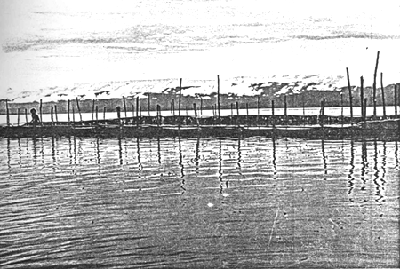
Fig. 2 Enclosure used in sea cucumber culture in Sopura bay, Kendari, Southeast Sulawesi.
