


This chapter deals with the current pattern of use of forest resources, one of most important economic, social, and cultural resources of Nepal. This is information is important to understand the sustainability of forest resources and the communities that depend on them.
Uncontrolled access to and use of forest resources at many places is leading to forest degradation in Nepal. The forest fuelwood meets about eighty one percent of the total fuel consumption (WECS, 1997) and forest fodder satisfies about thirty seven percent of total fodder needs of livestock in Nepal.
The recent National Forest Inventory (1989-1999) indicates that current use is fragmenting and decreasing the forests of Nepal at an annual rate of slightly less than two percent. Further, the rate of deforestation is much greater in the Terai area than in the hill area. When “forest” and “shrub” areas are considered as a group, then the rate of deforestation comes to about one half percent per annum, indicating that much of the change is conversion of forest to shrub.
The main use of Nepal’s forests is to provide biomass to satisfy the needs of domestic fuel and fodder. The use of forests to meet other needs from forests is comparatively negligible. Forests provide about 81 percent (Fig. 19) of the total fuel and about 37 percent (Fig. 23) of total fodder requirements of Nepal. When biofuels are converted into common energy units (giga-joules) the average annual production of fuelwood constitutes only about 31 percent (Appendix, Table 44). Agricultural residues contribute about 51 percent and cattle dung account for the rest (18 percent) (WECS, 1996). Following its national policy, Nepal gives emphasis to alternative and other renewable energy sources that aim at reducing dependence on forest products and animal dung.
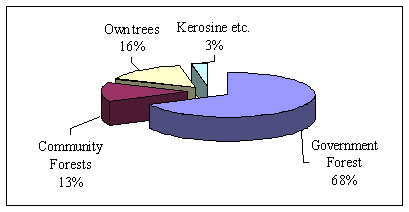
Fig. 19. Percent of households using different sources of fuel energy
Fuelwood is the main source of energy for almost 99 percent of the population in the mountains and 88 percent in the hills (SGFFU, 1998). Apart from seasonal variation, the need varies by physiographic zone, development region and economic class. Physiographically, the per-capita requirement of fuelwood is more in the Mountain Region (640 kg per person per annum) than in the Terai Region (479 kg.). Among development regions, the per-capita requirement is greatest (Fig. 20) in the Eastern region and least in the Central region (Appendix, Table 40).
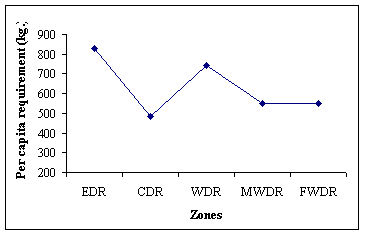
Fig. 20. Per-capita requirement of fuelwood
The higher per-capita consumption of households in the eastern region is met by a larger contribution (Fig.21) by privately owned forests(Appendix, Table 41).
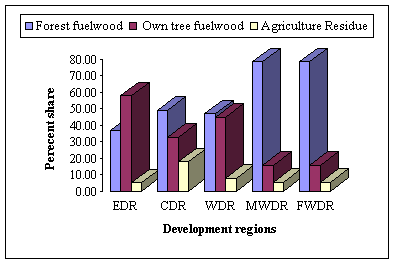
Fig. 21. Share of alternative sources of energy
Poorer households rely more on government managed forests than richer households, who depend more on their on-farm trees. Unlike in the Terai, almost all households in the hills collect fuelwood to meet their household needs. Households with less than 2 ha of land supplement their income through the collection and sale of fuelwood primarily from government forests (GTZ, 1996). In the Terai, households nearer to the forests use twice as much fuelwood for cooking as those farther away. About sixteen percent of Nepalese labour is consumed in fuelwood and fodder collection.
The opportunity costs of labour and fuelwood price influence fuelwood collection (SGFFU, 1998). For a 100 percent increase in the market price the hill households reduce their purchases of fuelwood by 59 percent but the amount of fuelwood collected is increased by only one percent. Similarly, for a 100 percent increase in collection time, fuelwood collection falls only by about 16 percent.
MPFS (1988) is the latest study that projects national requirements and production of fuelwood (Fig. 22). It first estimates per-capita requirements and then makes national projections on the basis of population trends (Appendix, Table 42). It estimates the future production (Appendix, Table 43) by assuming increasing accessibility and utilization of currently unmanaged forests and dramatic increases in establishment of and production from forest plantations.
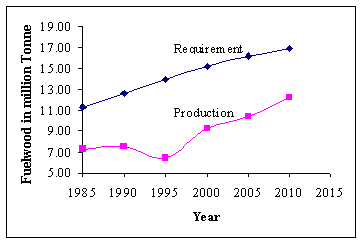
Fig. 22. Requirement and production of fuelwood
Wood charcoal is mainly used in rural areas for making agricultural and household implements and in urban area for brick kilns and energy needs of restaurants and hotels. Most of the charcoal comes from the national forests. The current charcoal conversion technology is quite inefficient. Electricity, kerosene, liquefied petroleum gas (LPG), and petroleum are four other important sources of energy In Nepal. Electricity meets energy for lighting purposes in urban and sub-urban Nepal while kerosene supplies the lighting needs in rural areas. LPG is used for cooking by middle and high-income groups in the developed urban areas while kerosene is used by the lower and middle-income households in both urban and rural areas. Vehicles and industries in the country consume most of the petroleum.
In the Trans-Himalayan, High Himalayan and High Mountain ranges livestock are taken to higher altitudes in summer and lower altitudes in winter. Animals in the Mid-Mountain region are stall fed as well as taken out to graze. The major feed supply in the Shiwaliks comes from forest grazing, croplands and wastelands. In the Terai, crop residues, grazing on fallow land, waste land and roadside vegetation provide animal feed .
Forests and farm lands (Fig. 23) contribute most of the animal feed in Nepal and the rest is supplied by non-cultivated inclusions, shrub land and grazing lands. Pasture lands occupy about twelve percent of the total area of the county. Fodder collection is more dominant in the hills than in the Shiwaliks. In the Terai, only one percent of the households collect fodder from government managed forest areas, while in the hills the households rely to an equal degree on vegetation on government and private lands (GTZ 1996). The practice of buying fodder does not exist either in the Terai or in the hills.
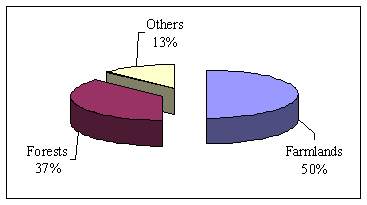
Fig. 23. Sources of fodder
Forests provide more than 200 indigenous grass and other species for grazing (Fig. 24 and Appendix, Table 45). Use of trees for fodder is area- and species-specific, such as use of the butter fruit tree in the warm hills, Dillenia pentagyno in tropical areas, Ficus neriifolia in the lower Himalayas and Castanopsis hystrix in the eastern hills. The leaves of Zizyphus incura are used for fodder in the Kathmandu valley. Other temperate fodder trees include Bridelia verrucosa, Cleyera japonica, Grewia oppositaefolia, Neolitsia languinosa, Stereospermum personatum Trewia nudiflora and Quercus floribunda. Due to excessive use, many forage species have become scarce or endangered during the last decade (Appendix, Table 46).
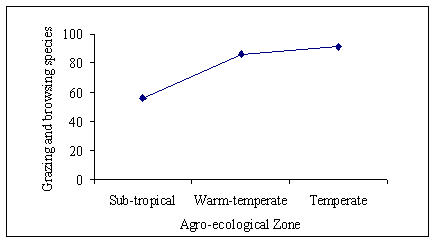
Fig. 24. Number of grazing and browsing species in agro-ecological zones
All tree landscapes (forests, cultivated lands and uncultivated lands) contribute to the supply of fodder. The MPFS estimates of fodder requirements (Appendix, Table 47) and production (Appendix, Table 48) indicate that at the national level there will be no shortage (Fig. 25) of feed if the fodder production capacity of accessible forests are fully utilized. However, at zonal level, the Terai and Middle Mountains zones will continue to have deficits in fodder to meet their needs.
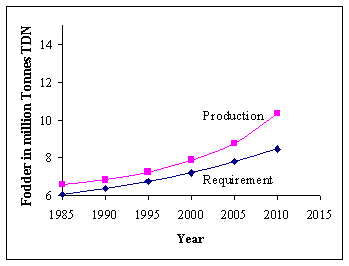
Fig. 25, Requirement and production of fodder in million metric tones
The amount of timber consumption is significant but is negligible (Fig. 26) in comparison to that of fuelwood (MPFS, 1988). However, the reverse is the case with the contribution of revenue to the state, with timber contributing the bulk of the revenue. About 60 percent of the annual requirement for timber is for housing and the rest is for infra-structural development.
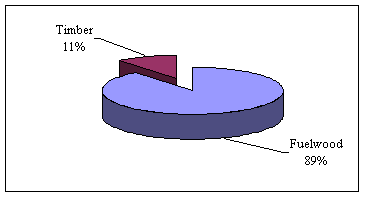
Fig. 26. Share of timber and fuelwood in total wood consumption
The annual timber harvest from government forests is about 400,000 m3 and it supports about 700,000 person-days of employment (valued at Rs. 10 million) in harvesting, transportation, supervision and control. During last two decades alone the number of forest-based industries in the country has increased by more than 3 times despite of shortage of raw material in the market (Fig. 27 and Appendix, Table 49). Forest-based industries provide income and employment to local people and are generating value added products (Appendix, Table 50).
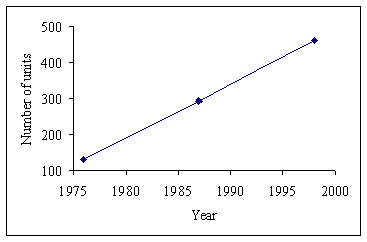
Fig. 27. Number of wood-based industries
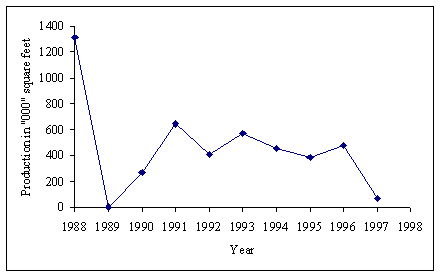
Fig. 28. Yearly variations in plywood production
However, large variations in the yearly supply of raw material to forest industries causes significant variation in production (Fig. 28 and Appendix, Table 51). This risk limits new investment in forest-based industries.
MPFS (1998) projects national requirements of timber (Appendix, Table 52) on the basis of per-capita estimates (Appendix, Table 53). It forecasts the production of timber from natural forests, plantations and private tree farms (Appendix, Table 54).
MPFS (1998) assumes an exponential increase in the contribution of timber by private forests over time to meet national timber requirements. Even then, the gap between estimated requirements and production remains unfulfilled and may continue to increase with further increases in population, income and developmental(Fig. 29).
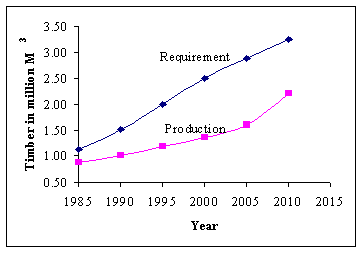
Fig. 29. Requirement and production of timber
Around 100 species are harvested from forest land for non-timber forest products. The annual value of trade in these products at the Indian border is estimated at $US 8.6 million (Edwards, 1996). Pine resin for the production of rosin and turpentine, khair heartwood for katha and kutch, sabai grass for paper production and sal seed for the production of oil are four major products that are processed within the country. These processing industries not only provide employment to local people but also make substantial contribution to government revenue.
In addition about 800 other products such as bamboo, lokta and allo are used in subsistence and cottage industries. These products are an integral part of rural life. Allo fibres are used to make essential items such as bags, sacks and fishing nets. For most of these products, households produce them to augment their income. Lokta paper-making is an important cottage industry in the hills, with annual production of about 300 tonnes.
In the Mid Hills and High Mountain areas non-timber forest products are more valuable as cash income to the rural economy than timber. Species such as dalchini, rittha and timur that occur below 2,000 m elevation have a low unit value but are relatively easy to collect and transport in high volumes. High altitude species, such as kutki, chiraita and jatamansi, are less common but have a high unit value.
Nepal has abundant sources of water in the form of rivers fed by the monsoon, glaciers, and snowfields. It is ranked second in the world in terms of water resources. The steep geography and high runoff provide great potential for generating hydroelectric power. The water storage capacity of the rivers is about 202,000 million m3. Three rivers (Koshi, Gandaki and Karnali) rivers posses about 74 percent of this total water storage capacity. The annual runoff contributed by the main rivers within the national territory amounts to about 170 billion m3 (Appendix, Table 2). The technically feasible hydropower potential (45,610 MW) of Nepal is also quite high and is more than 50 percent of its total theoretical potential (83, 290 MW). However, the present installed capacity is only about 253 MW (Amataya,1997).
The people of Nepal have a high dependency on local forest resources. The current use of forests is being defined more by economic conditions than by cultural needs. Forests continue as integral part of the Nepalese farming system. Some uses of forest resources are more significant and better documented (fuelwood) than others (non-wood products). At many locations, increasing pressure on the forest has caused degradation. At the same time there are unutilized forest and water resources that have the potential to improve the economic condition of the people.