![]()
![]()
![]()
In order to determine the species composition of the reservoirs a total of 15 reservoirs in Eastern Province were sampled with the Drottningholm sampling method2. The species composition of these reservoirs is given in Table 5. Barbus paludinosus and Labeo cylindricus are the most widespread species, and were found in 93% of the reservoirs sampled. In most reservoirs six or more species were identified. It must be stressed that the species mentioned in the table are only the species caught with the sampling method. Sampling with gillnets is selective and not all fish species in the reservoirs may have been detected with this method.
Table 5: Presence of different fish species per dam as found by the Drottningholm method
| Species: Dam | B. pal | B. eut | B. mar | O and | O. mac | T. ren | L. cyl | L. alt | H. phi | S. rob | C. gar | total |
| Chadewa | * | * | * | * | * | 5 | ||||||
| Chamuche | * | * | * | * | * | * | * | 7 | ||||
| Chivungula | * | * | * | * | * | 5 | ||||||
| Jim | * | * | * | * | * | * | * | 7 | ||||
| Kangombe | * | * | * | * | 4 | |||||||
| Lusowe | * | * | * | * | * | * | 6 | |||||
| Makungwa | * | * | * | * | * | * | * | * | 8 | |||
| Mweze | * | * | * | * | 3 | |||||||
| Nsazu | * | * | * | * | 4 | |||||||
| Senegalia | * | * | * | * | * | * | 7 | |||||
| Oliver Davis | * | * | * | * | * | * | 5 | |||||
| Rukuzye | * | * | * | * | * | * | 6 | |||||
| Chanchenga | * | * | * | * | * | * | * | 7 | ||||
| Lutembwe 1 | * | * | * | * | * | * | * | * | * | 9 | ||
| Lutembwe 2 | * | * | * | * | * | 7 | ||||||
| Presence % | 93 | 73 | 27 | 73 | 87 | 53 | 93 | 7 | 33 | 7 | 60 |
B. pal: Barbus paludinosus,
B. eut: Barbus Eutaenia,
B. mar: Barbus marequensis,
O. and: Oreochromis andersonii,
O. mac: Oreochromis macrochir,
T. ren: Tilapia rendalli,
L. cyl; Labeo cylindricus,
L.alt: Labeo altivelus,
H.phi: Haptochromis philander,
S. rob: Serranochromis robustus,
C. gar: Clarias gariepinus.
The catch composition of the Drottningholm sampling method gives a rough indication of the fish species composition in the reservoirs. Figure 2 gives the species distribution as average for all sampled reservoirs.
Figure 2. Average species composition of the sampled reservoirs (in percentage of total weight)
The Barbus species clearly dominated the catches in the sampling nets, with 65% of the total weight, while the cichlids represent 22% of the catch.
Fishing activities on the reservoirs can be categorized by the type of gear used. The following have been identified during the survey:
gill nets. The nets were often set as bottom gill nets. The nets were left overnight and lifted the following morning. The mesh size used varied from 2 to 4.5 inches3. Net pieces were usually purchased in 90 metre stretched sections with a depth of 20 meshes. The rope used for mounting the nets was usually (79%) bought. Twine was bought in 43% of the cases, but floaters, sinkers as well as the needles were made from local materials. Only men were found to fish with nets.
seine nets. Seine netting is prohibited in Zambia. However, this method was commonly used in the dams. Several gill nets were joined together and could have any length between 180 and 500 metres long. Often the panels with the smaller mesh sizes (2 inches) were put in the middle, those with the bigger ones (3.5–4 inches) went at the wings. The net was set, either by using dugout canoes or the fisher and his helpers walked in the water. Helpers on the beach pulled the rope attached to the wings. As the net approached the beach, the fish were driven into the net and hauled up onto the shore. Seine netting was carried out in places where there is a clear and fairly hard bottom. It is not effective amongst reeds, grasses and underwater weeds or where there are underwater obstructions such as tree stumps or among rocks. As with gillnets, seine nets are only used by men.
traps. Traps were generally made from split reeds or coarse grass stems. Most traps had a cone shaped inlet through which the fish entered and then could not get out. The most common ones were about 1 m. long and had a diameter of 50 cm. at the inlet. Often traps were placed facing down-as well as up-stream so that they trapped both the fish which followed the current and those which swam against it. Sometimes fishers built a weir or fence across the stream, dambo or other water course. The traps were then set into the weir. Traps were normally emptied once a day. The catch was removed by untying the bunched material at the apex. An average number of 2 to 3 traps was used by the fishers. Trap fishing was done exclusively by men.
hook and line. A single hook was set on a line. The line may or may not be attached to a rod. Fishing rods were usually made from bamboo. One or two rods/lines were used at the same time. The majority (95%) of the fishers bought the lines. The length varied between 1.5 and 4 m. Few people still knew how to twist a line from sisal fibres. Hooks were always bought in shops within the area. A variety of bait was used, e.g., worms, nshima (thick porridge of mealie meal), scorpions for catfish, grass or algae for Tilapia rendalli.10% of the anglers were women.
bundles of grass. This method was commonly used in shallow water. The grass was cut and tied with fibres to make it a bundle. The bundle could be up to 3 metres long. A group of people would go in the water and drag the bundle towards the shallow waters or shore. This fishing method was often used by husband and wife or groups of women.
spears. Spears were usually made by the fishers themselves, using a stick and a piece of wire or a big nail which they sharpened. Spears were most often used in places where there were large congregations of fish, such as Clarias, confined to shallow pools and lagoons that were drying up or below the spillway when the fish was migrating. Fishers walked through the water throwing spears into the water in the hope of spearing a fish. They both fished in groups and individually. Spear fishing was done by men only.
Catches depend on what species are present in the water where the fishing is practised and also on the fishing gears used. Every fishing gear is selective, often selective for species as well as for size.
To study the reservoir fishery three different methods were used to gather information. All these three methods collected information on the species composition of the catches of the fishers or of the sampling gear. In order to compare these data the fish species are grouped in four different categories. O. andersonii, O. macrochir and T. rendalli were grouped under the category ‘bream’, ‘catfish’ represents the C, gariepinus, the three barbus species were grouped under ‘barbus’ while the group ‘other’ mainly represented L. cylindricus.
The composition of the catches in four reservoirs were more than one of the information collection methods was used, is given in Figure 3.
The stock assessment was carried out with multimesh gillnets in order to correct as much as possible for the effect of selectivity of gillnets. The catches in these nets can be assumed to be a better reflection of the actual fish stock than the catches of the fishers using one type of gear. This docs not mean that the stock sampling gives an exact presentation of the fish stock in the reservoirs. Multi-mesh gillnets can, to some extent, compensate for size selectivity but can not correct the species selectivity of the gear. Certain species are much more vulnerable for gillnets than others. It is for instance well known that C. gariepinus and T. rendalli are not commonly caught in gillnets.
The fish stocks change over time and may fluctuate greatly between years. The stock sampling was carried out at different periods as indicated in Figure 3, while the catch monitoring survey and the socio-economic study were carried out in different years. The multiple stock sampling in Makungwa and Chadewa dam clearly shows fluctuations in fish stocks between years.
The efficiency of gill nets is dependant on the fish moving into the net and then getting gilled or tangled. Gillnets normally only catch fish of a certain size. Fish that are too large will not get gilled in the net and only a small portion gets tangled, while smaller fish will swim through the net without being caught. Seine nets do not depend on the movement of the fish and often catch a wider variety of species, and catch all sizes above a certain minimum size, which is determined by the mesh size.
Many different species of fish can be caught on a line depending on the size of the hooks, the type of bait used, and the fishing site.
To catch fish, traps often rely on the movement of fish. During the beginning of the rainy season Barbus paludinosus and Clarias gariepinus migrate to the spawning grounds in the tributary. Therefore, they constituted the major part of the catches. When the water level goes down, the fish that return from drying areas up are caught. At the beginning of the rainy season mainly breeding fish were caught, while young fish were caught after the spawning season.
With bundles of grass, mainly smaller fish were caught. C. gariepinus and Barbus spp. made up a high percentage during the spawning season when they migrate to flooded areas.
Fishers who use spears can only catch the bigger fish. Because adult C. gariepinus often stay in shallow water when they are spawning, this was the principal species speared.
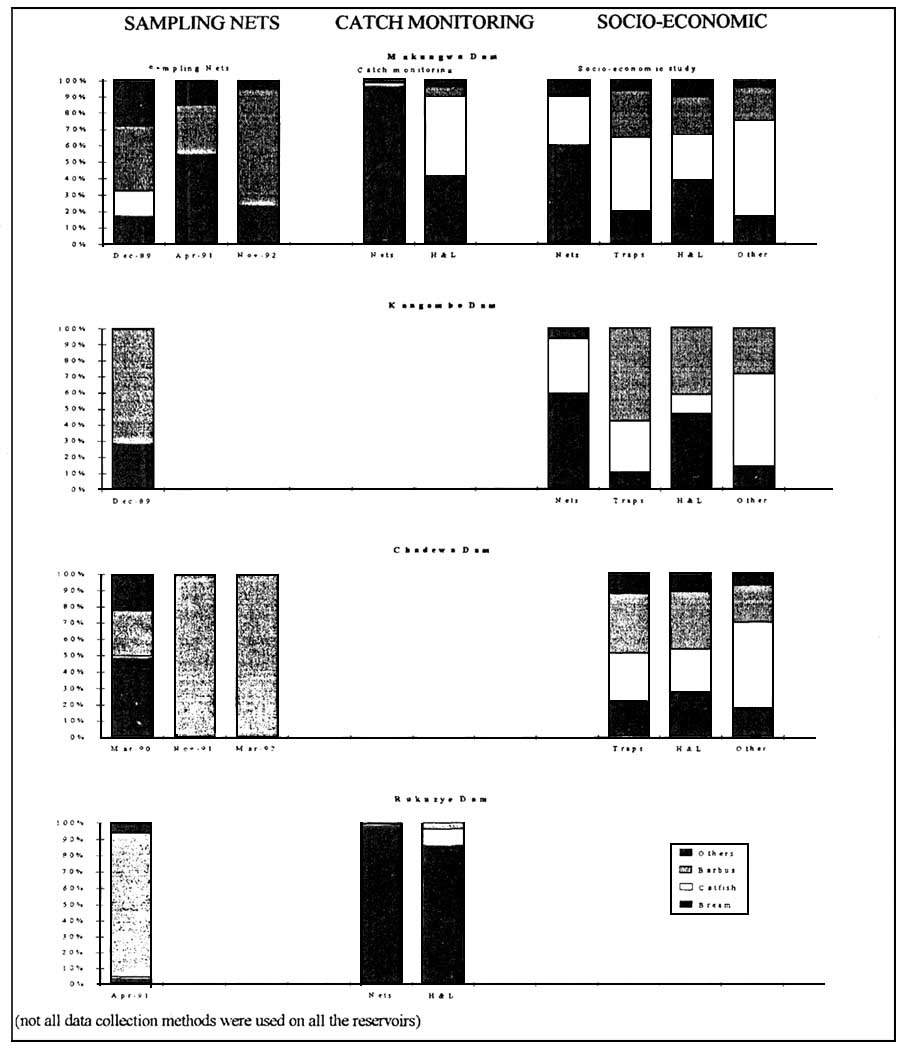
The catch monitoring survey showed that the nets, used as seine nets, mainly caught bream species, and that the catches were much less diverse than in the stock sampling nets. This is a results of the differences in mesh sizes used. The sampling nets used both smaller and larger mesh sizes and were able to catch smaller species. The small barbus species escaped the nets used by fishers. This contrast is especially clear in Rukuzye dam where the sampling nets were dominated by the barbus while these species were not caught in the other nets. Information on the catch composition of nets obtained from interviews showed a more balanced distribution between the categories of species in Makungwa and Kangombe dams. The difference between the information of the catch monitoring and the socio-economic study is obvious. This may be a result of differences in data collection methods, but may also have been influenced by a difference in stock composition. The sampling nets showed much more catfish and other species in December 1989, the time the socio-economic study was carried' out, than in 1991 and 1992, when the catch monitoring survey was conducted.
Hook and line catches were composed of more of the catfish and barbus species than the net fishery in data collected with both methods. The traps and other fishing methods concentrated in general much less on the bream species, and showed a much more diverse species composition.
The socio-economic study collected information about the largest and smallest fish caught with each fishing method, and only gave a rough indication of the size selectivity of the gears. Spear fishers obviously caught the largest fish, ranging from “hand size” to “halfway the elbow” The net fishers caught fish from a small size, “larger then a finger”, up to a fairly large size, “halfway the elbow”. The trap fishers targeted both the very small fish “less than a finger” as well as larger fish up to “halfway the elbow”. The hook and line fishers as well as the fishers using grass bundles mainly caught small fish of a size around “a finger” although the largest fish caught by hooks were a “hand size”.
The catch monitoring survey showed that the average size for the bream species caught in nets was below 35 grams, while the hook and line fishers caught breams of an average size of less than 15 grams. For catfish these average weights were around 200 and 100grams, respectively.
The different types of gear employed in the reservoirs, exploited various parts of the dam.
Most of the gill nets were set next to reeds. Only net fishers with canoes (54%) fished off-shore. Several respondents admitted that the net was used as a beach seine net as well. Only in Kangombe dam, where there were too many stumps on the bottom and where the shoreline was overgrown with reeds, seining was rare. All of the net fishers in Kangombe had dugout canoes and thus relatively more off-shore fishing took place in this reservoir. In Lutembwe dam, nets were also set just below the spill way.
Traps were usually set up and down stream. In Chadewa and Lutembwe dam, one third of the respondents said that they also placed traps in flooded areas. This was not reported for the other two dams.
Hook and line fishery was mostly practised in shallow water. Few fishers used canoes which thus limited the fishing grounds to where a person could wade in water. The majority of the anglers fished from the shore or next to the reeds. An exception was the anglers in Makungwa dam where many fished in flooded areas and below the spillway. Anglers in Makungwa considered their catches in the dam were going down as a result of the heavy net fishing, and preferred to fish in other places.
Bundles of grass were mainly used in the flooded areas next to the dam. The possibility to employ this method in the dam depended largely on the shoreline (reeds, stumps, depth). The shoreline at Chadewa was not suitable and therefore this method was not used there.
Spear fishing was also mostly done in flooded areas or just below the spillway. The water should not be too deep and be clear enough to see the fish.
In case the shoreline was suitable for seining, it was also suitable for hook and line fishery, bundles of grass and spear fishery. Competition could thus occur between these fisheries. During the short time the depressions surrounding the dam were flooded, there was a severe fishing pressure from hook and line, trap, bundles of grass and spear fishery. Hook and line fishery also completed with gill net fishery when these were set next to the reeds.
The fishing frequency per season and per gear was obtained by multiplying for each gear the percentage of respondents fishing in the different seasons with the number of times they reported to fish. The seasonality is shown in Figure 4.
In general, net fishing took place throughout the year, but was intensified during the dry season. Traps were usually set in running water. Because many streams dried up during the dry season, they were mostly used during the rainy season. Angling was done throughout the year, although the fishers were of the opinion that catches were better during the rainy season. The lower temperatures in the dry season, negatively influenced the catches. Bundles of grass were mainly used when the water level in the dam had gone down. Alternatively, they were being utilized in flooded depressions next to the dam during the rainy season. Spear fishery was practised both during the dry and rainy season, depending on the fishing grounds. Some fishers waded in the dam when the water had gone down considerably, others tried to catch the fish which swam with or against the current in the spillway during the rainy season.
The socio-economic study revealed that there were between 9 and 12 villages for each reservoir which fished more or less regularly. A breakdown of number of persons per type of fishery in each reservoir is given in Table 6.
Table 6: Breakdown of number of fishers using certain type of gear per reservoir
| Reservoir | Total number of households | NUMBER OF PERSONS USING | ||||
| Nets | H & L | Traps | Other | TOTAL | ||
| Chadewa | 884 | 2(0.3%) | 341 54.2%) | 45(7.2%) | 24138.3%) | 629(100%) |
| Makungwa | 559 | 6(1.5%) | 278(68.1%) | 32 (7.8%) | 92 (22.5%) | 408 (100%) |
| Kangombe | 529 | 5(1.4%) | 154 (43.0%) | 45 (12.6%) | 154(43.0%) | 358 (100%) |
| Average percentage: | 0.9 | 55.4 | 8.7 | 34.9 | 100 | |
This information was obtained during interviews with village elders. The figures may not be completely accurate, but they give an indication of the level of fishing taking place. These data clearly show that the use of hook and line is the most common technique. It should also be noted that there may be more than one person in a household fishing in the dam. Therefore, these data do not give a definite answer with regard to the number of households engaged in fishing.
The fishing effort was estimated for net, trap and hook and line fisheries per season, by multiplying the number of fishers with the fishing frequency per season. The number of respondents who reported to fish all year round were added to the categories ‘rainy’ and ‘dry’ season. The results for Chadewa, Makungwa and Kangombe dam are represented in Figure 5. The majority of the trap fishers set their traps overnight and checked them every day. Therefore, the fishing frequency for this category was rather high. The other fishers normally fished several times a week.
No net fishers were found in Chadewa dam during the time of the survey. Although the number of net fishers in Kangombe and Makungwa dams did not differ substantially (5 and 6 respectively), the fishing effort has been much higher during the rainy season in Makungwa. The net fishers in Makungwa dam did not come from the surrounding villages. They put up a camp next to the dam and were ‘full-time’ fishers for four to five months. Whereas the local fishers in Kangombe were mainly occupied with their farming activities during that time.
There were relatively few trap fishers around Makungwa dam. The ethnic group (Ngoni) which lived near the dam and stream had no fishing history. They were thus less skilled in ‘traditional type of fishery’ which depended on the transfer of skills from (grand) parents to children.
In all three dams there were many (150 – 340) anglers who fished on a regular basis.
During the catch monitoring survey only four net fishers were identified on both Rukuzye and Makungwa dams, while only 24 and 95 hook and line fishers were interviewed, respectively. These numbers do contrast the figures obtained with the socio-economic study. Figure 5 gives the relative fishing effort as obtained with the socio-economic study while Figure 6 gives this information as obtained with the catch monitoring survey.
A catch monitoring survey was carried out to estimate the total yield at Makungwa and Rukuzye dams between March 1991 and March 1992. During that period the catches of 28 different men were analysed at Rukuzye on 29 sampling days. In Makungwa catches of 99 different men were recorded on 49 sampling days. No women were met during the survey. Catches were recorded from hook and line and net fishing only. The nets were in all occasions used as seine nets.
The total yield was calculated by multiplying the estimated fishing effort by the catch per unit of effort for nets and hook and line fishing. The total yield from the hook and line and net fishery is estimated at 6000 kg/yr. for Makungwa dam (94% for net fishery and 6% for hook and line) and at 2200 kg/yr. for Rukuzye dam (79 and 21% for nets and hook and line, respectively). Yields per hectare per year are 600 and 100 kg, respectively. The monitoring of catches was done during a year of extreme drought and the water level in Makungwa dam was very low. It was easy for the net fishers to reach all areas with their seine nets, and as a consequence they fished out most of the fish. The high catches at Makungwa were probably unique for that year only and can not be considered sustainable. The estimated yield is therefore more related to the biomass of the reservoir than to its production.
The socio-economic study also estimated the yield in the reservoirs. The number of gears used can be multiplied with the normal fishing frequency and a typical catch. All these figures are obtained from interviews and not through direct observation. The final results after multiplication are therefore very questionable. However, the figures do show a much greater participation in the fishing from the fishers using gear other than nets, and also mat they harvest a significant part of the total catch.
Table 7 summarizes the most important characteristics of the five most common types of fishery in the Makungwa, Kangombe, Lutembwe and Chadewa reservoirs.
Table 7: Characteristics different types of fishery
| ITEM | NETS | TRAPS | HOOK & LINE | GRASS BUNDLES | SPEARS |
| -Sex fisher | men only | men only | 90% men | men and women | men only |
| -Application | 0.9% | 8.7% | 55.4% | 34.9% | |
| -Fishing site | 56% next to reeds | 42% up stream | 33% next to reeds | shore | flooded areas |
| 22% off-shore | 45% down stream | 32% on beach | flooded areas | shore | |
| 19% flooded areas | |||||
| -Fishing season | all year | rainy season | all year | mainly dry season | dry + rainy season |
| -Fishing frequency | 46% > 1t/week | 42% > 1t/week | 41% > 1t/week | 36% > 1t/week | 50% > 1t/week |
| 27% > 1t/month | 38% every day | 24% > 1t/month | 36% > 1t/month | 25% > 1t/month | |
| 21% 1t/week | |||||
| -Species caught | 58% Bream | 39% Barbus | 37% Bream | Catfish and Barbus | Catfish |
| 30% Catfish | 32% Catfish | 35% Barbus | |||
| 21% Bream | 20% Catfish | ||||
| -Size class smallest fish | > finger | 1/2–1 finger | 1 finger | 1 finger | a hand |
| -Size class biggest fish | > finger - halfway elbow | halfway elbow | 1 finger | halfway elbow |
![]()
![]()
![]()