![]()
![]()
![]()
A proper segregation of the sawn coconut timber into different grades is indispensable in order to cope with the demands of different uses. As mentioned earlier, grading starts immediately after felling by deciding on the length of logs to be cross-cut and by marking the position of logs in the stem. For example, only the two bottom logs will provide sufficient high density material. A marking by chain-saw, axe, or spray can on the bottom end is suggested, as shown in Figure 15. After sawing and dipping, the lumber has to be graded and stacked according to size, quality and density group. The techniques applied can be (Schulte,1991, Fruehwald,1992):
- visual grading
- grading by weight (deflection)
- basic density determination
- pilodyn-grading.
The density groups can be distinguished with some experience by the amount of vascular bundles (dark dots on cross-section) per square unit (Figures 19, 22 and Photo 38):
| - High density | (HD) | = many |
| - Medium density | (MD) | = less |
| - Low density | (LD) | = small number |
Photo 38: Coconut sawn timber laid out for visual grading
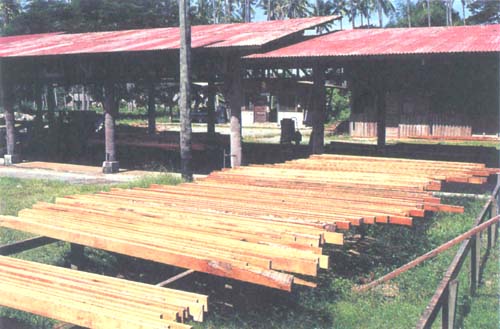
When in round form, visual distinction of the three density groups is easier. This fact could be made use of by the grader already in the log-yard. The different density groups could be marked with distinctly coloured concentric rings before sawing. The boards would bear the mark on their lower end even after sawing and could then be sorted according to their colour/group. However, this is only a rough assessment, especially with longer boards, which may show high density timber at one end and low density timber at the other. Within these density groups, the Zamboanga Research Centre (FAO,1985) suggests the following visual grades:
C-1 (clear one face):
- clear of harvesting step or wane on one face
- harvesting step or wane can appear on up to half of the thickness away from the clear side of the board
- solid spot can appear on the clear face, but in area less than two percent of the face, and individual areas of less than 0.5 cm
- no string spot allowed
- minimum accepted length: one meter.
C-2 (clear both faces):
- clear of harvesting step or wane on both faces
- all sides square
- spot as described in C-1, for both faces
- minimum accepted length: one metre.
Utility:
- wane allowed up to half an edge and half one face
- harvesting step allowed only on one edge all across; but not more than one quarter width of the face; or one face all across but not more than one third of edge
- solid spot allowed in any quantity in medium and high density, and 20 % area of any face in low density
- string spot allowed up to 5 % of the surface area of any face.
If placed on two supports, timber tends to deflect by its own weight. The degree of deflection is an indicator for its stiffness, which again reflects upon its mechanical properties. A simple device fitted with a deflection scale or gauge can be installed to grade the lumber (Figures 30, 31). The deflection is given in Table 10.
Fig. 30: Deflection grader for coconut wood
Source Sulc, 1983
Fig. 31: Simple deflection grader
Source Lockyear, 1983
Table 10: Coconut wood deflection chart
| Board length | Board thickness | Deflection in mm at mid-length of "green" coconut wood | ||||
| (mm) | (mm) | (in) | Grades | |||
| HD | MD | LD | ||||
| 6000 | 50 | 2.0 | 0 – 135 | 136 – 193 | above | 193 |
| 38 | 1.5 | 0 – 196 | 197 – 262 | above | 262 | |
| 25 | 1.0 | 0 – 346 | 347 – 960 | above | 960 | |
| 5500 | 50 | 2.0 | 0 – 76 | 77 – 109 | above | 109 |
| 38 | 1.5 | 0 – 111 | 112 – 148 | above | 148 | |
| 25 | 1.0 | 0 – 262 | 263 – 469 | above | 469 | |
| 5000 | 50 | 2.0 | 0 – 42 | 43 – 60 | above | 60 |
| 38 | 1.5 | 0 – 60 | 60 – 80 | above | 80 | |
| 25 | 1.0 | 0 – 185 | 186 – 252 | above | 252 | |
| 4500 | 50 | 2.0 | 0 – 27 | 27 – 38 | above | 38 |
| 38 | 1.5 | 0 – 42 | 43 – 57 | above | 57 | |
| 25 | 1.0 | 0 – 134 | 13 – 182 | above | 182 | |
| 4000 | 50 | 2.0 | 0 – 12 | 13 – 16 | above | 16 |
| 38 | 1.5 | 0 – 25 | 26 – 34 | above | 34 | |
| 50 | 2.0 | 0 – 7 | 8 – 10 | above | 10 | |
| 38 | 1.5 | 0 – 16 | 17 – 22 | above | 22 | |
| 25 | 1.0 | 0 – 52 | 53 – 71 | above | 71 | |
| 3000 | 50 | 2.0 | 0 – 3 | 3 – 4 | above | 4 |
| 38 | 1.5 | 0 – 7 | 23 – 30 | above | 30 | |
Source Sulc, 1983
Basic density measurement is the safest method to determine the timber grade. It is based on the close relationship between density and mechanical properties for the lower part of the stem. Basic density is calculated as oven-dry weight of a sample divided by its green volume. The procedure is simple but time-consuming and therefore should only be applied for counter-checks. Density is closely related to hardness. The Janka hardness test measures the pressure required to press a steel ball of 13 mm diameter into a timber sample over the same distance. Tests in Tonga have shown that the hardness of high density material from the periphery of butt logs rates about 10800 newton(N) at 12% moisture content,with hardly any difference between radial and tangential sides. European Oak, in comparison, shows only about 5500 N. For its simplicity, the grading system recommended is the deflection rating jointly applied with visual grading as described.
The Pilodyn-equipment (Schulte, 1991) is a handy tool weighing about 1 kg, which can easily be handcarried into the plantation. It consists of a steel nail which is driven into the wood by releasing a spring with a predetermined energy (6,12 or 18 Joule). Nails of different diameters (2 – 6 mm) can be inserted into the tool. A scale shows the depth of penetration into the timber. The depth of penetration is closely related to the density of the timber and in turn with its modulus of elasticity (MoE) and modulus of rupture (MoR). The best results were achieved with 6 J-tools and nail diameters of 2.5 mm.
![]()
![]()
![]()