![]()
![]()
![]()
Thierry Facon1
Summary
The vast and expanding body of literature on the performance of irrigation systems reflects the expanding circle of specialists, disciplines and stakeholders interested in evaluating the performance of irrigation systems. The selection of a particular set of performance indicators reflects a particular perspective and has a significant influence on the specific objectives of system management and improvement. It also has a significant influence on the details of interventions and the changes considered.
Efforts to improve irrigation performance in Asia have to a large extent concentrated on “irrigation efficiency” and on-farm water management and, more recently, on governance and institutional issues, mostly to improve cost recovery. Aspects related to design and operation of irrigation systems and service delivery have been neglected and this neglect is also reflected in many irrigation development and rehabilitation programmes. As a result, farmers often have not seen much improvement in the water delivery service provided by the systems and results in terms of agricultural and economic performance and irrigation efficiency have been disappointing.
The selection by FAO of the rapid appraisal process (RAP), developed by the Irrigation Training and Research Centre of California Polytechnic University, and its further development for FAO and the World Bank, as a methodology for appraisal of conditions and performance of irrigation systems, have been consistent with the promotion of irrigation modernization understood as “a process of technical and managerial upgrading (as opposed to mere rehabilitation) of irrigation schemes with the objective to improve resource utilization (labour, water, economic resources, environmental resources) and water delivery service to farms” and the promotion of a service orientation in the irrigation sector.
A recent series of appraisals of large and medium-scale irrigation systems by FAO and partner national irrigation agencies in eight countries in Asia by trainees of national workshops organized under a Regional Irrigation Modernization Training Programme using RAP shows that system performance and service delivered to farmers are poor but could be improved significantly with changes in design, operation and management that can easily be introduced. The level of chaos (difference between stated policies and actual policies) and of anarchy (subversion of policies) in the appraised systems is high. Lack of discipline and institutional issues contribute greatly to this situation. However, many of the problems can be traced to: problems in initial design; exporting of design concepts outside of their area of validity; difficulty of controlling and operating the systems; layouts with confused hierarchies; serious flaws in operation strategies; inconsistencies between operating rules at various levels and between operating rules and farmers’ requirements; changes in farmers’ requirements not reflected by changes in system policies; poor quality of water delivery service to farms; and lack of flexibility at all levels. Improving the efficiency of service delivery and the level of service delivered by these systems will require addressing these issues by identifying and effecting appropriate changes.
Benchmarking is defined as a systematic process for achieving continued improvement in the irrigation sector through comparisons with relevant and achievable internal or external goals, norms, and standards. The overall aim of benchmarking is to improve the performance within an irrigation scheme by measuring its performance against its peers and its own mission and objectives. The benchmarking process should be a continuous series of measurement, analysis, and changes to improve the performance of the schemes. The evaluation and analysis stages of the “holistic” benchmarking promoted by the World Bank form three legs of the benchmarking stool: evaluation of technical indicators (both internal and external); appraisal of the system processes; evaluation of service to users and their satisfaction with that service. RAP, which was included as a component of the “holistic” benchmarking, concentrates on the evaluation of the system processes and the evaluation of the service at all levels in the system, from water supply to the scheme to the farm. It also assists in the evaluation of the International Programme for Technology and Research in Irrigation and Drainage (IPTRID) benchmarking indicators.
For benchmarking to go beyond the measurement and analysis stages, and on to the implementation of changes and improvement stages, there must be significant acceptance by project personnel. The data collection and analysis are thus incorporated into a training programme that integrally involves local management and operation and maintenance staff. Staff learn the concepts of modernization and are provided with a toolbox of options. Then they evaluate their own project with RAP. At the end of the training, internal and external indicators are developed for the project and the local staff develop a priority list for changes in software and hardware based on the internal process and service indicators, which appraise all factors that affect system performance and service delivery in a systematic and standardized manner. The purpose of the appraisal is to improve specific characteristics and levels of service delivery, and to achieve improvement objectives as defined by the external performance indicators.
It has been argued that RAP cannot be considered as performance benchmarking on the grounds that it focuses on planning investment in modernization of water control infrastructure, requires well-trained and experienced engineers, does not lend itself to regular application on a large number of schemes and does not use comparison, over time and between schemes, as the basis for identifying performance gaps and planning improvements. RAP does use comparison over time and between schemes and assesses all processes of management and operation as well as hardware and can be and is applied over a large number of schemes. It can therefore be a useful and critical component of a national benchmarking programme aiming at improvement of sectoral performance if used at the inception of the programme, or to evaluate the impact of improvement projects. It does require well-trained and experienced engineers; but significant improvement in the sector’s performance in Asia will require well-trained and experienced planners, designers, managers and operators. For this reason, FAO and national irrigation agencies have introduced RAP within a training programme where trainees appraise their own systems with the support of a team of expert appraisers and trainers from the central office.
It has been affirmed that the benchmarking process will only be applied where managers “embrace the goal of pursuing best management practices within a service oriented management system” and that this implies a focus on the quality and cost-effectiveness of service delivery. This is the most original feature and central message of RAP. By appraising service quality at all levels of system management and concentrating on service interfaces between the different levels, RAP facilitates taking into account the objectives and concerns of most stakeholders at all levels, from the upper level managers, to the Water Users Associations (WUAs), to the farmers who receive service from them and provides a common language to discuss performance and system objectives. RAP is also a useful addition to asset management methodologies which focus on asset condition and serviceability.
Future development of the tool will focus on developing additional indicators to better address drainage and water disposal services, the multiple roles provided by the irrigation systems, including those concerning the environment and biodiversity, and water users from sectors other than agriculture, in order to better serve multistakeholder participatory or strategic planning and management processes. RAP has been an effective performance appraisal tool which has been consistent with FAO’s concepts of modernization adopted to this date. RAP will evolve as these evolve in the future.
Introduction
The performance of irrigation systems is the subject of a vast and fast expanding body of literature. As the debate on irrigation and its reputed poor performance intensifies and involves broadening circles of stakeholders and disciplines, the many different points of view are reflected in new evaluation procedures, methodologies and indicators that focus on the perspectives of their proponents.
The use of any particular set of performance indicators is thus the object of a radical critique by some on the grounds that these reflect the point of view of a dominant group and are, furthermore, based on very dubious data sets. For this reason, international institutions are now cooperating on the development of stakeholder-oriented valuation methods and decision-making processes reflecting the multiple roles of and perspectives on irrigation systems.
Meanwhile, specific indicators, methodologies for their assessment, and their values, continue to be among the favorite topics for argument within each discipline, and particularly the indicators related to efficiency and productivity.
The performance of irrigation systems is therefore a controversial, complex and evolving topic, which is central to the debate on the future evolution of irrigation systems. The selection of a set of performance indicators and how these are assessed is now understood to be non-neutral and to influence to a large extent the objectives, planning and design of interventions meant to improve the performance of the systems, as well as the actions taken by system managers.
On a more practical level, the understanding of the notion of irrigation efficiency by irrigation engineers and managers is very important in shaping investment in the sector. For instance, the estimation of the efficiency of an irrigation system as the product of the conveyance efficiencies of the successive levels of distribution of an irrigation system and of the on-farm application efficiency, was the foundation for irrigation projects based on the reduction of conveyance losses in the conveyance and distribution network, mostly through canal lining, and on the improvement of on-farm application efficiency. Although this approach has long been discarded by specialists in favour of water accounting/water balance based system efficiency indicators, it is still widely prevalent in a number of irrigation agencies’ design manuals and continues to be the basis for project planning and design.
FAO’s promotion of irrigation modernization and the importance of performance assessment
FAO, particularly in Southeast Asia, has concentrated its efforts in recent years on the promotion of the modernization of irrigation systems.
At a regional consultation in Bangkok, 1996 (FAO, 1997), the following definition was proposed for the modernization of irrigation systems:
“Irrigation modernization is a process of technical and managerial upgrading (as opposed to mere rehabilitation) of irrigation schemes with the objective to improve resource utilization (labour, water, economic resources, environmental resources) and the water delivery service to farms.”
This definition of the modernization of irrigation systems, which focuses on the provision of water delivery service to farmers, on service-oriented management, on the improvement of utilization of all resources, and on modernization as a process of technical and managerial (including institutional) change to meet farmers’ evolving service requirements, has been the guiding principle for FAO’s activities in the region and, quite naturally, for the selection and development of performance appraisal tools and methodologies.
In particular, FAO has been calling for a massive retraining of engineers and managers in irrigation agencies, consulting firms and irrigation service providers in Asia (FAO, 2002) in order to introduce and provide knowledge and ways and means to design, manage and operate irrigation systems economically for improved performance and adequate service to farmers as they aspire to improved socio-economic well-being, evolve toward more commercial forms of agriculture and face the challenges of globalization, the move towards integrated water resources management in the river basins, and intensifying competition for water from other sectors.
This emphasis on training and capacity building arose from: i) the results of a large-scale evaluation of the performance of the introduction on modern water control and management practices carried out for the World Bank (FAO, 1999), which indicated that the lack of knowledge of proper options was a main reason for the mitigated success of irrigation modernization projects; ii) the disappointing performance of irrigation management transfer and participatory irrigation management projects, which was partly attributed to the failure of these reforms to improve the service to farmers, and lack of attention to operation, design and other technical aspects (Barker and Molle, 2005) of irrigation systems. Intensified and ongoing training programmes for both professionals in the reformed irrigation agencies and consulting firms who would provide advisory services to WUAs, and to the managers of WUAs and the technical staff that they may employ for operation and maintenance of their irrigation schemes, were thus understood as one of the conditions of the sustained success of the transfer programmes.
An appraisal of initial conditions and performance of the systems to be transferred was estimated to be instrumental in allowing both a better design and strategic planning of physical improvements together with a definition of the service to be provided both by the irrigation service provider to WUAs and by WUAs to their members, with indications on ways and means to achieve these service goals and improve them in the future.
FAO’s regional training programme on irrigation modernization and benchmarking
FAO has developed over recent years a regional training programme on irrigation modernization. This programme aims at disseminating modern concepts of service-oriented management of irrigation systems in member countries with a view to promoting the adoption of effective irrigation modernization strategies in support of agricultural modernization, improvement of water productivity and integrated water resources management. FAO has developed training materials and detailed curricula, as well as specific tools for the appraisal of irrigation systems for benchmarking and the development of appropriate modernization plans for irrigation systems. The first training workshop under the programme was organized in Thailand in 2000. Since then India (Andhra Pradesh), Indonesia, Malaysia, Nepal, Pakistan, the Philippines, Thailand, Turkmenistan and Viet Nam have had the support of the regional training programme to organize national training workshops on irrigation modernization and benchmarking. More than 500 engineers and managers have now been trained with support from the programme.
The programme is starting to have an impact in member countries. The Royal Irrigation Department of Thailand is using the tools and methodologies introduced by the programme for the appraisal of projects, and has included the training workshops in its regular training programme. In Viet Nam, a World Bank funded investment project (the Viet Nam Water Resources Assistance Project) has a large irrigation modernization component based on the concepts introduced through initial training at project preparation stage, which was instrumental in the adoption of revised design criteria. The Department of Irrigation and Drainage (DID) of Malaysia has included the training programme and its tools in its quality and modernization strategies: proposals for modernization of the rice granary systems of the country now have to be submitted to decision-makers based on modernization plans developed by system managers following their training and the appraisal of their systems with the FAO rapid appraisal process (RAP). RAP has been adopted by the World Bank as one of the three elements of its holistic benchmarking methodology for irrigation systems. In the World Bank sourcebook for investment in agricultural water management (World Bank, 2005), the training programme is suggested to agencies wishing to invest in improving operations and maintaining large irrigation systems.
Providing the services needed by the farmers, now and in the future, is a considerable challenge for irrigation planners and managers. This paper proposes recommendations based on the lessons learned from the FAO training programme, focusing on details and aspects of the systems that are not frequently analyzed: the appraisal of the irrigation systems by the programme’s trainees using RAP; their proposals for improvement of the systems; and the use of RAP itself.
RAP, the training programme and benchmarking
RAP and why it was selected and introduced
RAP was originally developed by the Irrigation Training and Research Centre of California Polytechnic University in 1996/97 as a diagnostic and evaluation tool for a research programme financed by the World Bank on the evaluation of the impact of the introduction of modern control and management practices in irrigation on the performance of irrigation systems (FAO, 1999).
The conceptual framework of RAP (see Figure 1) for the analysis of the performance of irrigation systems can be explained as follows: irrigation systems operate under a set of physical and institutional constraints and with a certain resource base; the systems are analyzed as a series of management levels, each level providing a water delivery service through the system’s internal management and control processes to the next lower level, from the bulk water supply to the main canals down to the individual farm or field; the service quality delivered at the interface between the management levels can be appraised in terms of its components (equity, flexibility, reliability) and the accuracy of control and measurement, and depends on a number of factors related to hardware design and management; with the service quality delivered to the farm and under economic, agronomic constraints, the system and farmers’ management produces results (crops yields, irrigation intensity, water use efficiency etc.), and symptoms of poor system performance and institutional constraints are manifested as social chaos (water thefts, vandalism), poor condition of infrastructure, poor cost recovery and weak WUAs.
Results are evaluated and compared among projects through a set of external performance indicators (see Appendix 1 for the list and definition of external performance indicators of RAP), while constraints, factors influencing service quality at different levels, and symptoms are appraised through a series of standardized internal process indicators (see Appendix 2 for the list of internal process indicators of RAP, and Appendix 3 for a typical service quality indicator).
The lessons learned from the World Bank’s research project were considered by FAO to be important elements to be included in the regional irrigation modernization training programme. The RAP framework itself and its indicators were found to be consistent with FAO’s understanding of the modernization of irrigation systems as reflected in the Bangkok definition of 1996 (see above): RAP was thus adopted as the methodology for performance appraisal as well as assessment of initial conditions of irrigation systems in its training programme. After a first version used in the Thailand training workshop, ITRC developed for FAO more user-friendly versions of RAP, where the tools for estimating the systems’ water balance were also considerably expanded2 (Burt, 2003).
Benchmarking and beyond
Benchmarking is defined in documents of the International Programme for Technology and Research in Irrigation and Drainage (IPTRID) as a systematic process for achieving continued improvement in the irrigation sector through comparisons with relevant and achievable internal or external goals, norms, and standards (IPTRID, 2001). The overall aim of benchmarking is to improve the performance within an irrigation scheme by measuring its performance against its peers and its own mission and objectives. The benchmarking process should be a continuous series of measurement, analysis, and changes to improve the performance of the schemes.
RAP was later adopted as a component of the “holistic” benchmarking promoted by the World Bank. The evaluation and analysis stages of the “holistic” benchmarking form three legs of the benchmarking stool: evaluation of technical indicators (both internal and external); appraisal of the system processes; evaluation of service to users and their satisfaction with that service. RAP concentrates on the evaluation of the system processes and the evaluation of the service at all levels in the system, from water supply to the scheme to the farm, but also assists in the evaluation of the IPTRID benchmarking indicators, as the successive versions of RAP took care to use, as far as possible, the same project descriptors and performance indicators as the International Benchmarking Programme.3
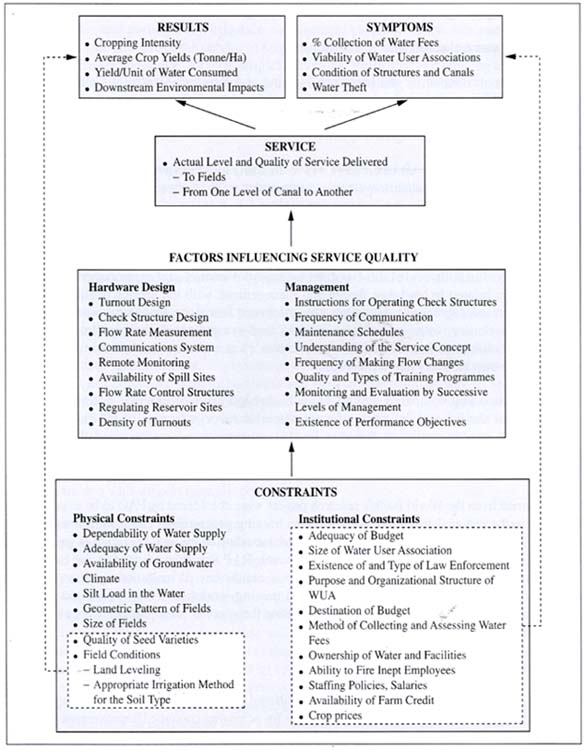
Figure 1. Conceptual framework of rapid appraisal process (RAP)
For benchmarking to go beyond the measurement and analysis stages, however, and on to the implementation of changes and improvement stages, there must be significant acceptance by project personnel, identification of weaknesses and potential changes, and knowledge of options for change. The data collection and analysis of RAP are thus incorporated into the training programme that integrally involves local management and operation and maintenance staff. Staff learn the concepts of modernization and are provided with a toolbox of options and then evaluate their own project with RAP. At the end of the training:
The external performance indicators (the IPTRID benchmarking indicators are essentially external performance indicators) allow the comparison of a project’s performance with its peers and to identify possible objectives in terms of productivity, efficiency, economic and environmental performance, but do not provide assistance in identifying specific changes in processes and hardware to improve performance. This is the essential contribution of the internal process indicators.
In the management process for existing irrigation and drainage schemes managed with a service orientation as proposed by Malano and Van Hofwegen (1999), which is essentially a strategic planning and management process for a service organization (see Figure 2), RAP allows the trainees to make an assessment (with the data that are available) of the context, resource base and constraints of the system, to appraise the existing level of service, management and infrastructure, to define a desired level of service corresponding to specific performance objectives, and to design an initial costed modernization strategy and priority actions related to management upgrade and infrastructure upgrade.
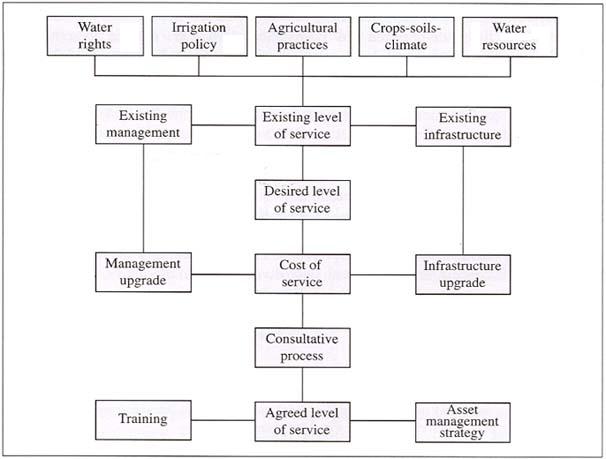
Figure 2. Management process for existing irrigation and drainage schemes managed with a service orientation (from Malano and Van Hofwegen, 1999)
The irrigation systems as they were appraised4
Type of systems
All irrigation systems appraised at the regional training programme were large-scale rice-based systems.5 They were typically designed for supplementary irrigation of rice during the rainy season (with the exception of Turkmenistan, which is under an arid desert climate). They are under public management under a supply-driven mode. WUAs have been created in a number of countries but they do not play a meaningful role in the management of the systems. The systems are generally in a poor condition because of insufficient maintenance and provide poor service to farmers. Service provided by the main canals to the secondary canals and command areas is generally unreliable and inequitable, with the exception of Malaysia. Water level control in the canals is poor and is a main factor in poor service delivery. Some systems had not received support for many years whereas substantial investment had recently been completed or was under way for other systems.
Design standards and control structures
Design standards and operation have not changed in many countries for 20 to 30 years (Plusquellec, 2002). The systems have been generally designed for upstream control, but few are actually operated under pure upstream control. The extreme case is the Dau Tieng system in Southern Viet Nam, which is now operated under manual downstream control. Wave travel times in the canals are frequently of the order of one or two days, and are increased by the operation of the cross-regulators. Buffer storage to increase system responsiveness is absent in all systems. Specific flow rates of the canals are calculated for supplemental irrigation, and are therefore quite small, and decrease from the main canals to the lower level canals. This does not allow flexibility of operations and large variations in flow rates. It is a particular constraint when farmers wish to synchronize their farming activities for mechanization and thus need large amounts of water for land preparation at the same time.
Cross-regulators are, with a few exceptions, manually operated underflow structures, in combination with underflow offtakes, and generally very sensitive to fluctuations in water supply. In the Philippines, duckbill weirs have been introduced for water level control. However, most of them have been vandalized as the systems have large variations in their water supply. During shortage periods, the upstream offtakes receive their allocation until available flows are depleted and downstream offtakes are shorted. In some cases, offtakes are of the overflow type (Rominj gates in Indonesia), which exacerbates fluctuations of flow rates into the minor canals.
Gates are rarely calibrated. The most common measurement method for flow rates is the orifice formula through (non-calibrated) gates. This formula is applied by staff whether the gates actually function as submerged, free flow orifices or are fully open and function as free-flow or submerged weirs (Andhra Pradesh Krishna Western Delta). Other measurement devices have been introduced (broad-crested weirs), but they are typically poorly designed (too broad) and inaccurate, or submerged. Recirculation of drainage is practised in a large number of schemes, but none is equipped with buffer or regulating reservoirs.
Near-farm, and on-farm infrastructure is underdeveloped. The introduction of command area development on the structured design concept or proportional flow division as an alternative to previous fully-gated distribution network designs has not been successful. The systems are immediately subverted by the farmers (Sunsari Morang Project, Nepal).
Operation
Operation follows a standard seasonal schedule that is adjusted on average every week, usually following qualitative assessments of demand by managers or qualitative requests by farmers. Main structures are operated typically three times a day according to a set schedule, very often following instructions from a central office on gate positions. Although system managers often issue instructions on flow rate targets at each offtake, these are rarely followed and most field operators adjust gates based on water levels in the canals, which correspond to a situation where farmers do not complain but do not in general correspond to a specific flow rate because of the poor condition of the canals. Farmers often operate the gates themselves and operators and managers have capitulated to this situation. A typical response to this lack of discipline is the “rotational supply”: water levels are raised in canal reaches during “on rotation” periods and lowered during “off rotation” periods.
Development of pumping
Low-cost pumping technology and energy subsidies have allowed farmers to free themselves from the constraints of poor canal system performance or inadequate scheduling through groundwater pumping, illegal pumping from the canals, water scavenging or subversion of system policies and obtain more reliable or frequent supply, switch to other crops and more effective on-farm water management strategies and techniques. Conjunctive use is not managed by anyone but usually allows farmers to adopt highly productive farming systems. As a result, tailenders may often practise more intensive and diversified farming systems.
Management policies
General management policies are typical of public institutions in the region, with few effective systems for rewarding or sanctioning performance. Field level operators are often very poorly paid and it is difficult for management and engineers to control how they actually operate the structures, which often differs from official rules and policies. How structures are actually managed is often directly responsible for instability of the system. In the Sunsari Morang (Nepal) system, main canal operators, when trying to provide a target flow rate into a secondary canal, make an initial setting at the offtake of the secondary canal, then operate the cross-regulator of the main canal to lower or raise the water level in the main canal to adjust the flow rate into the secondary canal. If they have raised the water level in the main canal too much, they then open a safety structure to divert the “excess” water supply into a drain. This example, although extreme, illustrates the importance of all details of canal operation and of instructions to operators.
The administrative setup of the operating agency frequently hinders effective operation. In Thailand, the responsibility for operation of long canals is divided into reaches under the control of different operation and maintenance projects that follow district boundaries. Although water allocation is officially to each secondary canal, in practice there is a flow rate target at the interface between each project. As a result, the projects focus their energy on disputes on flow rates at these interfaces, operate the cross-regulators as flow control structures (which creates water level fluctuations in the main canals), neglect flow rate targets into the secondary canals (which thus fluctuate wildly), and no specific office is responsible in the case of a water deficit in the lower reaches of the main canals. Although project managers already frequently integrate into their operation plans water supply to other users (municipalities, industrial customers), none of the projects appraised has specific environmental targets or goals.
Pre-training ideas for system improvement
Proposals and ideas of the training workshop trainees for improvement of their systems (and project proposals prepared by local consulting firms) — prior to the training — usually follow a standard menu of rehabilitation following prevailing standard designs, transfer of operation and maintenance costs to farmers, and substantial investments in rigid canal lining. The introduction of supervisory control and data acquisition (SCADA) systems and information technology is frequently considered or already at an early stage of introduction. However, details of selection of sensors and of control logic are frequently inadequate and the purpose of the introduction of SCADA systems to improve performance is unclear. In general, pre-training modernization proposals rarely address management, operation, scheduling and ordering procedures, communication and training.
System managers rarely have in place effective monitoring and evaluation systems. When these are in place, they are rarely used for immediate feedback for operation. Flow rates at spills and in drains are not monitored and managers do not have a proper water balance and estimation of the system’s efficiency (with the exception of Malaysia thanks to DID’s national benchmarking programme). There is, however, a gradual shift to performance-oriented management and the definition of performance indicators (Thailand). However, norms and budget allocations are often uniform nationally, not reflecting the constraints and potentials of projects, which may vary significantly across projects (Philippines). Some projects (Philippines) are piloting demand management with the introduction of volumetric water pricing. However, investment in the upgrading of the systems has not been geared towards improving control to customer WUAs, and proposed volumetric rates, based on current service fees, are not likely to yield expected water efficiency gains (de Fraiture and Perry, 2002, FAO, 2004).
Chaos, anarchy and poor service
In summary, the level of chaos (difference between stated policies and actual policies) and of anarchy (subversion of policies) varies from system to system, but is generally high, particularly at the lower levels of management. Recent investments following standards or investment strategies (command area development) have poor results in terms of performance, control and service. Although lack of discipline and institutional issues contribute greatly to this situation, many of the problems can be traced to:
Standard project improvement projects, as reflected in pre-training proposals, usually fail to address these issues. In this respect, irrigation planners, understood as central agency staff in planning and design branches, and irrigation managers, understood as system level field staff in charge of system operation, are two different groups. The former are not necessarily aware of the specific difficulties which managers face every day. Planning and design procedures, as well as terms of reference for consulting firms that are frequently assigned the tasks of planning and designing system improvements, are typically not centred on the concerns of managers and farmers. Participatory design procedures are progressively being introduced, but they frequently focus on details such as layout of the canal networks or positions of the offtakes, rather than on more general (and more important) issues of service and performance objectives and design criteria.
The challenges
The need for change
Asian large surface irrigation systems suffer from a legacy of poor design, degraded infrastructure and poor management and stagnation in the face of rapid transformations of agriculture and pressure on their water supply. The challenge is to transform these systems from supply-driven to demand-driven responsive systems, improve their financial, environmental, technical and service performance to significantly increase control, reliability, equity and flexibility to allow these systems to adapt to changing or more variable water allocations, enable farmers to boost agricultural and water productivity, be more responsive to market opportunities, and therefore adopt new and diversified water management practices on their farms. Water-related system-level objectives need to be determined case-by-case based on water balances and basin-level considerations on the one hand and agriculture-related service objectives on the other hand.
Climate change combined with competition from other sectors will entail not only increased variations in rainfall and longer dry spells during the growing seasons, but also increased variations in water allocation to the schemes from season to season, as agriculture will most likely be considered the residual water user after priority needs from other sectors have been met. This will call for flexibility in changing operational policies from year to year, and increased participation of farmers in comanagement of the systems.
However, in practise, existing water allocations and their future evolutions are difficult to anticipate for irrigation planners and managers, as the present systems of administrative or de facto allocation are yet to evolve into river basin allocation and rights systems. Furthermore, managers as well as river basin planners very rarely have accurate and operational information on irrigation system efficiencies. Although, generally, system achievements in terms of service quality are overestimated by management, system efficiencies are usually underestimated, both by managers and by agency-level planners.
Deficiencies in strategic landscapes for planning result in poor planning
Although, thanks to recent international and national efforts in visioning and strategic processes in the water sector, there is a general notion of the future landscape of agricultural water management, in practise, these visions are not sufficiently detailed for planners and managers to visualize the practical changes that would be required to meet future water-related and agriculture-related challenges — the basis of which would be an analysis of services required by farmers in the future. An exception is Malaysia, where strategic thinking processes have been adopted for a relatively long time, and where DID has adopted specific performance targets and goals both for rice and for water management performance and where system-level, institutional, and farm-level changes are viewed holistically in a transformational modernization process.
Modernization proposals for the irrigation systems that were appraised, prior to the training workshops, usually failed to establish a linkage between system-level objectives and proposals and stated objectives for the introduction of improved or innovative irrigation technologies at farm level, or between new performance objectives and proposed reform of the management and institutional setup. Structured design, proportional water division and rotational supply are not compatible with new water saving technologies developed for rice, which require frequent or on-demand irrigation water delivery. Some designs and operation concepts which seem to allow rice to reach its yield potential (Japan, Korea, Southern China — melon-on-the-vine design concept — (Plusquellec, 2002, Barker and Molle, 2005)) were not represented in the sample of projects appraised in the regional training programme. They are, however, the object of increased interest from irrigation professionals. At the institutional level, the challenge is to develop new frameworks that can manage the complexity of the hydrological cycle, the multiple roles of irrigation systems and deliver irrigation and drainage services to farmers in a responsive, accountable and efficient manner.
Financing all this would require considerable investments whereas rice prices are expected to remain low in the medium term and present financing arrangements do not cover operation and maintenance costs, let alone investments in upgrading of management capacity and infrastructure. However, increasing climate variability may increase the profitability of irrigation systems by reducing the risk of crop failure. The investment strategies of the countries in the region should have clear strategic objectives, whether production objectives concentrating on areas with competitive advantage (Malaysia for instance has this strategy) and/or poverty reduction and food security objectives targeting marginal systems.
In these circumstances, it is imperative that increased attention should be paid to the quality and type of investment. At policy level, the challenge is to align and harmonize water and irrigation policies with agricultural and environmental policies and integrate them into overall socio-economic development policies.
Response options
Water management response options need to explicitly address scale issues (farm, irrigation system and basin-level institutions, law, policy and supporting infrastructure). A systems approach is essential to determine water balance-related objectives and water management strategies to achieve them. These strategies and changes should aim at improving water control, equity, reliability and flexibility of service to give farmers water management and crop choices.
Improvement strategies should be supported by strategic planning and management approaches with a service orientation (Malano and van Hofwegen, 1999). Participatory planning and design processes would assist in focusing management goals on farmers’ needs. This would require increased decentralization of irrigation bureaucracy towards system managers and farmers’ representative institutions.
Previous irrigation modernization projects have been partly successful at best, but better options and strategies now exist. Major options include conjunctive use of surface and groundwater, recirculation of drainage, buffer reservoirs at appropriate levels in the systems, improved design of control structures, investment in drainage, operation and ordering procedures, piping of near-farm delivery, and intensification of irrigation system management. Feasible and field-tested options exist. The gap is in capacity building of the irrigation profession at large and a critical action is the revision of design standards (FAO, 1998, Plusquellec, 2002, Facon, 2002, 2005).
The regional training programme has shown that when irrigation planners and managers are presented with these options, which they were not aware of, and when, furthermore, they work together in developing proposals based on a detailed appraisal of the systems, they enthusiastically embrace them — the irrigation modernization plans that trainees prepare at the conclusion of the training workshops differ very significantly from their plans prior to the workshop. These plans include new technical options (in particular, buffer storage is seen as a powerful design feature), propose balanced investment in upgrading the capacity of management and farmers and in infrastructure, communication and mobility for operation staff; planned investment in infrastructure focuses much more on control and measurement as a priority. Plans also typically include as priorities changes in instructions to field staff for operation of control structures, changes in internal organization, improved procedures for ordering of deliverables, and an initial focus on restoring and improving water level control in the upper levels of the systems as prerequisites for further improvements and investments in the lower levels.
Information and control technology and software is now robust and available off-the-shelf and costs are decreasing everyday. Their introduction through careful strategies would make an important contribution. A priority often found in the proposals of the trainees is the remote monitoring of spills, drains, and flow rates at major offtakes as a basis for the establishment of feedback mechanisms, as well as for a better understanding of the water balance of the systems.
A business approach to institutions is the key to the future sustainability of rice-based irrigation systems, in the sense that institutions should be tailored to deliver specific performance goals in addition to governance and representation goals, and should generally improve service orientation and accountability, move towards decentralized management, and reflect the diversity of stakeholders and water uses. Models of farmers’ organizations may need to change towards professionalized institutions that can provide new ranges of delivery and other services and reduce transaction costs for farmers, as labour costs are increasing and labour and management shortages are to be further expected. Options for overhauling public management institutions include financial autonomy, incorporation, making them more professional, public-private partnerships, privatization and transfer to farmers’ organizations. New promising models are emerging in China and other countries.
New financial instruments are required to cover not only O&M but also upgrading of management and infrastructure assets at all levels of agricultural water management, from farm, to users organizations, to system-level irrigation service providers and the river basin. Public investment support will still be needed to assist in the transformation of systems and institutions in their transition from present condition towards more agile and performing systems. The observation is that this strategic investment may not be more expensive that previous infrastructure rehabilitation or canal lining programmes.
Further work is needed by international and national researchers on interactions between design standards, operation strategies, service level and water pricing. Volumetric delivery/pricing at the tertiary level is an achievable medium-term objective for gated systems provided that they are modernized (Thailand and Viet Nam, for example). Systems based on proportional flow division may well limit options to flat-rate area-based or crop-based irrigation charges if users cannot have control over water deliveries and pre-empt long-term goals of volumetric water pricing.
Policies and investments in the future need to be rice-aware rather than rice-centric (FAO Regional Strategic Framework, 2005). Aligning water and irrigation strategies and policies with agricultural and environmental policies and overall socio-economic development policies can be facilitated through the dissemination of strategic planning and management and more inclusive policy development approaches (ESCAP, 2004).
Conclusions
General conclusion
The challenges faced by irrigation planners, managers and farmers in Asia are numerous and complex. Uncertainties abound, but the uncertainty itself is an important piece of information available for planners and managers to consider in the decisions they have to take today to face the challenges of tomorrow. Irrigation systems and their management have to evolve towards flexibility to adapt on a continuous basis to face increasing variability in water supply, climate and markets.
The main lesson from the FAO regional modernization training programme is a paradox: this challenge is both underestimated and overestimated. It is underestimated because there has been in the recent past excessive reliance on policy reform, institutional reform, improved control technology, improved management, economic incentives and instruments or on-farm water management as measures that would single-handedly deliver improved performance or service. The detailed appraisals of the irrigation systems which were investigated through the regional training programme indicate that a complex and articulated mix of changes in all these fields would be in fact required. It has been underestimated also because the actual performance of the systems, particularly in terms of service delivery, is frequently overestimated.6 The challenge is overestimated because there exists a considerable potential for significantly improving system performance and service with the adoption of simple and low-cost measures, provided that an increased focus on all details of operation, management and design is adopted, and that planners and managers are aware of better options that are now available through training and capacity building.
This does not mean that far-ranging and comprehensive reform or substantial investment will not be needed. This means that it is possible to initiate a process of transformational change with immediate benefits to farmers, in terms of service, and managers, in terms of ease of operation, that will allow the necessary reform agenda and investment programmes to be more strategically focused, achievable in a realistic step-wise approach, more easily implemented, acceptable to the various stakeholders and able to adapt to rapidly changing circumstances.
RAP and benchmarking
It has been argued (Cornish, 2005) that RAP cannot be considered as performance benchmarking on the grounds that it focuses on planning investment in modernization of water control infrastructure, requires well-trained and experienced engineers, does not lend itself to regular application on a large number of schemes and does not use comparison, over time and between schemes, as the basis for identifying performance gaps and planning improvements.
In reality, RAP uses comparison over time and between schemes as explained above, assesses all processes of management and operation as well as hardware, can be and is applied over a large number of schemes (Malaysia, Thailand, Viet Nam). It can therefore be a useful and critical component of a national benchmarking programme aiming at the improvement of sectoral performance if used at the inception of the programme when systems managers develop their strategic plans or system upgrading plans, or to evaluate the impact of improvement projects, as is the case in Malaysia.
RAP does require well-trained and experienced engineers. Any significant improvement in the sector’s performance in Asia will require well-trained and experienced planners, designers, managers and operators. For this reason, FAO and national irrigation agencies such as the Royal Irrigation Department of Thailand and the Department of Irrigation and Drainage of Malaysia introduce RAP within a training programme where trainees appraise their own systems with the support of a team of expert appraisers and trainers from the central office. The experience from the FAO regional training programme is that this support from a core team of expert appraisers and trainers, who are also external to the system, is essential for quality control of RAP.
RAP and service orientation: service orientation of management and assets
Furthermore, it has been affirmed that the benchmarking process will only be applied where managers “embrace the goal of pursuing best management practices within a service oriented management system” and that this implies a focus on the quality and cost-effectiveness of service delivery (Malano, 2004). This is the most original feature and central message of RAP.
In addition, by appraising service quality at all levels of system management and concentrating on service interfaces between the different levels, RAP facilitates taking into account the objectives and concerns of the operators at all levels, from the upper-level managers, to the WUAs that may exist in the system, to the farmers who receive service from them.
In RAP, the focus on control infrastructure (and how it is operated) is viewed from the perspective of service delivery, control, operating rules, and management responsiveness. The appraisal of the numerous systems under the regional training programme confirms that poor selection and operation of the systems’ control structures play a decisive role in system service performance. Decisions on control structures (their maintenance, their operation, their replacement) are therefore critical management decisions, as are, more generally, decisions on investment in infrastructure upgrade. Poor decisions on infrastructure or sterile investment programmes that will not yield desired performance or service improvements are simply poor management decisions.
In this respect, RAP, which focuses on quality of control with and interactions between control structures, and on actual operation of these structures, is a useful and critical addition to asset management methods that focus on asset serviceability. The notion of serviceability is deemed to be important as:
“ …the serviceability of an asset (that is, its ability to perform its function) is often assumed to be directly related to its condition. But this can be a misleading assumption. In practise, assets very often continue to perform their functions quite satisfactorily even though their condition has significantly deteriorated.
On the other hand, there are frequent instances when an asset which is generally in excellent condition is rendered unserviceable by a very minor fault. It is the serviceability therefore which dictates the urgency of the work needed to restore the asset to its fully functional state” (IIS-ODA, 1995).
Asset surveys assessing the condition and serviceability of structures are therefore focused on the asset’s condition and needs for repairs or maintenance. However, an asset, such as an offtake, or a measurement device, can be brand new and perform poorly because of poor design (a Rominj gate in combination with an undershot cross-regulator for instance, or a measuring flume which is too wide) and any decision that does not lead to the replacement with a different design (Rominj gate) or modification (measuring flume) of the asset will be a poor asset management decision, or of poor operation, and changes in instructions to the operators will not lead to an improved serviceability of the asset.
RAP as support for decision-making
RAP is not as of itself a decision-making procedure, but a tool to facilitate decision-making.
The array of external performance indicators allows decision-makers to examine the various possible major objectives of a modernization process: water balance-related objectives, environmental (limited to water quality, waterlogging, salinity and efficiency) objectives, agricultural production and economic objectives (related to on-farm and resource limitations), economic and financial sustainability objectives, and to a certain extent social objectives.
The combination of external and internal indicators also allows a first representation of the interests of a number of stakeholders: central-level decision-makers, water resource managers, system managers, operators and staff at various levels, water users associations and farmers, and, to a limited extent, environmentalists concerned with the performance of the systems. Equally importantly, RAP provides a common language between central decision-makers, managers and water users, to examine the present performance of the system and future performance and change objectives, in terms of service and its characteristics, at all levels of management.
RAP can therefore be a very valuable input (but not the only one) to multistakeholder decision-making and strategic planning and management processes.
As the systems are increasingly considered as providing multiple roles and likely to evolve towards multiple use systems, future development of the tool will focus on developing additional indicators to address drainage and water disposal services better, as well as the multiple roles provided by the irrigation systems. RAP is a performance appraisal tool which is consistent with FAO’s concepts of irrigation modernization adopted until now. RAP will evolve as these evolve in the future.
References
Barker, R. & Molle, F. 2005. Evolution of irrigation in South and Southeast Asia. Comprehensive assessment research report 5. IWMI, Colombo (available at http://www.iwmi.cgiar.org).
Burt, C. 2003. Rapid Appraisal Process (RAP) and benchmarking explanation and tools (available at http://www.watercontrol.org).
Cornish, G. 2005. Performance benchmarking in the irrigation and drainage sector, experiences to date and conclusion. HR Wallingford and DFID.
De Fraiture, C. & Perry, C. 2002. Why is irrigation water demand inelastic at low price ranges? Paper presented at the Conference on Irrigation Water Policies: Micro and Macro Considerations, Agadir, Morocco, 15–17 June 2002 (available at (http://lnweb18.worldbank.org).
ESCAP. 2004. Proceedings of the concluding workshop of the regional programme on capacity building in strategic planning for natural resources management, 2004.
Facon, T. 2002. Downstream of irrigation water pricing: The infrastructure design and operational management considerations. Paper presented at the Conference on Irrigation Water Policies: Micro and Macro Considerations, Agadir, Morocco, 15–17 June 2002 (available at (http://lnweb18.worldbank.org).
Facon, T. 2005. Asian irrigation in transition — service orientation, Institutional aspects and design/operation/ infrastructure issues. In Asian irrigation in transition: responding to challenges. Ganesh Shivakoti, D. Vermillion, W. Fung Lam, E. Ostrom, U. Pradhan & R. Yoder, eds. New Delhi, Sage Publications.
FAO. 1997. Modernization of irrigation schemes: past experiences and future options. FAO-RAP 1997/22, Water Report Series 12, Bangkok.
FAO. 1999. Modern water control and management practices. In Irrigation impact on performance. FAO Water Reports 19 (also available at http://www.watercontrol.org).
FAO. 2002. Investment in Land and Water. FAO-RAP Publication 2002/09, Bangkok.
FAO. 2004. Towards a food-secure Asia and Pacific — regional strategic framework for Asia and Pacific, Bangkok (also available at http://www.fao.org).
IIS-ODA. 1995. Asset management procedures for irrigation schemes — preliminary guidelines for the preparation of an asset management plan for irrigation infrastructure. Institute of Irrigation Studies, University of Southampton) and Overseas Development Administration, UK.
IPTRID. 2001. Guidelines for benchmarking performance in the irrigation and drainage sector. International Programme for Technology and Research in Irrigation and Drainage, Rome (also available at http://www.fao.org).
Malano, H. 2004. Benchmarking in the irrigation and drainage sector. Position paper. ICID, Task force 4, New Delhi.
Malano, H. & van Hofwegen, P. 1999. Management of irrigation and drainage systems, a service approach. IHE Monograph 3, A.a. Balkema Brookfield, Rotterdam.
Plusquellec, H. 2002. How design, management and policy affect the performance of irrigation projects: emerging modernization procedures and design standards. Bangkok, FAO (available at www.watercontrol.org).
World Bank. 2005. Shaping the future of water for agriculture: a sourcebook for investment in agricultural water management. Washington, DC, The World Bank Agriculture and Rural Development Department.
Appendix 1. Rapid appraisal procedure external performance indicators
|
Item description |
Units |
|
Stated efficiencies |
|
|
Stated conveyance efficiency of imported canal water (accounts for seepage and spills and tail-end flows) |
% |
|
Weighted field irrigation efficiency from stated efficiencies |
% |
|
Areas |
|
|
Physical area of irrigated cropland in the command area (not including multiple cropping) |
ha |
|
Irrigated crop area in the command area, including multiple cropping |
ha |
|
Cropping intensity in the command area including double cropping |
none |
|
External sources of water for the command area |
|
|
Surface irrigation water inflow from outside the command area (gross at diversion and entry points) |
MCM |
|
Gross precipitation in the irrigated fields in the command area |
MCM |
|
Effective precipitation to irrigated fields (not including salinity removal) |
MCM |
|
Net aquifer withdrawal as a result of irrigation in the command area |
MCM |
|
Total external water supply for the project — including gross ppt and net aquifer withdrawal, but excluding internal recirculation |
MCM |
|
Total external irrigation supply for the project |
MCM |
|
“Internal” water sources |
|
|
Internal surface water recirculation by farmer or project in command area |
MCM |
|
Gross groundwater pumped by farmers within command area |
MCM |
|
Groundwater pumped by project authorities and applied to the command area |
MCM |
|
Gross total annual volume of project authority irrigation supply |
MCM |
|
Total groundwater pumped and dedicated to the command area |
MCM |
|
Groundwater pumped by project authorities and applied to the command area, minus net groundwater withdrawal (this is to avoid double counting. Also, all of net is applied to this term, although some might be applied to farmers) |
MCM |
|
Estimated total gross internal surface water + groundwater |
MCM |
|
Irrigation water delivered to users |
|
|
Internal authority water sources are stated to have a conveyance efficiency of: |
% |
|
Delivery of external surface irrigation water to users — using stated conveyance efficiency |
MCM |
|
All other irrigation water to users (surface recirculation plus all well pumping, with stated conveyance efficiencies, using 100% for farmer pumping and farmer surface diversions) |
MCM |
|
Total irrigation water deliveries to users (external surface irrigation water + internal diversions and pumping water sources), reduced for conveyance efficiencies |
MCM |
|
Total irrigation water (internal plus external) — just for intermediate value |
MCM |
|
Overall conveyance efficiency of project authority delivered water |
% |
|
Net field irrigation requirements |
|
|
ET of irrigated fields in the command area |
MCM |
|
ET of irrigation water in the command area (ET - effective precipitation) |
MCM |
|
Irrigation water needed for salinity control (net) |
MCM |
|
Irrigation water needed for special practices |
MCM |
|
Total NET irrigation water requirements (ET - eff. ppt + salt control + special practices) |
MCM |
|
Other key values |
|
|
Flow rate capacity of main canal(s) at diversion point(s) |
m3/s |
|
Actual peak flow rate of the main canal(s) at diversion point(s) this year |
m3/s |
|
Peak NET irrigation requirement for field, including any special requirements |
m3/s |
|
Peak GROSS irrigation requirement, including all inefficiencies |
m3/s |
|
ANNUAL or one-time external indicators for the command area |
|
|
Peak litres/sec/ha of surface irrigation inflows to canal(s) this year |
l/s/ha |
|
Relative water supply (RWS) for the irrigated part of the command area (Total external water supply)/(Field ET during growing seasons + water for salt control - effective precipitation) |
none |
|
Annual command area irrigation efficiency [100 x (crop ET + Leaching needs - Effective ppt)/ (surface irrigation diversions + Net groundwater)] |
% |
|
Field irrigation efficiency (computed) = [crop ET - effective ppt + LR water]/ [total water delivered to users] x 100 |
% |
|
Relative gross canal capacity (RGCC) — (peak monthly net irrigation requirement)/ (main canal capacity) |
none |
|
Relative actual canal flow (RACF) — (peak monthly net irrigation requirement)/ (peak main canal flow rate) |
none |
|
Gross annual tonnage of agricultural production by crop type |
M tonnes |
|
Total annual value of agricultural production |
US$ |
Appendix 2. Rapid appraisal procedure internal process indicators
|
Indicator label |
Primary indicator and sub-indicator name |
|
Service and social order | |
|
I-1 |
Actual water delivery service to individual ownership units (e.g. field or farm) |
|
I-1A |
Measurement of volumes |
|
I-1B |
Flexibility |
|
I-1C |
Reliability |
|
I-1D |
Apparent equity |
|
I-2 |
Stated water delivery service to individual ownership units (e.g. field or farm) |
|
I-2A to I-2B |
Same sub-indicators as for I–1 |
|
I-3 |
Actual water delivery service at the most downstream point in the system operated by a paid employee |
|
I-3A |
Number of fields downstream of this point |
|
I-3B |
Measurement of volumes |
|
I-3C |
Flexibility |
|
I-3D |
Reliability |
|
I-3E |
Apparent equity |
|
I-4 |
Stated water delivery service at the most downstream point operated by a paid employee |
|
I-4A to I-4E |
Same sub-indicators as for I–3 |
|
I-5 |
Actual water delivery service by the main canals to the second level canals |
|
I-5A |
Flexibility |
|
I-5B |
Reliability |
|
I-5C |
Equity |
|
I-5D |
Control of flow rates to the sub-main as stated |
|
I-6 |
Stated water delivery service by the main canals to the second level canals |
|
I-6A to I-6D |
Same sub-indicators as for I–5 |
|
I-7 |
Social “order” in the canal system operated by paid employees |
|
I-7A |
Degree to which deliveries are NOT taken when not allowed, or at flow rates greater than allowed |
|
I-7B |
Noticeable non-existence of unauthorized turnouts from canals |
|
I-7C |
Lack of vandalism of structures |
|
Main canal | |
|
I-8 |
Cross-regulator hardware (main canal) |
|
I-8A |
Ease of cross-regulator operation under the current target operation |
|
I-8B |
Level of maintenance of the cross-regulators |
|
I-8C |
Lack of water level fluctuation |
|
I-8D |
Travel time of a flow rate change throughout this canal level |
|
I-9 |
Turnouts from the main canal |
|
I-9A |
Ease of turnout operation under the current target operation |
|
I-9B |
Level of maintenance |
|
I-9C |
Flow rate capacities |
|
I-l0 |
Regulating reservoirs in the main canal |
|
I-10A |
Suitability of the number of location(s) |
|
I-10B |
Effectiveness of operation |
|
I-10C |
Suitability of the storage/buffer capacities |
|
I-10D |
Maintenance |
|
I-11 |
Communications for the main canal |
|
I-11A |
Frequency of communications with the next higher level |
|
I-11B |
Frequency of communications by operators or supervisors with their customers |
|
I-11C |
Dependability of voice communications by phone or radio |
|
I-11D |
Frequency of visits by upper-level supervisors to the field |
|
I-11E |
Existence and frequency of remote monitoring (either automatic or manual) at key spill points, including the end of the canal |
|
I-11F |
Availability of roads along the canal |
|
I-12 |
General conditions for the main canal |
|
I-12A |
General level of maintenance of the canal floor and canal banks |
|
I-12B |
General lack of undesired seepage (note: if deliberate conjunctive use is practised, some seepage may be desired) |
|
I-12C |
Availability of proper equipment and staff to adequately maintain this canal |
|
I-12D |
Travel time from the maintenance yard to the most distant point along this canal (for crews and maintenance equipment) |
|
I-13 |
Operation of the main canal |
|
I-13A |
How frequently does the headworks respond to realistic real time feedback from the operators/ observers of this canal level? |
|
I-13B |
Existence and effectiveness of water ordering/delivery procedures to match actual demands |
|
I-13C |
Clarity and correctness of instructions to operators |
|
I-13D |
How frequently is the whole length of this canal checked for problems and reported to the office? |
|
Second-level canals | |
|
I-14 to I-19 |
Same indicators as for main canal |
|
Third-level canals | |
|
I-20 to I-25 |
Same indicators as for main and second-level canals |
|
Budgets, employees, WUAs | |
|
I-26 |
Budgets |
|
I-26A |
What percentage of the total project (including WUA) O&M is collected as in-kind services, and/or water fees from water users? |
|
I-26B |
Adequacy of the actual dollars and in-kind services that is available (from all sources) to sustain adequate Operation and Maintenance (O&M) with the present mode of operation |
|
I-26C |
Adequacy of spending on modernization of the water delivery operation/structures (as contrasted to rehabilitation or regular operation) |
|
I-27 |
Employees |
|
I-27A |
Frequency and adequacy of training of operators and middle managers (not secretaries and drivers) |
|
I-27B |
Availability of written performance rules |
|
I-27C |
Power of employees to make decisions |
|
I-27D |
Ability of the project to dismiss employees with cause |
|
I-27E |
Rewards for exemplary service |
|
I-27F |
Relative salary of an operator compared to a day labourer |
|
I-28 |
Water user associations (WUAs) |
|
I-28A |
Percentage of all project users who have a functional, formal unit that participates in water distribution |
|
I-28B |
Actual ability of the strong WUAs to influence real-time water deliveries to the WUA |
|
I-28C |
Ability of the WUA to rely on effective outside help for enforcement of its rules |
|
I-28D |
Legal basis for the WUAs |
|
I-28E |
Financial strength of WUAs |
|
I-29 |
Mobility and size of operations staff, based on the ratio of operating staff to the number of turnouts. |
|
I-30 |
Computers for billing and record management: The extent to which computers are used for billing and record management |
|
I-31 |
Computers for canal control: The extent to which computers (either central or on-site) are used for canal control |
| Special indicators that do not have a 0–4 rating scale | |
| I-35 | Turnout density: Number of water users downstream of employee-operated turnouts |
| I-36 | Turnouts/Operator: (Number of turnouts operated by paid employees)/(paid employees) |
| I-37 | Main canal chaos: (actual/stated) overall service by the main canal |
| I-38 | Second-level chaos: (actual/stated) overall service at the most downstream point operated by a paid employee |
| I-39 | Field-level chaos: (actual/stated) overall service to the individual ownership units |
Appendix 3. Example of rapid appraisal procedure service indicator
|
No. |
Primary indicator |
Sub-indicator |
Ranking criteria |
Wt |
|
I–1 |
Actual water delivery service to individual ownership units (e.g. field or farm) |
|||
|
I–1A |
Measurement of volumes to the individual units (0–4) |
4 – Excellent measurement and control devices, properly operated and recorded. |
1 | |
|
I–1B |
Flexibility to the individual units (0–4) |
4 – Unlimited frequency, rate, and duration, but arranged by users within a few days. |
2 | |
|
I–1C |
Reliability to the individual units (0–4) |
4 – Water always arrives with the frequency, rate, and duration promised. Volume is known. |
4 | |
|
I–1D |
Apparent equity to individual units (0–4) |
4 – All fields throughout the project and within tertiary units receive the same type of water delivery service. |
4 |
Appendix 4. External performance indicators
|
Item Description |
Units |
Malaysia |
Indonesia |
Viet Nam |
Philippines |
Nepal |
Pakistan |
India | |||||||
 |
 |
 |
 |
 |
 |
 |
 |
 |
 |
 |
 |
 |
 | ||
|
Stated efficiencies | |||||||||||||||
|
Stated conveyance efficiency of imported canal water (accounts for seepage and spills and tail end flows) |
% |
84 |
61 |
80 |
60 |
57 |
50 |
50 |
60 |
75 |
70 |
80 |
80 |
80 |
70 |
|
Weighted field irrigation efficiency from stated efficiencies |
% |
70 |
70 |
89 |
68 |
78 |
75 |
77 |
75 |
68 |
65 |
70 |
74 |
66 |
67 |
|
Areas | |||||||||||||||
|
Physical area of irrigated cropland in the command area (not including multiple cropping) |
ha |
96 474 |
23 560 |
6 888 |
12 232 |
18 288 |
44 000 |
24 140 |
43 131 |
64 000 |
28 700 |
215 511 |
403 103 |
400 000 |
201 600 |
|
Irrigated crop area in the command area, including multiple cropping |
ha |
192 948 |
44 405 |
13 776 |
32 232 |
33 317 |
106 300 |
42 706 |
82 172 |
136 040 |
58 163 |
56 056 |
70 163 |
224 478 |
300 000 |
|
Cropping intensity in the command area including double cropping |
none |
2.00 |
1.88 |
2.00 |
2.64 |
2 |
2.42 |
1.77 |
1.91 |
2.13 |
2.03 |
0.26 |
0.17 |
0.56 |
1.49 |
|
External sources of water for the command area | |||||||||||||||
|
Surface irrigation water inflow from outside the command area (gross at diversion and entry points) |
Mm3 |
1 155 |
568 |
197 |
280 |
210 |
1 104 |
235 |
1 728 |
751 |
314 |
1 386 |
3 718 |
3 117 |
2 180 |
|
Gross precipitation in the irrigated fields in the command area |
Mm3 |
1 922 |
667 |
167 |
162 |
257 |
774 |
336 |
455 |
1 247 |
506 |
395 |
0 |
472 |
1 723 |
|
Effective precipitation to irrigated fields (not including salinity removal) |
Mm3 |
214 |
61 |
17 |
70 |
63 |
213 |
73 |
131 |
193 |
100 |
66 |
0 |
192 |
823 |
|
Net aquifer withdrawal as a result of irrigation in the command area |
Mm3 |
0 |
0 |
0 |
0 |
0 |
0 |
0 |
0 |
0 |
0 |
0 |
0 |
0 |
0 |
|
Total external water supply for the project — including gross ppt and net aquifer withdrawal, but excluding internal recirculation |
Mm3 |
3 077 |
1 235 |
365 |
442 |
467 |
1 878 |
571 |
2 183 |
1 998 |
821 |
1 781 |
3 718 |
3 589 |
3 903 |
|
Total external irrigation supply for the project |
Mm3 |
1 728 |
751 |
314 |
1 386 |
3 718 |
3 117 |
2 180 | |||||||
|
“Internal” Water Sources | |||||||||||||||
|
Internal surface water recirculation by farmer or project in command area |
Mm3 |
125 |
89 |
0 |
1 |
79 |
276 |
116 |
286 |
137 |
0 |
0 |
0 |
0 |
0 |
|
Gross groundwater pumped by farmers within command area |
Mm3 |
0 |
0 |
0 |
3 |
0 |
0 |
0 |
0 |
24 |
14 |
0 |
0 |
9 |
1 |
|
Groundwater pumped by project authorities and applied to the command area |
Mm3 |
0 |
0 |
0 |
0 |
0 |
0 |
0 |
0 |
0 |
0 |
0 |
0 |
474 |
0 |
|
Gross total annual volume of project authority irrigation supply |
Mm3 |
2 014 |
841 |
314 |
1 386 |
3 718 |
3 591 |
2 180 | |||||||
|
Total groundwater pumped and dedicated to the command area |
Mm3 |
0 |
24 |
14 |
0 |
0 |
483 |
1 | |||||||
|
Groundwater pumped by project authorities and applied to the command area, minus net groundwater withdrawal (this is to avoid double counting. Also, all of net is applied to this term, although some might be applied to farmers) |
Mm3 |
0 |
0 |
0 |
0 |
0 |
474 |
0 | |||||||
|
Estimated total gross internal surface water + groundwater |
Mm3 |
125 |
89 |
0 |
5 |
79 |
276 |
116 |
286 |
162 |
14 |
0 |
0 |
483 |
1 |
|
Irrigation water delivered to users | |||||||||||||||
|
Internal authority water sources are stated to have a conveyance efficiency of: |
% |
95 |
87 |
93 |
87 |
86 |
83 |
83 |
60 |
75 |
90 |
80 |
80 |
80 |
80 |
|
Delivery of external surface irrigation water to users — using stated conveyance efficiency |
Mm3 |
967 |
349 |
158 |
168 |
118 |
552 |
118 |
1 037 |
563 |
220 |
1 109 |
2 974 |
2 494 |
1 526 |
|
All other irrigation water to users (surface recirculation plus all well pumping, with stated conveyance efficiencies, using 100% for farmer pumping and farmer surface diversions) |
Mm3 |
172 |
139 |
14 |
0 |
0 |
388 |
1 | |||||||
|
Total irrigation water deliveries to users (external surface irrigation water + internal diversions and pumping water sources), reduced for conveyance efficiencies |
Mm3 |
1 083 |
426 |
158 |
172 |
186 |
782 |
214 |
1 208 |
702 |
234 |
1 109 |
2 974 |
2 882 |
1 527 |
|
Total irrigation water (internal plus external) — just for intermed. value |
Mm3 |
2 014 |
913 |
328 |
1 386 |
3 718 |
3 601 |
2 181 |
|||||||
|
Overall conveyance efficiency of project authority delivered water |
% |
60 |
75 |
70 |
80 |
80 |
80 |
70 |
|||||||
|
Net field irrigation requirements |
|||||||||||||||
|
ET of irrigated fields in the command area |
Mm3 |
481 |
265 |
94 |
166 |
183 |
552 |
226 |
449 |
550 |
277 |
684 |
901 |
2 112 |
918 |
|
ET of irrigation water in the command area (ET - effective precipitation) |
Mm3 |
267 |
204 |
77 |
95 |
120 |
339 |
153 |
318 |
357 |
177 |
617 |
901 |
1 921 |
95 |
|
Irrigation water needed for salinity control (net) |
Mm3 |
0 |
0 |
0 |
7 |
6 |
20 |
8 |
6 |
1 |
0 |
63 |
84 |
95 |
0 |
|
Irrigation water needed for special practices |
Mm3 |
0 |
0 |
0 |
8 |
5 |
44 |
7 |
49 |
91 |
27 |
17 |
35 |
5 |
450 |
|
Total NET irrigation water requirements (ET - eff. ppt + salt control + special practices) |
Mm3 |
267 |
204 |
77 |
110 |
130 |
402 |
168 |
372 |
449 |
204 |
696 |
1 020 |
2 021 |
545 |
|
Other key values |
|||||||||||||||
|
Flow rate capacity of main canal(s) at diversion point(s) |
cms |
141 |
34 |
14 |
19 |
25 |
90 |
31 |
100 |
60 |
24.1 |
105 |
509 |
326 |
216 |
|
Actual peak flow rate of the main canal(s) at diversion point(s) this year |
cms |
141 |
31 |
13 |
12 |
24 |
87 |
31 |
95 |
60 |
22.1 |
79 |
408 |
312 |
135 |
|
Peak NET irrigation requirement for field, including any special requirements |
cms |
23 |
15 |
4 |
6 |
8 |
25 |
10 |
21 |
35 |
11.9 |
57 |
78 |
131.1 |
122 |
|
Peak GROSS irrigation requirement, including all inefficiencies |
cms |
115 |
51 |
10 |
17 |
22 |
99 |
25 |
113 |
74 |
19.4 |
113 |
283 |
233.7 |
488 |
|
Annual or one-time external Indicators for the command area |
|||||||||||||||
|
Peak litres/sec/ha of surface irrigation inflows to canal(s) this year |
LPS/ha |
1.46 |
1.30 |
1.89 |
0.98 |
1 |
1.98 |
1.28 |
2.20 |
0.94 |
0.77 |
0.37 |
1.01 |
0.78 |
0.67 |
|
Relative water supply (RWS) for the irrigated part of the command area (Total external water supply)/(Field ET during growing seasons + water for salt control — Effective precipitation) |
none |
12.29 |
6.14 |
4.85 |
4.06 |
4 |
4.67 |
3.40 |
5.86 |
4.45 |
4.02 |
2.56 |
3.64 |
1.78 |
7.16 |
|
Annual command area irrigation efficiency [100 x (crop ET + leaching needs - effective ppt)/(surface irrigation diversions + net groundwater)] |
% |
23 |
36 |
39 |
42 |
60 |
36 |
71 |
22 |
60 |
65 |
50 |
27 |
65 |
25 |
|
Field irrigation efficiency (computed) = [Crop ET - effective ppt + LR water]/[total water delivered to users] x 100 |
% |
25 |
48 |
49 |
68 |
68 |
51 |
78 |
31 |
64 |
87 |
63 |
34 |
70 |
36 |
|
Relative gross canal capacity (RGCC) — (peak monthly net irrigation requirement)/(main canal capacity) |
none |
0.16 |
0.44 |
0.29 |
0.33 |
0 |
0.28 |
0.32 |
0.21 |
0.59 |
0.49 |
0.54 |
0.15 |
0.40 |
0.56 |
|
Relative actual canal flow (RACF) — (peak monthly net irrigation requirement)/(peak main canal flow rate) |
none |
0.16 |
0.49 |
0.31 |
0.54 |
0 |
0.29 |
0.32 |
0.22 |
0.59 |
0.54 |
0.72 |
0.19 |
0.42 |
0.90 |
|
Gross annual tonnage of agricultural production by crop type |
M tonnes |
||||||||||||||
|
Total annual value of agricultural production |
US$ |
141 957 727 |
19 944 537 |
10 917 445 |
24 596 251 |
21 378 846 |
28 772 000 |
25 382 933 |
56 199 902 |
52 680 003 |
21 614 250 |
29 928 364 |
27 420 485 |
119 967 401 |
199 184 839 |
Appendix 5: Internal Performance Indicators
 |
Indicator Name |
 |
 |
Malaysia |
Thailand |
Indonesia |
Philip |
Viet Nam |
India |
Nepal |
Pakistan |
Iran |
Mor |
Mali |
DR |
Colombia |
Mexico |
Turkey | ||||||||||||||||
|
|
|
|
 |
 |
 |
 |
|
|
 |
|
|
 |
 |
 |
 |
 |
|
|
|
|
 |
 |
 |
 |
 |
 |
 |
 |
 |
 | ||||
|
Service and social order | ||||||||||||||||||||||||||||||||||
|
I–1 |
Actual water delivery service to individual ownership units (e.g. field or farm) |
11.0 |
2.3 |
2.1 |
2.3 |
2.5 |
2.4 |
1.0 |
1.06 |
1.8 |
1.5 |
1.8 |
1.6 |
1.3 |
0.8 |
2.0 |
2.4 |
0.9 |
1.1 |
0.5 |
1.5 |
1.5 |
1.2 |
0.9 |
2.2 |
3.0 |
2.5 |
1.6 |
2.4 |
2.4 |
2.4 |
3.0 |
2.8 | |
|
I–1A |
Measurement of volumes |
1.0 |
0.0 |
0.0 |
0.3 |
2.0 |
0.0 |
0.0 |
0.65 |
0.0 |
0.0 |
0.0 |
0.0 |
0.0 |
0.0 |
0.0 |
0.0 |
0.0 |
0.0 |
0.0 |
0.0 |
0.0 |
0.0 |
0.0 |
0.0 |
2.5 |
0.0 |
0.0 |
0.8 |
1.0 |
0.5 |
2.5 |
3.0 | |
|
I–1B |
Flexibility |
2.0 |
2.0 |
1.7 |
2.5 |
2.0 |
2.0 |
1.5 |
0.8 |
1.7 |
1.0 |
2.0 |
1.0 |
1.0 |
0.5 |
1.0 |
2.0 |
1.0 |
1.0 |
0.0 |
1.5 |
1.5 |
1.5 |
1.0 |
2.0 |
3.0 |
4.0 |
4.0 |
3.0 |
2.5 |
3.0 |
3.5 |
3.0 | |
|
I–1C |
Reliability |
4.0 |
2.0 |
2.0 |
2.0 |
2.5 |
2.5 |
1.0 |
1.2 |
1.8 |
1.7 |
2.0 |
2.0 |
1.0 |
1.0 |
1.0 |
2.5 |
1.0 |
1.5 |
1.0 |
1.5 |
1.5 |
1.5 |
1.0 |
2.0 |
4.0 |
3.0 |
1.5 |
2.0 |
2.0 |
2.0 |
2.5 |
3.0 | |
|
I–1D |
Apparent equity. |
4.0 |
3.3 |
2.8 |
3.0 |
3.0 |
3.0 |
1.0 |
1.6 |
2.3 |
2.0 |
2.0 |
2.0 |
2.0 |
1.0 |
4.0 |
3.0 |
1.0 |
1.0 |
0.5 |
2.0 |
2.0 |
1.0 |
1.0 |
3.0 |
2.0 |
2.0 |
1.0 |
3.0 |
3.0 |
3.0 |
3.5 |
2.5 | |
|
I–2 |
Stated water delivery service to individual ownership units (e.g. field or farm) |
11.0 |
2.7 |
2.5 |
2.3 |
2.4 |
2.6 |
2.4 |
1.32 |
2.6 |
1.5 |
2.5 |
1.8 |
0.7 |
2.5 |
2.3 |
2.4 |
1.5 |
1.8 |
1.6 |
2.8 |
2.8 |
2.1 |
2.2 |
2.3 |
3.8 |
2.9 |
2.8 |
2.6 |
3.0 |
2.8 |
3.0 |
3.0 | |
|
I–2A |
Measurement of volumes |
1.0 |
0.0 |
3.0 |
0.3 |
0.0 |
1.0 |
2.0 |
0.87 |
2.3 |
1.3 |
0.0 |
0.0 |
0.0 |
1.0 |
1.0 |
0.0 |
0.0 |
0.0 |
0.0 |
2.0 |
2.0 |
3.0 |
3.0 |
1.0 |
4.0 |
0.0 |
1.0 |
3.0 |
3.0 |
1.0 |
2.5 |
3.5 | |
|
I–2B |
Flexibility |
2.0 |
3.0 |
2.0 |
2.3 |
2.0 |
2.0 |
2.0 |
0.8 |
2.0 |
1.0 |
4.0 |
2.0 |
0.0 |
1.7 |
2.0 |
2.0 |
1.0 |
2.0 |
1.0 |
2.5 |
2.5 |
2.0 |
2.5 |
2.0 |
3.0 |
4.0 |
3.0 |
3.0 |
3.0 |
3.0 |
3.5 |
3.0 | |
|
I–2C |
Reliability |
4.0 |
2.0 |
2.0 |
2.0 |
2.5 |
3.0 |
2.0 |
2 |
2.3 |
1.3 |
2.0 |
2.0 |
0.0 |
2.7 |
1.0 |
2.5 |
1.5 |
2.0 |
2.0 |
3.0 |
3.0 |
2.0 |
2.0 |
2.0 |
4.0 |
2.0 |
2.0 |
2.0 |
3.0 |
2.0 |
2.5 |
3.0 | |
|
I–2D |
Apparent equity. |
4.0 |
4.0 |
3.0 |
3.0 |
3.0 |
3.0 |
3.0 |
1.6 |
3.3 |
2.0 |
3.0 |
2.0 |
2.0 |
3.0 |
4.0 |
3.0 |
2.0 |
2.0 |
2.0 |
3.0 |
3.0 |
2.0 |
2.0 |
3.0 |
4.0 |
4.0 |
4.0 |
3.0 |
3.0 |
4.0 |
3.5 |
3.0 | |
|
I–3 |
Actual water delivery service at the most downstream point in the system operated by a paid employee |
17.0 |
1.9 |
2.0 |
2.0 |
2.4 |
2.0 |
0.9 |
0.76 |
1.4 |
1.5 |
1.2 |
1.4 |
0.7 |
0.9 |
1.3 |
1.4 |
1.3 |
0.7 |
0.4 |
0.9 |
0.9 |
0.9 |
1.8 |
1.8 |
2.7 |
2.4 |
1.2 |
2.2 |
2.4 |
2.2 |
3.1 |
2.9 | |
|
I–3A |
Number of fields downstream of this point |
1.0 |
1.3 |
2.0 |
2.5 |
3.0 |
0.0 |
3.0 |
0.69 |
0.0 |
0.0 |
0.0 |
0.0 |
0.0 |
0.0 |
0.0 |
1.0 |
0.0 |
0.0 |
0.0 |
0.0 |
0.0 |
0.0 |
0.0 |
3.0 |
0.0 |
4.0 |
1.0 |
3.0 |
2.5 |
4.0 |
4.0 |
4.0 | |
|
I–3B |
Measurement of volumes |
4.0 |
0.0 |
1.8 |
0.3 |
1.5 |
1.0 |
0.0 |
0 |
0.7 |
0.0 |
0.0 |
0.0 |
0.0 |
0.0 |
0.0 |
0.0 |
2.5 |
0.0 |
0.0 |
0.0 |
0.0 |
0.0 |
2.5 |
0.0 |
2.5 |
0.0 |
0.0 |
0.8 |
2.0 |
0.5 |
2.5 |
3.0 | |
|
I–3C |
Flexibility |
4.0 |
2.0 |
2.0 |
3.0 |
2.5 |
2.5 |
1.5 |
0.6 |
1.8 |
1.7 |
2.0 |
2.0 |
1.0 |
1.5 |
1.0 |
2.0 |
1.0 |
1.0 |
0.0 |
1.0 |
1.0 |
1.0 |
2.0 |
2.0 |
3.0 |
4.0 |
3.0 |
3.0 |
2.5 |
3.0 |
3.5 |
3.0 | |
|
I–3D |
Reliability |
4.0 |
2.3 |
1.7 |
2.0 |
2.5 |
2.0 |
1.0 |
0.9 |
1.3 |
2.0 |
1.5 |
2.0 |
1.0 |
1.7 |
1.0 |
1.5 |
1.0 |
1.0 |
0.5 |
1.0 |
1.0 |
1.0 |
1.5 |
2.0 |
4.0 |
3.0 |
1.0 |
2.0 |
2.0 |
2.0 |
2.5 |
3.0 | |
|
I–3E |
Apparent equity. |
4.0 |
3.3 |
2.7 |
2.5 |
3.0 |
3.0 |
0.5 |
1.6 |
2.0 |
2.7 |
1.5 |
2.0 |
1.0 |
1.3 |
3.5 |
2.0 |
1.0 |
1.0 |
1.0 |
2.0 |
2.0 |
2.0 |
1.5 |
3.0 |
2.0 |
2.0 |
1.0 |
3.0 |
3.0 |
3.0 |
3.5 |
2.5 | |
|
I–4 |
Stated water delivery service at the most downstream point in the system operated by a paid employee |
17.0 |
2.4 |
1.8 |
1.7 |
2.1 |
2.0 |
2.8 |
1.69 |
2.5 |
2.2 |
2.4 |
1.4 |
1.4 |
2.1 |
1.9 |
1.6 |
3.1 |
1.5 |
1.2 |
3.1 |
3.1 |
2.2 |
2.5 |
1.8 |
3.8 |
3.1 |
1.7 |
2.8 |
3.0 |
2.6 |
3.1 |
3.1 | |
|
I–4A |
Number of fields downstream of this point |
1.0 |
0.0 |
0.0 |
0.5 |
2.0 |
0.0 |
3.0 |
1.54 |
1.3 |
0.0 |
0.0 |
0.0 |
0.0 |
0.0 |
0.0 |
1.0 |
0.0 |
1.0 |
0.0 |
0.0 |
0.0 |
0.0 |
0.0 |
3.0 |
4.0 |
0.0 |
1.0 |
3.0 |
2.5 |
4.0 |
4.0 |
4.0 | |
|
I–4B |
Measurement of volumes |
4.0 |
1.3 |
1.0 |
1.0 |
0.5 |
1.0 |
2.0 |
0.0 |
2.0 |
1.7 |
2.0 |
0.0 |
0.0 |
2.3 |
1.0 |
0.0 |
3.0 |
0.0 |
0.0 |
3.0 |
3.0 |
3.0 |
4.0 |
0.0 |
3.0 |
4.0 |
1.0 |
3.0 |
3.0 |
1.0 |
2.5 |
3.5 | |
|
I–4C |
Flexibility |
4.0 |
2.7 |
2.0 |
2.3 |
2.5 |
2.5 |
2.0 |
2.0 |
2.0 |
2.3 |
3.0 |
2.0 |
2.0 |
1.7 |
2.0 |
2.0 |
2.0 |
2.0 |
2.5 |
3.5 |
3.5 |
2.0 |
2.5 |
2.0 |
4.0 |
2.0 |
2.0 |
3.0 |
3.0 |
3.0 |
3.5 |
3.0 | |
|
I–4D |
Reliability |
4.0 |
2.3 |
2.0 |
2.0 |
2.5 |
2.0 |
4.0 |
2.2 |
3.0 |
2.3 |
2.0 |
2.0 |
2.0 |
2.0 |
1.0 |
1.5 |
4.0 |
2.0 |
2.0 |
3.0 |
3.0 |
2.0 |
2.0 |
2.0 |
4.0 |
4.0 |
2.0 |
2.0 |
3.0 |
2.0 |
2.5 |
3.0 | |
|
I–4E |
Apparent equity. |
4.0 |
3.7 |
2.7 |
2.0 |
3.0 |
3.0 |
3.0 |
2.7 |
3.3 |
3.0 |
3.0 |
2.0 |
2.0 |
3.0 |
4.0 |
3.0 |
4.0 |
2.0 |
0.5 |
3.5 |
3.5 |
2.5 |
2.0 |
3.0 |
4.0 |
3.0 |
2.0 |
3.0 |
3.0 |
4.0 |
3.5 |
2.5 | |
|
I–5 |
Actual water delivery service by the main canals to the second-level canals |
4.5 |
2.9 |
2.6 |
2.8 |
2.6 |
3.3 |
1.3 |
2.73 |
1.7 |
1.7 |
2.7 |
2.5 |
2.2 |
1.0 |
3.0 |
3.3 |
1.8 |
1.7 |
0.4 |
1.4 |
1.2 |
1.2 |
0.9 |
3.0 |
2.5 |
2.7 |
1.1 |
2.6 |
2.1 |
2.4 |
2.8 |
2.8 | |
|
I–5A |
Flexibility |
1.0 |
1.0 |
3.0 |
3.0 |
2.5 |
4.0 |
1.5 |
2.11 |
0.5 |
1.3 |
2.0 |
3.0 |
3.0 |
1.0 |
1.0 |
3.2 |
1.0 |
1.0 |
0.0 |
1.0 |
1.0 |
1.0 |
1.5 |
3.0 |
1.0 |
4.0 |
2.0 |
2.0 |
2.0 |
2.0 |
3.0 |
2.0 | |
|
I–5B |
Reliability |
1.0 |
3.7 |
3.3 |
3.5 |
2.0 |
3.0 |
1.0 |
3.1 |
2.0 |
3.0 |
3.0 |
3.0 |
1.0 |
2.0 |
3.0 |
3.5 |
3.0 |
3.0 |
0.0 |
1.5 |
1.5 |
1.5 |
1.0 |
3.0 |
4.0 |
3.0 |
2.0 |
2.5 |
3.0 |
3.0 |
3.0 |
3.0 | |
|
I–5C |
Equity |
1.0 |
4.0 |
3.3 |
3.3 |
2.5 |
3.5 |
2.0 |
3 |
2.8 |
2.7 |
4.0 |
3.0 |
3.0 |
1.3 |
3.5 |
4.0 |
1.0 |
2.0 |
0.5 |
1.5 |
1.5 |
1.5 |
1.0 |
3.0 |
4.0 |
2.0 |
1.0 |
4.0 |
3.0 |
3.0 |
3.0 |
3.0 | |
|
I–5D |
Control of flow rates to the submain as stated |
1.5 |
3.0 |
1.5 |
1.9 |
3.0 |
3.0 |
1.0 |
2.7 |
1.5 |
0.3 |
2.0 |
1.5 |
2.0 |
0.0 |
4.0 |
2.8 |
2.0 |
1.0 |
1.0 |
1.5 |
1.0 |
1.0 |
0.5 |
3.0 |
1.5 |
2.0 |
0.0 |
2.0 |
1.0 |
2.0 |
2.5 |
3.2 | |
|
I–6 |
Stated water delivery service by the main canals to the second-level canals |
4.5 |
3.3 |
3.0 |
3.0 |
2.6 |
4.0 |
2.9 |
2.86 |
2.5 |
3.0 |
3.6 |
2.3 |
2.2 |
1.7 |
2.9 |
3.0 |
2.6 |
2.0 |
1.6 |
2.9 |
2.9 |
2.9 |
2.4 |
3.3 |
4.0 |
4.0 |
3.0 |
2.9 |
3.1 |
3.6 |
2.8 |
3.3 | |
|
I–6A |
Flexibility |
1.0 |
2.0 |
3.0 |
3.0 |
2.5 |
4.0 |
2.0 |
2.52 |
1.7 |
2.3 |
2.0 |
3.0 |
2.0 |
1.0 |
1.0 |
2.0 |
1.0 |
1.0 |
2.5 |
2.5 |
2.5 |
1.0 |
3.0 |
3.0 |
4.0 |
4.0 |
2.0 |
2.0 |
2.5 |
2.0 |
3.0 |
3.0 | |
|
I–6B |
Reliability |
1.0 |
3.7 |
3.0 |
3.0 |
2.0 |
4.0 |
1.0 |
3.3 |
3.0 |
4.0 |
4.0 |
3.0 |
3.0 |
2.7 |
3.0 |
3.0 |
3.0 |
3.0 |
2.0 |
1.5 |
1.5 |
3.0 |
2.0 |
3.0 |
4.0 |
4.0 |
4.0 |
2.5 |
3.0 |
4.0 |
3.0 |
3.0 | |
|
I–6C |
Equity |
1.0 |
4.0 |
3.0 |
3.0 |
2.5 |
4.0 |
4.0 |
2.9 |
3.0 |
2.7 |
4.0 |
2.0 |
2.0 |
1.3 |
3.0 |
4.0 |
3.0 |
2.0 |
0.5 |
3.0 |
3.0 |
3.0 |
3.0 |
3.0 |
4.0 |
4.0 |
3.0 |
4.0 |
4.0 |
4.0 |
3.0 |
3.0 | |
|
I–6D |
Control of flow rates to the submain as stated |
1.5 |
3.3 |
3.0 |
3.0 |
3.0 |
4.0 |
4.0 |
2.7 |
2.3 |
3.0 |
4.0 |
1.5 |
2.0 |
1.7 |
4.0 |
3.0 |
3.0 |
2.0 |
1.5 |
4.0 |
4.0 |
4.0 |
2.0 |
4.0 |
4.0 |
4.0 |
3.0 |
3.0 |
3.0 |
4.0 |
2.5 |
4.0 | |
|
|
Indicator Name |
|
|
Malaysia |
Thailand |
Indonesia |
Philip |
Viet Nam |
India |
Nepal |
Pakistan |
Iran |
Mor |
Mali |
DR |
Colombia |
Mexico |
Turkey | ||||||||||||||||
|
|
|
|
|
|
|
|
|
|
|
|
|
|
|
|
|
|
|
|
|
|
|
|
|
|
|
|
|
|
|
| ||||
|
I–7 |
Social order in the canal system operated by paid employees |
4.0 |
2.7 |
2.9 |
2.1 |
2.0 |
1.5 |
2.3 |
1.49 |
3.2 |
1.8 |
1.0 |
1.3 |
2.5 |
1.8 |
2.8 |
3.0 |
1.5 |
1.0 |
1.5 |
1.4 |
1.4 |
1.3 |
0.5 |
2.5 |
3.0 |
2.3 |
1.8 |
2.5 |
3.0 |
2.3 |
3.0 |
3.0 | |
|
I–7A |
Degree to which deliveries are NOT taken when not allowed, or at flow rates greater than allowed |
2.0 |
2.7 |
3.0 |
2.5 |
2.0 |
2.0 |
2.0 |
1.55 |
3.3 |
2.0 |
1.0 |
2.0 |
3.0 |
2.5 |
3.0 |
3.0 |
1.0 |
1.0 |
1.0 |
1.0 |
1.0 |
1.0 |
1.0 |
3.0 |
3.0 |
2.0 |
2.0 |
3.0 |
3.0 |
3.0 |
3.0 |
3.0 | |
|
I–7B |
Noticeable non-existence of unauthorized turnouts from canals |
1.0 |
3.0 |
3.0 |
1.5 |
3.0 |
1.0 |
2.0 |
1.0 |
3.0 |
1.7 |
2.0 |
1.0 |
2.0 |
1.0 |
3.0 |
3.0 |
2.0 |
1.0 |
1.0 |
1.5 |
1.5 |
1.0 |
0.0 |
1.0 |
3.0 |
3.0 |
1.0 |
3.0 |
3.0 |
1.0 |
3.0 |
3.0 | |
|
I–7C |
Lack of vandalism of structures |
1.0 |
2.3 |
2.7 |
1.8 |
1.0 |
1.0 |
3.0 |
3.4 |
3.2 |
1.7 |
0.0 |
0.0 |
2.0 |
1.0 |
2.0 |
3.0 |
2.0 |
1.0 |
3.0 |
2.0 |
2.0 |
2.0 |
0.0 |
3.0 |
3.0 |
2.0 |
2.0 |
1.0 |
3.0 |
2.0 |
3.0 |
3.0 | |
|
Main canal | ||||||||||||||||||||||||||||||||||
|
I–8 |
Cross-regulator hardware (main canal) |
7.0 |
1.5 |
1.3 |
2.3 |
3.1 |
3.5 |
1.5 |
2.04 |
1.7 |
1.6 |
2.1 |
0.9 |
0.7 |
0.8 |
3.4 |
3.3 |
2.2 |
1.2 |
1.7 |
1.7 |
1.6 |
1.6 |
1.7 |
3.1 |
3.6 |
2.8 |
1.6 |
3.1 |
3.2 |
2.8 |
1.9 |
2.2 | |
|
I–8A |
Ease of cross-regulator operation under the current target operation. This does not mean that the current targets are being met; rather this rating indicates how easy or difficult it would be to move the cross-regulators to meet the targets |
1.0 |
3.3 |
2.5 |
2.5 |
4.0 |
4.0 |
2.0 |
1.77 |
2.7 |
2.3 |
2.0 |
2.0 |
2.0 |
1.3 |
4.0 |
2.8 |
2.5 |
2.5 |
2.5 |
2.0 |
2.0 |
2.0 |
1.0 |
4.0 |
4.0 |
3.0 |
3.0 |
4.0 |
4.0 |
3.5 |
3.0 |
2.5 | |
|
I–8B |
Level of maintenance of the cross-regulators |
1.0 |
4.0 |
2.7 |
2.5 |
3.0 |
2.5 |
2.5 |
2.8 |
2.3 |
1.7 |
2.0 |
2.0 |
3.0 |
1.7 |
3.5 |
3.6 |
3.0 |
2.0 |
2.5 |
2.0 |
1.5 |
1.0 |
3.0 |
3.0 |
3.0 |
2.5 |
2.0 |
3.0 |
3.5 |
2.0 |
3.5 |
3.0 | |
|
I–8C |
Lack of water level fluctuation |
3.0 |
0.3 |
0.0 |
1.8 |
3.0 |
4.0 |
2.0 |
1.6 |
0.0 |
0.7 |
1.0 |
0.0 |
0.0 |
0.7 |
4.0 |
3.0 |
2.0 |
0.0 |
1.0 |
2.0 |
2.0 |
2.0 |
2.0 |
3.0 |
4.0 |
2.0 |
0.0 |
3.0 |
3.0 |
3.0 |
1.0 |
2.0 | |
|
I–8D |
Travel time of a flow rate change throughout this canal level |
2.0 |
1.0 |
2.0 |
3.0 |
3.0 |
3.0 |
0.0 |
2.0 |
3.3 |
2.7 |
4.0 |
1.0 |
0.0 |
0.3 |
2.0 |
4.0 |
2.0 |
2.0 |
2.0 |
1.0 |
1.0 |
1.0 |
1.0 |
3.0 |
3.0 |
4.0 |
3.0 |
3.0 |
3.0 |
2.5 |
2.0 |
2.0 | |
|
I–9 |
Turnouts from the main canal |
3.0 |
3.6 |
2.2 |
3.0 |
3.3 |
3.3 |
2.5 |
1.95 |
2.9 |
1.9 |
2.3 |
2.3 |
2.3 |
2.2 |
3.7 |
2.7 |
1.3 |
2.0 |
1.8 |
1.8 |
1.5 |
1.8 |
3.2 |
3.5 |
1.8 |
2.0 |
2.3 |
2.3 |
3.3 |
2.3 |
2.8 |
3.2 | |
|
I–9A |
Ease of turnout operation under the current target operation. This does not mean that the current targets are being met; rather this rating indicates how easy or difficult it would be to move the turnouts and measure flows to meet the targets |
1.0 |
3.7 |
2.7 |
2.8 |
3.0 |
3.5 |
2.0 |
2.2 |
3.0 |
2.3 |
3.0 |
2.0 |
2.0 |
2.7 |
4.0 |
3.0 |
1.0 |
2.0 |
1.5 |
2.0 |
2.0 |
2.0 |
2.5 |
4.0 |
2.5 |
2.5 |
1.0 |
2.0 |
2.0 |
2.0 |
2.5 |
3.5 | |
|
I–9B |
Level of maintenance |
1.0 |
3.0 |
2.2 |
2.8 |
3.0 |
2.5 |
1.5 |
2.8 |
2.7 |
0.7 |
1.0 |
2.0 |
3.0 |
2.0 |
3.0 |
3.0 |
3.0 |
2.0 |
2.0 |
1.5 |
1.5 |
1.5 |
3.0 |
2.5 |
1.0 |
2.5 |
2.0 |
3.0 |
4.0 |
1.0 |
2.0 |
3.0 | |
|
I–9C |
Flow rate capacities |
1.0 |
4.0 |
1.8 |
3.5 |
4.0 |
4.0 |
4.0 |
2.8 |
3.0 |
2.7 |
3.0 |
3.0 |
2.0 |
2.0 |
4.0 |
2.0 |
0.0 |
2.0 |
2.0 |
2.0 |
1.0 |
2.0 |
4.0 |
4.0 |
2.0 |
1.0 |
4.0 |
2.0 |
4.0 |
4.0 |
4.0 |
3.0 | |
|
I–l0 |
Regulating reservoirs in the main canal |
6.0 |
0.8 |
0.0 |
0.0 |
0.0 |
0.0 |
0.7 |
0.0 |
1.2 |
0.1 |
0.0 |
0.0 |
0.0 |
0.0 |
1.2 |
0.0 |
0.0 |
0.0 |
0.0 |
0.0 |
0.0 |
0.0 |
1.7 |
3.7 |
0.0 |
0.0 |
0.0 |
0.0 |
0.0 |
0.0 |
0.0 |
0.0 | |
|
I–10A |
Suitability of the number of location(s) |
2.0 |
0.7 |
0.0 |
0.0 |
0.0 |
0.0 |
2.0 |
0.0 |
1.3 |
0.0 |
0.0 |
0.0 |
0.0 |
0.0 |
2.0 |
0.0 |
0.0 |
0.0 |
0.0 |
0.0 |
0.0 |
0.0 |
3.0 |
4.0 |
0.0 |
0.0 |
0.0 |
0.0 |
0.0 |
0.0 |
0.0 |
0.0 | |
|
I–10B |
Effectiveness of operation |
2.0 |
0.7 |
0.0 |
0.0 |
0.0 |
0.0 |
0.0 |
0.0 |
1.3 |
0.0 |
0.0 |
0.0 |
0.0 |
0.0 |
0.0 |
0.0 |
0.0 |
0.0 |
0.0 |
0.0 |
0.0 |
0.0 |
2.0 |
4.0 |
0.0 |
0.0 |
0.0 |
0.0 |
0.0 |
0.0 |
0.0 |
0.0 | |
|
I–10C |
Suitability of the storage/buffer capacities |
1.0 |
0.7 |
0.0 |
0.0 |
0.0 |
0.0 |
0.0 |
0.0 |
1.3 |
0.7 |
0.0 |
0.0 |
0.0 |
0.0 |
1.0 |
0.0 |
0.0 |
0.0 |
0.0 |
0.0 |
0.0 |
0.0 |
0.0 |
4.0 |
0.0 |
0.0 |
0.0 |
0.0 |
0.0 |
0.0 |
0.0 |
0.0 | |
|
I–10D |
Maintenance |
1.0 |
1.3 |
0.0 |
0.0 |
0.0 |
0.0 |
0.0 |
0.0 |
0.7 |
0.0 |
0.0 |
0.0 |
0.0 |
0.0 |
2.0 |
0.0 |
0.0 |
0.0 |
0.0 |
0.0 |
0.0 |
0.0 |
0.0 |
2.0 |
0.0 |
0.0 |
0.0 |
0.0 |
0.0 |
0.0 |
0.0 |
0.0 | |
|
I–11 |
Communications for the main canal |
11.0 |
3.2 |
2.0 |
2.3 |
3.3 |
3.0 |
2.6 |
2.79 |
1.3 |
1.2 |
3.8 |
2.1 |
2.3 |
2.2 |
3.6 |
2.9 |
2.1 |
1.3 |
1.7 |
2.1 |
2.1 |
2.1 |
1.5 |
2.5 |
2.0 |
1.4 |
1.5 |
2.7 |
3.6 |
2.0 |
2.9 |
2.9 | |
|
I–11A |
Frequency of communications with the next higher level? (hr) |
2.0 |
3.3 |
1.3 |
1.0 |
3.0 |
3.0 |
2.0 |
2.56 |
0.7 |
0.7 |
4.0 |
1.0 |
1.0 |
3.0 |
4.0 |
2.0 |
2.0 |
1.0 |
1.0 |
3.0 |
3.0 |
3.0 |
1.0 |
2.0 |
1.0 |
1.0 |
0.5 |
2.0 |
4.0 |
4.0 |
1.0 |
2.0 | |
|
I–11B |
Frequency of communications by operators or supervisors with their customers |
2.0 |
3.0 |
2.3 |
2.0 |
2.0 |
3.0 |
1.0 |
3.0 |
0.7 |
1.3 |
4.0 |
3.0 |
2.0 |
3.7 |
3.0 |
3.0 |
2.0 |
2.0 |
2.0 |
4.0 |
4.0 |
4.0 |
1.0 |
2.0 |
3.0 |
1.0 |
1.5 |
3.0 |
4.0 |
2.0 |
4.0 |
3.0 | |
|
I–11C |
Dependability of voice communications by phone or radio |
3.0 |
4.0 |
2.0 |
3.4 |
4.0 |
3.0 |
4.0 |
3.6 |
0.3 |
0.3 |
4.0 |
2.0 |
3.0 |
1.3 |
4.0 |
2.7 |
2.5 |
0.0 |
2.0 |
1.0 |
1.0 |
1.0 |
1.0 |
3.0 |
1.0 |
0.0 |
1.0 |
4.0 |
4.0 |
1.0 |
4.0 |
3.5 | |
|
I–11D |
Frequency of visits by upper level supervisors to the field |
1.0 |
1.7 |
4.0 |
1.8 |
2.0 |
2.0 |
4.0 |
3.4 |
2.7 |
2.0 |
2.0 |
3.0 |
3.0 |
3.0 |
4.0 |
4.0 |
2.0 |
2.0 |
2.0 |
3.0 |
3.0 |
3.0 |
2.0 |
4.0 |
3.0 |
3.0 |
3.0 |
2.0 |
4.0 |
1.0 |
4.0 |
2.0 | |
|
I–11E |
Existence and frequency of remote monitoring (either automatic or manual) at key spill points, including the end of the canal |
1.0 |
1.7 |
0.0 |
1.3 |
4.0 |
3.0 |
1.0 |
2.6 |
0.3 |
1.0 |
4.0 |
2.0 |
3.0 |
1.5 |
2.0 |
3.5 |
0.0 |
0.0 |
1.0 |
0.0 |
0.0 |
0.0 |
0.0 |
2.0 |
1.5 |
0.0 |
0.0 |
0.0 |
0.0 |
0.0 |
0.0 |
1.5 | |
|
I–11F |
Availability of roads along the canal |
2.0 |
3.3 |
2.3 |
3.3 |
4.0 |
3.5 |
3.0 |
1.6 |
3.7 |
2.7 |
4.0 |
2.0 |
2.0 |
1.3 |
4.0 |
3.0 |
3.0 |
3.0 |
2.0 |
1.5 |
1.5 |
1.5 |
3.5 |
2.5 |
3.0 |
4.0 |
3.0 |
3.0 |
4.0 |
3.0 |
3.0 |
4.0 | |
|
I–12 |
General conditions for the main canal |
5.0 |
3.0 |
3.2 |
3.2 |
3.2 |
2.3 |
2.4 |
2.88 |
2.3 |
1.3 |
3.4 |
1.8 |
3.4 |
1.7 |
2.4 |
2.5 |
2.5 |
1.6 |
1.0 |
1.3 |
1.5 |
1.6 |
3.2 |
2.4 |
3.0 |
3.1 |
2.3 |
3.0 |
2.4 |
2.2 |
3.1 |
2.5 | |
|
I–12A |
General level of maintenance of the canal floor and canal banks |
1.0 |
2.7 |
3.2 |
3.3 |
3.0 |
2.5 |
2.0 |
2.6 |
2.3 |
0.0 |
3.0 |
2.0 |
3.0 |
3.0 |
3.0 |
3.5 |
3.0 |
2.0 |
1.0 |
1.5 |
1.0 |
2.0 |
3.0 |
3.0 |
3.0 |
2.5 |
2.5 |
3.0 |
3.0 |
1.0 |
3.5 |
3.0 | |
|
I–12B |
General lack of undesired seepage (note: if deliberate conjunctive use is practised, some seepage may be desired) |
1.0 |
4.0 |
3.7 |
3.0 |
3.0 |
2.0 |
3.0 |
2.5 |
2.7 |
2.7 |
4.0 |
2.0 |
4.0 |
1.3 |
3.0 |
2.0 |
2.0 |
2.0 |
2.0 |
2.0 |
2.5 |
3.0 |
3.0 |
3.0 |
4.0 |
4.0 |
4.0 |
2.0 |
1.0 |
4.0 |
2.0 |
2.5 | |
|
I–12C |
Availability of proper equipment and staff to adequately maintain this canal |
2.0 |
3.3 |
2.8 |
3.3 |
3.5 |
2.0 |
2.0 |
3.3 |
1.7 |
1.0 |
3.0 |
1.5 |
4.0 |
0.7 |
3.0 |
2.5 |
3.0 |
1.0 |
1.0 |
1.5 |
1.5 |
1.0 |
4.0 |
2.0 |
2.5 |
3.0 |
1.0 |
3.0 |
2.0 |
2.0 |
3.5 |
2.5 | |
|
|
Indicator Name |
|
|
Malaysia |
Thailand |
Indonesia |
Philip |
Viet Nam |
India |
Nepal |
Pakistan |
Iran |
Mor |
Mali |
DR |
Colombia |
Mexico |
Turkey | ||||||||||||||||
|
|
|
|
|
|
|
|
|
|
|
|
|
|
|
|
|
|
|
|
|
|
|
|
|
|
|
|
|
|
|
| ||||
|
I–12D |
Travel time from the maintenance yard to the most distant point along this canal (for crews and maintenance equipment) |
1.0 |
1.7 |
3.3 |
3.3 |
3.0 |
3.0 |
3.0 |
3.1 |
3.0 |
1.7 |
4.0 |
2.0 |
2.0 |
2.7 |
0.0 |
2.0 |
1.5 |
2.0 |
0.0 |
0.0 |
1.0 |
1.0 |
2.0 |
2.0 |
3.0 |
3.0 |
3.0 |
4.0 |
4.0 |
2.0 |
3.0 |
2.0 | |
|
I–13 |
Operation of the main canal |
5.0 |
3.3 |
2.7 |
3.0 |
3.3 |
2.8 |
0.8 |
3.11 |
1.6 |
1.9 |
2.7 |
4.0 |
4.0 |
1.5 |
3.3 |
3.1 |
0.8 |
2.4 |
0.5 |
1.6 |
1.6 |
1.6 |
2.3 |
2.7 |
2.4 |
0.5 |
0.1 |
1.1 |
1.6 |
1.9 |
2.3 |
2.1 | |
|
I–13A |
How frequently does the headworks respond to realistic real time feedback from the operators/observers of this canal level? This question deals with a mismatch of orders, and problems associated with wedge storage variations and wave travel times |
2.0 |
4.0 |
2.7 |
2.8 |
3.5 |
2.7 |
0.0 |
3.63 |
1.8 |
2.2 |
2.7 |
4.0 |
4.0 |
1.3 |
3.5 |
3.0 |
0.0 |
2.7 |
0.0 |
2.7 |
2.7 |
2.7 |
2.7 |
1.3 |
2.7 |
0.0 |
0.0 |
0.0 |
0.0 |
1.3 |
1.3 |
2.0 | |
|
I–13B |
Existence and effectiveness of water ordering/delivery procedures to match actual demands. This is different from the previous question, because the previous question dealt with problems that occur AFTER a change has been made |
1.0 |
3.1 |
2.7 |
2.8 |
4.0 |
2.0 |
0.0 |
2.66 |
1.3 |
0.0 |
1.3 |
4.0 |
4.0 |
2.0 |
1.3 |
2.0 |
0.0 |
1.3 |
0.0 |
0.0 |
0.0 |
0.0 |
0.7 |
2.7 |
1.3 |
0.0 |
0.0 |
1.3 |
0.0 |
1.3 |
2.0 |
2.0 | |
|
I–13C |
Clarity and correctness of instructions to operators |
1.0 |
4.0 |
1.3 |
2.9 |
3.0 |
2.7 |
0.0 |
2.14 |
1.9 |
3.1 |
4.0 |
4.0 |
4.0 |
1.5 |
4.0 |
3.5 |
1.3 |
2.7 |
1.3 |
0.0 |
0.0 |
0.0 |
1.3 |
4.0 |
4.0 |
1.3 |
0.0 |
0.0 |
4.0 |
2.7 |
2.7 |
1.3 | |
|
I–13D |
How frequently is the whole length of this canal checked for problems and reported to the office? This means one or more persons physically drive all the sections of the canal |
1.0 |
1.3 |
4.0 |
4.0 |
2.7 |
4.0 |
4.0 |
4.0 |
1.3 |
1.8 |
2.7 |
4.0 |
4.0 |
1.3 |
4.0 |
4.0 |
2.7 |
2.7 |
1.3 |
2.7 |
2.7 |
2.7 |
4.0 |
4.0 |
1.3 |
1.3 |
0.7 |
4.0 |
4.0 |
2.7 |
4.0 |
3.0 | |
|
Second level canals |
||||||||||||||||||||||||||||||||||
|
I–14 |
Cross-regulator hardware (Second-level canals) |
7.0 |
1.7 |
2.1 |
2.2 |
2.1 |
3.9 |
1.8 |
2.04 |
1.3 |
1.6 |
1.7 |
1.1 |
1.9 |
1.0 |
3.4 |
3.2 |
0.6 |
1.5 |
1.6 |
1.5 |
1.3 |
1.1 |
2.3 |
3.1 |
2.6 |
1.9 |
1.1 |
2.1 |
2.7 |
1.9 |
1.8 |
2.8 | |
|
I–14A |
Ease of cross-regulator operation under the current target operation. This does not mean that the current targets are being met; rather this rating indicates how easy or difficult it would be to move the cross-regulators to meet the targets |
1.0 |
3.7 |
3.0 |
3.0 |
2.0 |
4.0 |
1.0 |
2.14 |
3.0 |
2.7 |
2.0 |
2.0 |
2.0 |
2.7 |
4.0 |
4.0 |
0.0 |
1.5 |
2.0 |
1.5 |
1.5 |
0.5 |
2.0 |
4.0 |
4.0 |
3.0 |
0.0 |
3.0 |
3.0 |
3.0 |
2.5 |
2.5 | |
|
I–14B |
Level of maintenance of the cross-regulators |
1.0 |
2.0 |
2.3 |
3.0 |
3.0 |
3.0 |
1.5 |
3.0 |
3.0 |
1.7 |
1.0 |
2.0 |
3.0 |
1.3 |
3.0 |
3.5 |
0.0 |
1.0 |
1.0 |
1.0 |
1.5 |
1.0 |
3.0 |
3.0 |
3.0 |
2.0 |
0.0 |
3.0 |
2.0 |
2.5 |
2.0 |
3.0 | |
|
I–14C |
Lack of water level fluctuation |
3.0 |
0.7 |
0.7 |
1.0 |
2.0 |
4.0 |
2.0 |
1.4 |
0.0 |
0.0 |
1.0 |
0.0 |
0.0 |
0.0 |
3.0 |
3.0 |
0.0 |
0.0 |
0.0 |
0.0 |
0.0 |
0.0 |
2.0 |
3.0 |
1.0 |
0.0 |
0.0 |
1.0 |
2.0 |
0.0 |
0.0 |
2.0 | |
|
I–14D |
Travel time of a flow rate change throughout this canal level |
2.0 |
2.0 |
3.7 |
3.3 |
2.0 |
4.0 |
2.0 |
1.6 |
1.7 |
3.3 |
3.0 |
2.0 |
4.0 |
1.3 |
4.0 |
3.0 |
2.0 |
4.0 |
4.0 |
4.0 |
3.0 |
3.0 |
2.5 |
3.0 |
4.0 |
4.0 |
4.0 |
3.0 |
4.0 |
4.0 |
4.0 |
4.0 | |
|
I–15 |
Turnouts from the second level canals |
3.0 |
3.4 |
2.6 |
3.0 |
2.5 |
2.0 |
0.8 |
2.27 |
2.5 |
2.1 |
2.0 |
1.8 |
2.0 |
2.4 |
2.5 |
2.5 |
1.5 |
1.7 |
1.0 |
1.8 |
1.8 |
1.5 |
2.3 |
2.2 |
2.2 |
2.3 |
3.0 |
0.8 |
2.7 |
2.3 |
1.8 |
2.3 | |
|
I–15A |
Ease of turnout operation under the current target operation. This does not mean that the current targets are being met; rather this rating indicates how easy or difficult it would be to move the turnouts and measure flows to meet the targets |
1.0 |
3.7 |
2.7 |
3.0 |
2.5 |
2.0 |
1.0 |
2.2 |
3.0 |
2.3 |
2.0 |
2.0 |
2.0 |
2.7 |
2.5 |
2.0 |
1.5 |
2.0 |
1.0 |
2.0 |
2.0 |
1.5 |
2.0 |
2.5 |
2.5 |
3.0 |
2.0 |
1.5 |
2.0 |
2.0 |
1.5 |
2.0 | |
|
I–15B |
Level of maintenance |
1.0 |
2.7 |
2.2 |
2.6 |
3.0 |
1.0 |
1.5 |
2.4 |
2.2 |
2.0 |
2.0 |
1.5 |
2.0 |
2.0 |
3.0 |
3.5 |
3.0 |
1.0 |
0.0 |
1.5 |
1.5 |
1.0 |
2.0 |
2.0 |
2.0 |
2.0 |
3.0 |
1.0 |
2.0 |
1.0 |
1.8 |
3.0 | |
|
I–15C |
Flow rate capacities |
1.0 |
4.0 |
3.0 |
3.3 |
2.0 |
3.0 |
0.0 |
2.2 |
2.3 |
2.0 |
2.0 |
2.0 |
2.0 |
2.7 |
2.0 |
2.0 |
0.0 |
2.0 |
2.0 |
2.0 |
2.0 |
2.0 |
3.0 |
2.0 |
2.0 |
2.0 |
4.0 |
0.0 |
4.0 |
4.0 |
2.0 |
2.0 | |
|
I–16 |
Regulating reservoirs in the second level canals |
6.0 |
0.0 |
0.0 |
0.0 |
0 |
0.0 |
0.0 |
2.5 |
0.0 |
0.0 |
0.0 |
0.0 |
0.0 |
0.0 |
0.0 |
0.0 |
|||||||||||||||||
|
I–16A |
Suitability of the number of location(s) |
2.0 |
0.0 |
0.0 |
0.0 |
0.5 |
0.0 |
0.0 |
2.5 |
0.0 |
0.0 |
0.0 |
0.0 |
0.0 |
0.0 |
0.0 |
0.0 |
|||||||||||||||||
|
I–16B |
Effectiveness of operation |
2.0 |
0.0 |
0.0 |
0.0 |
0.4 |
0.0 |
0.0 |
2.5 |
0.0 |
0.0 |
0.0 |
0.0 |
0.0 |
0.0 |
0.0 |
0.0 |
|||||||||||||||||
|
I–16C |
Suitability of the storage/buffer capacities |
1.0 |
0.0 |
0.0 |
0.0 |
0.6 |
0.0 |
0.0 |
2.5 |
0.0 |
0.0 |
0.0 |
0.0 |
0.0 |
0.0 |
0.0 |
0.0 |
|||||||||||||||||
|
I–16D |
Maintenance |
1.0 |
0.0 |
0.0 |
0.0 |
0.4 |
0.0 |
0.0 |
2.5 |
0.0 |
0.0 |
0.0 |
0.0 |
0.0 |
0.0 |
0.0 |
0.0 |
|||||||||||||||||
|
I–17 |
Communications for the second-level canals |
11.0 |
2.7 |
1.8 |
2.3 |
2.7 |
2.0 |
2.3 |
2.74 |
1.4 |
1.3 |
2.6 |
2.0 |
2.6 |
1.9 |
2.4 |
2.1 |
0.5 |
1.1 |
1.4 |
1.5 |
1.7 |
1.7 |
1.5 |
2.8 |
1.4 |
1.1 |
2.1 |
2.7 |
2.7 |
1.4 |
3.1 |
2.8 | |
|
I–17A |
Frequency of communications with the next higher level? (hr) |
2.0 |
3.3 |
1.3 |
1.0 |
3.0 |
2.0 |
2.0 |
2.62 |
1.0 |
1.0 |
1.0 |
2.0 |
2.0 |
2.0 |
2.0 |
2.0 |
0.0 |
1.0 |
1.0 |
2.0 |
3.0 |
3.0 |
1.0 |
3.0 |
1.0 |
1.0 |
2.0 |
2.0 |
2.0 |
1.0 |
4.0 |
2.0 | |
|
I–17B |
Frequency of communications by operators or supervisors with their customers |
2.0 |
4.0 |
2.7 |
2.3 |
3.0 |
2.0 |
2.0 |
2.6 |
1.7 |
1.3 |
1.0 |
3.0 |
3.0 |
2.7 |
2.0 |
4.0 |
0.0 |
2.0 |
2.0 |
2.0 |
2.0 |
2.0 |
2.0 |
3.0 |
1.0 |
2.0 |
3.0 |
3.0 |
3.0 |
2.0 |
3.0 |
3.0 | |
|
I–17C |
Dependability of voice communications by phone or radio |
3.0 |
1.7 |
1.0 |
3.3 |
2.5 |
2.0 |
4.0 |
3.6 |
1.0 |
0.7 |
4.0 |
1.0 |
3.0 |
1.3 |
3.0 |
1.0 |
0.0 |
0.0 |
1.0 |
1.0 |
1.0 |
1.0 |
1.0 |
3.0 |
1.0 |
0.0 |
2.0 |
4.0 |
3.5 |
1.0 |
4.0 |
3.5 | |
|
|
Indicator Name |
|
|
Malaysia |
Thailand |
Indonesia |
Philip |
Viet Nam |
India |
Nepal |
Pakistan |
Iran |
Mor |
Mali |
DR |
Colombia |
Mexico |
Turkey | ||||||||||||||||
|
|
|
|
|
|
|
|
|
|
|
|
|
|
|
|
|
|
|
|
|
|
|
|
|
|
|
|
|
|
|
| ||||
|
I–17D |
Frequency of visits by upper level supervisors to the field |
1.0 |
3.0 |
3.7 |
2.5 |
2.0 |
2.0 |
1.0 |
3.4 |
1.7 |
2.0 |
3.0 |
4.0 |
4.0 |
2.7 |
4.0 |
2.0 |
0.0 |
2.0 |
2.0 |
3.0 |
3.0 |
3.0 |
2.0 |
2.0 |
2.0 |
1.0 |
3.0 |
2.0 |
4.0 |
0.0 |
4.0 |
4.0 | |
|
I–17E |
Existence and frequency of remote monitoring (either automatic or manual) at key spill points, including the end of the canal |
1.0 |
0.0 |
0.3 |
0.0 |
2.0 |
0.0 |
0.0 |
2.4 |
0.2 |
1.7 |
2.0 |
2.0 |
2.0 |
1.3 |
0.0 |
2.5 |
0.0 |
0.0 |
0.0 |
1.0 |
0.0 |
1.0 |
0.0 |
2.0 |
0.0 |
0.0 |
0.0 |
0.0 |
0.0 |
0.0 |
0.0 |
0.0 | |
|
I–17F |
Availability of roads along the canal |
2.0 |
3.3 |
2.3 |
3.0 |
3.0 |
3.0 |
2.0 |
1.8 |
2.5 |
2.0 |
4.0 |
1.5 |
2.0 |
2.0 |
2.5 |
2.0 |
2.5 |
2.0 |
2.0 |
1.0 |
1.5 |
1.0 |
3.0 |
3.0 |
3.0 |
2.5 |
2.0 |
3.0 |
2.5 |
3.0 |
2.0 |
3.0 | |
|
I–18 |
General conditions for the second-level canals |
5.0 |
3.4 |
3.2 |
3.1 |
2.8 |
2.2 |
2.2 |
2.98 |
2.1 |
1.7 |
2.6 |
1.4 |
2.2 |
1.8 |
2.0 |
2.2 |
2.1 |
1.6 |
1.0 |
1.6 |
1.4 |
1.6 |
2.6 |
2.4 |
2.0 |
2.9 |
2.4 |
3.1 |
2.3 |
2.0 |
2.5 |
2.8 | |
|
I–18A |
General level of maintenance of the canal floor and canal banks |
1.0 |
3.3 |
3.2 |
2.9 |
3.0 |
2.0 |
2.0 |
2.82 |
2.0 |
1.0 |
2.0 |
1.5 |
2.0 |
3.0 |
3.0 |
3.0 |
2.5 |
2.0 |
1.0 |
1.0 |
1.0 |
1.0 |
3.0 |
3.0 |
1.0 |
2.0 |
1.0 |
3.0 |
2.0 |
1.0 |
2.0 |
2.5 | |
|
I–18B |
General lack of undesired seepage (note: if deliberate conjunctive use is practised, some seepage may be desired) |
1.0 |
3.7 |
4.0 |
3.3 |
3.0 |
2.0 |
3.0 |
3.1 |
2.7 |
2.3 |
4.0 |
1.5 |
2.0 |
2.0 |
3.0 |
2.0 |
2.0 |
2.0 |
2.0 |
3.0 |
3.0 |
3.0 |
2.0 |
3.0 |
4.0 |
4.0 |
4.0 |
3.0 |
1.5 |
4.0 |
2.0 |
2.5 | |
|
I–18C |
Availability of proper equipment and staff to adequately maintain this canal |
2.0 |
3.5 |
2.7 |
3.0 |
2.5 |
2.0 |
1.5 |
3.4 |
2.3 |
1.0 |
3.0 |
1.0 |
2.0 |
1.0 |
2.0 |
2.5 |
2.0 |
1.0 |
0.0 |
1.0 |
1.0 |
1.0 |
3.0 |
2.0 |
1.0 |
3.0 |
2.0 |
3.0 |
2.0 |
1.0 |
2.5 |
3.0 | |
|
I–18D |
Travel time from the maintenance yard to the most distant point along this canal (for crews and maintenance equipment) |
1.0 |
3.0 |
3.7 |
3.5 |
3.0 |
3.0 |
3.0 |
2.6 |
1.3 |
3.0 |
1.0 |
2.0 |
3.0 |
2.0 |
0.0 |
1.0 |
2.0 |
2.0 |
2.0 |
2.0 |
1.0 |
2.0 |
2.0 |
2.0 |
3.0 |
2.5 |
3.0 |
3.5 |
4.0 |
3.0 |
3.5 |
3.0 | |
|
I–19 |
Operation of the second level canals |
5.0 |
3.4 |
2.7 |
2.9 |
3.1 |
3.0 |
1.5 |
2.66 |
1.8 |
1.7 |
3.1 |
2.4 |
2.7 |
1.3 |
3.1 |
3.1 |
1.3 |
2.1 |
0.3 |
1.3 |
1.1 |
1.3 |
2.3 |
4.0 |
2.4 |
2.7 |
2.1 |
2.9 |
3.5 |
1.7 |
2.9 |
3.3 | |
|
I–19A |
How frequently does the headworks respond to realistic real time feedback from the operators/observers of this canal level? This question deals with a mismatch of orders, and problems associated with wedge storage variations and wave travel times |
2.0 |
2.7 |
2.5 |
2.8 |
2.7 |
2.7 |
0.7 |
2.72 |
1.3 |
1.3 |
4.0 |
2.7 |
2.7 |
0.0 |
4.0 |
2.7 |
1.3 |
2.7 |
0.0 |
2.7 |
1.3 |
1.3 |
2.7 |
4.0 |
1.3 |
4.0 |
2.7 |
2.0 |
4.0 |
1.3 |
3.3 |
2.7 | |
|
I–19B |
Existence and effectiveness of water ordering/delivery procedures to match actual demands. This is different from the previous question, because the previous question dealt with problems that occur AFTER a change has been made |
1.0 |
4.0 |
2.0 |
2.5 |
2.7 |
2.7 |
0.7 |
2.7 |
1.5 |
1.8 |
2.7 |
2.7 |
2.7 |
1.3 |
1.3 |
2.7 |
0.0 |
1.3 |
0.0 |
0.0 |
0.0 |
0.0 |
0.7 |
4.0 |
1.3 |
2.0 |
1.3 |
4.0 |
2.7 |
1.3 |
2.0 |
4.0 | |
|
I–19C |
Clarity and correctness of instructions to operators |
1.0 |
3.6 |
3.6 |
2.8 |
3.3 |
2.7 |
1.3 |
2.26 |
4.0 |
2.7 |
2.0 |
1.3 |
2.7 |
4.0 |
2.0 |
3.3 |
1.3 |
2.7 |
0.0 |
0.0 |
0.0 |
0.0 |
1.3 |
4.0 |
4.0 |
0.0 |
1.3 |
2.7 |
2.7 |
0.7 |
2.0 |
3.3 | |
|
I–19D |
How frequently is the whole length of this canal checked for problems and reported to the office? This means one or more persons physically drive all the sections of the canal |
1.0 |
4.0 |
3.1 |
3.7 |
4.0 |
4.0 |
4.0 |
2.96 |
1.1 |
1.3 |
2.7 |
2.7 |
2.7 |
1.3 |
4.0 |
4.0 |
2.7 |
1.3 |
1.3 |
1.3 |
2.7 |
4.0 |
4.0 |
4.0 |
4.0 |
3.3 |
2.7 |
4.0 |
4.0 |
4.0 |
4.0 |
4.0 | |
|
Third-level canals |
||||||||||||||||||||||||||||||||||
|
I–20 |
Cross-regulator hardware (Third-level canals) |
7.0 |
2.0 |
2.0 |
2.5 |
2.13 |
2.1 |
0.8 |
1.7 |
2.3 |
1.3 |
1.7 |
2.0 |
1.1 |
1.6 |
1.1 |
||||||||||||||||||
|
I–20A |
Ease of cross-regulator operation under the current target operation. This does not mean that the current targets are being met; rather this rating indicates how easy or difficult it would be to move the cross-regulators to meet the targets |
1.0 |
3.7 |
2.0 |
3.3 |
2.1 |
4.0 |
2.0 |
3.0 |
3.0 |
2.3 |
1.0 |
0.0 |
0.0 |
2.0 |
0.0 |
||||||||||||||||||
|
I–20B |
Level of maintenance of the cross-regulators |
1.0 |
3.0 |
1.3 |
2.5 |
3.0 |
2.7 |
1.0 |
1.0 |
2.0 |
1.3 |
0.0 |
0.0 |
0.0 |
1.5 |
0.0 |
||||||||||||||||||
|
I–20C |
Lack of water level fluctuation |
3.0 |
0.7 |
1.7 |
1.8 |
1.6 |
0.3 |
0.0 |
0.0 |
1.0 |
0.0 |
1.0 |
2.0 |
0.0 |
0.0 |
0.0 |
||||||||||||||||||
|
I–20D |
Travel time of a flow rate change throughout this canal level |
2.0 |
2.7 |
2.7 |
3.3 |
1.8 |
3.7 |
1.3 |
4.0 |
4.0 |
2.7 |
4.0 |
4.0 |
4.0 |
4.0 |
4.0 |
||||||||||||||||||
|
I–21 |
Turnouts from the third-level canals |
3.0 |
1.3 |
2.2 |
2.8 |
2.42 |
2.3 |
1.2 |
1.7 |
2.0 |
2.2 |
0.7 |
0.7 |
2.7 |
2.7 |
2.7 |
||||||||||||||||||
|
I–21A |
Ease of turnout operation under the current target operation. This does not mean that the current targets are being met; rather this rating indicates how easy or difficult it would be to move the turnouts and measure flows to meet the targets |
1.0 |
0.0 |
2.3 |
2.8 |
2.17 |
3.0 |
1.7 |
2.0 |
2.0 |
2.7 |
1.0 |
0.0 |
3.0 |
3.0 |
3.0 |
||||||||||||||||||
|
I–21B |
Level of maintenance |
1.0 |
1.3 |
1.5 |
2.6 |
2.4 |
2.0 |
0.7 |
1.0 |
2.0 |
2.0 |
0.0 |
1.0 |
2.0 |
2.0 |
2.0 |
||||||||||||||||||
|
I–21C |
Flow rate capacities |
1.0 |
2.7 |
2.7 |
3.0 |
2.7 |
2.0 |
1.3 |
2.0 |
2.0 |
2.0 |
1.0 |
1.0 |
3.0 |
3.0 |
3.0 |
||||||||||||||||||
|
I–22 |
Regulating reservoirs in the third level canals |
6.0 |
0.0 |
0.0 |
0.0 |
0.0 |
0.0 |
0.0 |
0.0 |
0.0 |
0.0 |
0.0 |
0.0 |
0.0 |
0.0 |
0.0 |
||||||||||||||||||
|
I–22A |
Suitability of the number of location(s) |
2.0 |
0.0 |
0.0 |
0.0 |
0.0 |
0.0 |
0.0 |
0.0 |
0.0 |
0.0 |
0.0 |
0.0 |
0.0 |
0.0 |
0.0 |
||||||||||||||||||
|
|
Indicator Name |
|
|
Malaysia |
Thailand |
Indonesia |
Philip |
Viet Nam |
India |
Nepal |
Pakistan |
Iran |
Mor |
Mali |
DR |
Colombia |
Mexico |
Turkey | ||||||||||||||||
|
|
|
|
|
|
|
|
|
|
|
|
|
|
|
|
|
|
|
|
|
|
|
|
|
|
|
|
|
|
|
| ||||
|
I–22B |
Effectiveness of operation |
2.0 |
0.0 |
0.0 |
0.0 |
0.0 |
0.0 |
0.0 |
0.0 |
0.0 |
0.0 |
0.0 |
0.0 |
0.0 |
0.0 |
0.0 |
||||||||||||||||||
|
I–22C |
Suitability of the storage/buffer capacities |
1.0 |
0.0 |
0.0 |
0.0 |
0.0 |
0.0 |
0.0 |
0.0 |
0.0 |
0.0 |
0.0 |
0.0 |
0.0 |
0.0 |
0.0 |
||||||||||||||||||
|
I–22D |
Maintenance |
1.0 |
0.0 |
0.0 |
0.0 |
0.0 |
0.0 |
0.0 |
0.0 |
0.0 |
0.0 |
0.0 |
0.0 |
0.0 |
0.0 |
0.0 |
||||||||||||||||||
|
I–23 |
Communications for the third-level canals |
11.0 |
3.1 |
1.4 |
2.3 |
2.45 |
0.6 |
0.5 |
1.5 |
2.3 |
1.3 |
0.9 |
0.6 |
1.6 |
1.6 |
1.9 |
||||||||||||||||||
|
I–23A |
Frequency of communications with the next higher level? (hr) |
2.0 |
3.3 |
2.0 |
1.0 |
2.51 |
1.0 |
0.7 |
2.0 |
4.0 |
1.7 |
1.0 |
1.0 |
3.0 |
3.0 |
3.0 |
||||||||||||||||||
|
I–23B |
Frequency of communications by operators or supervisors with their customers |
2.0 |
4.0 |
1.7 |
2.5 |
2.6 |
0.7 |
0.7 |
2.0 |
4.0 |
1.7 |
2.0 |
2.0 |
2.0 |
2.0 |
2.0 |
||||||||||||||||||
|
I–23C |
Dependability of voice communications by phone or radio |
3.0 |
2.7 |
0.7 |
3.5 |
3.4 |
0.3 |
0.3 |
1.0 |
1.0 |
1.0 |
0.0 |
0.0 |
1.0 |
1.0 |
1.0 |
||||||||||||||||||
|
I–23D |
Frequency of visits by upper level supervisors to the field |
1.0 |
3.0 |
3.0 |
2.5 |
3.4 |
1.3 |
0.7 |
3.0 |
4.0 |
2.7 |
4.0 |
1.0 |
3.0 |
3.0 |
3.0 |
||||||||||||||||||
|
I–23E |
Existence and frequency of remote monitoring (either automatic or manual) at key spill points, including the end of the canal |
1.0 |
1.3 |
0.0 |
0.0 |
1.8 |
0.3 |
0.0 |
1.0 |
0.0 |
0.7 |
0.0 |
0.0 |
0.0 |
0.0 |
2.5 |
||||||||||||||||||
|
I–23F |
Availability of roads along the canal |
2.0 |
3.3 |
1.3 |
2.5 |
1.0 |
0.3 |
0.3 |
0.5 |
1.0 |
0.3 |
0.0 |
0.0 |
1.0 |
1.0 |
1.0 |
||||||||||||||||||
|
I–24 |
General conditions for the third-level canals |
5.0 |
3.2 |
2.4 |
3.3 |
2.79 |
2.2 |
2 574.8 |
1.6 |
2.2 |
1.8 |
1.4 |
1.0 |
1.0 |
1.4 |
1.2 |
||||||||||||||||||
|
I–24A |
General level of maintenance of the canal floor and canal banks |
1.0 |
2.7 |
2.7 |
3.1 |
2.56 |
2.0 |
1.7 |
2.0 |
2.0 |
3.0 |
2.0 |
1.0 |
1.0 |
1.0 |
1.0 |
||||||||||||||||||
|
I–24B |
General lack of undesired seepage (note: if deliberate conjunctive use is practised, some seepage may be desired) |
1.0 |
3.3 |
2.0 |
4.0 |
3.0 |
2.0 |
3.0 |
2.0 |
2.0 |
3.0 |
1.0 |
1.0 |
2.0 |
2.0 |
3.0 |
||||||||||||||||||
|
I–24C |
Availability of proper equipment and staff to adequately maintain this canal |
2.0 |
3.3 |
2.0 |
2.9 |
3.0 |
2.0 |
1.0 |
1.0 |
2.0 |
1.0 |
1.0 |
1.0 |
0.0 |
1.0 |
0.0 |
||||||||||||||||||
|
I–24D |
Travel time from the maintenance yard to the most distant point along this canal (for crews and maintenance equipment) |
1.0 |
3.3 |
3.3 |
3.5 |
2.6 |
3.0 |
2.7 |
2.0 |
3.0 |
1.0 |
2.0 |
1.0 |
2.0 |
2.0 |
2.0 |
||||||||||||||||||
|
I–25 |
Operation of the third-level canals |
5.0 |
1.9 |
2.2 |
2.8 |
2.59 |
1.6 |
1.5 |
1.1 |
2.0 |
0.5 |
1.8 |
0.0 |
1.6 |
0.5 |
1.9 |
||||||||||||||||||
|
I–25A |
How frequently does the headworks respond to realistic real time feedback from the operators/observers of this canal level? This question deals with a mismatch of orders, and problems associated with wedge storage variations and wave travel times |
2.0 |
1.8 |
1.2 |
2.7 |
2.86 |
1.3 |
1.8 |
0.0 |
3.0 |
0.0 |
2.7 |
0.0 |
2.7 |
0.0 |
2.7 |
||||||||||||||||||
|
I–25B |
Existence and effectiveness of water ordering/delivery procedures to match actual demands. This is different from the previous question, because the previous question dealt with problems that occur AFTER a change has been made |
1.0 |
0.0 |
2.2 |
2.4 |
2.08 |
1.3 |
0.9 |
1.3 |
2.0 |
0.0 |
1.0 |
0.0 |
1.3 |
0.0 |
1.3 |
||||||||||||||||||
|
I–25C |
Clarity and correctness of instructions to operators |
1.0 |
3.1 |
3.6 |
3.1 |
2.46 |
3.6 |
2.2 |
1.3 |
1.0 |
1.3 |
1.3 |
0.0 |
0.0 |
0.0 |
0.0 |
||||||||||||||||||
|
I–25D |
How frequently is the whole length of this canal checked for problems and reported to the office? This means one or more persons physically drive all the sections of the canal |
1.0 |
2.7 |
2.7 |
2.9 |
2.96 |
0.4 |
0.9 |
2.7 |
1.0 |
1.0 |
1.3 |
0.0 |
1.3 |
2.7 |
2.7 |
||||||||||||||||||
|
Budgets, Employees, WUAs |
||||||||||||||||||||||||||||||||||
|
I–26 |
Budgets |
5.0 |
1.3 |
1.9 |
1.3 |
0.4 |
0.8 |
0.9 |
1.52 |
0.9 |
0.3 |
2.6 |
0.4 |
3.6 |
0.0 |
1.6 |
2.0 |
1.0 |
0.0 |
0.0 |
0.8 |
0.4 |
0.8 |
3.0 |
3.4 |
2.0 |
2.2 |
2.0 |
3.2 |
3.0 |
1.0 |
3.0 |
3.4 | |
|
I–26A |
What percentage of the total project (including WUA) O&M is collected as in-kind services, and/or water fees from water users? |
2.0 |
0.0 |
0.0 |
0.0 |
0.0 |
0.0 |
0.2 |
0.96 |
0.0 |
0.7 |
4.0 |
0.0 |
4.0 |
0.0 |
0.0 |
0.0 |
0.0 |
0.0 |
0.0 |
0.0 |
0.0 |
0.0 |
4.0 |
4.0 |
1.0 |
0.5 |
3.0 |
4.0 |
4.0 |
1.0 |
4.0 |
4.0 | |
|
I–26B |
Adequacy of the actual dollars and in-kind services that is available (from all sources) to sustain adequate O&M with the present mode of operation |
2.0 |
2.0 |
2.7 |
1.3 |
0.0 |
2.0 |
2.0 |
0.8 |
2.0 |
0.0 |
1.0 |
1.0 |
3.0 |
0.0 |
2.0 |
3.0 |
2.5 |
0.0 |
0.0 |
2.0 |
1.0 |
2.0 |
3.5 |
3.0 |
3.0 |
3.0 |
2.0 |
4.0 |
3.0 |
1.0 |
3.0 |
4.0 | |
|
I–26C |
Adequacy of spending on modernization of the water delivery operation/ structures (as contrasted to rehabilitation or regular operation) |
1.0 |
2.7 |
4.0 |
4.0 |
2.0 |
0.0 |
0.1 |
2.8 |
0.3 |
0.0 |
3.0 |
0.0 |
4.0 |
0.0 |
4.0 |
4.0 |
0.0 |
0.0 |
0.0 |
0.0 |
0.0 |
0.0 |
0.0 |
3.0 |
2.0 |
4.0 |
0.0 |
0.0 |
1.0 |
1.0 |
1.0 |
1.0 | |
|
|
Indicator Name |
|
|
Malaysia |
Thailand |
Indonesia |
Philip |
Viet Nam |
India |
Nepal |
Pakistan |
Iran |
Mor |
Mali |
DR |
Colombia |
Mexico |
Turkey | ||||||||||||||||
|
|
|
|
|
|
|
|
|
|
|
|
|
|
|
|
|
|
|
|
|
|
|
|
|
|
|
|
|
|
|
| ||||
|
I–27 |
Employees |
9.5 |
2.5 |
2.2 |
2.0 |
1.9 |
1.2 |
1.5 |
0.79 |
2.8 |
2.0 |
2.2 |
2.4 |
2.5 |
1.6 |
1.2 |
2.6 |
1.3 |
1.7 |
1.7 |
1.3 |
1.2 |
2.3 |
1.9 |
2.6 |
1.6 |
2.0 |
2.4 |
2.3 |
1.6 |
3.5 |
2.3 | ||
|
I–27A |
Frequency and adequacy of training of operators and middle managers (not secretaries and drivers). This should include employees at all levels of the distribution system, not only those who work in the office |
1.0 |
3.7 |
2.3 |
2.9 |
3.0 |
2.0 |
2.0 |
1.37 |
2.3 |
2.0 |
2.0 |
2.0 |
3.0 |
2.0 |
2.0 |
4.0 |
1.0 |
2.0 |
1.0 |
1.0 |
2.0 |
2.0 |
2.0 |
3.0 |
2.5 |
1.0 |
1.0 |
2.0 |
1.0 |
2.0 |
3.0 |
3.0 | |
|
I–27B |
Availability of written performance rules |
1.0 |
3.7 |
3.5 |
3.5 |
1.0 |
0.0 |
1.0 |
1.8 |
3.3 |
1.7 |
2.0 |
3.0 |
3.0 |
1.0 |
1.0 |
2.0 |
1.0 |
2.0 |
3.0 |
2.5 |
2.5 |
1.0 |
2.5 |
3.0 |
3.0 |
0.0 |
0.0 |
1.0 |
1.0 |
1.0 |
0.0 |
3.0 | |
|
I–27C |
Power of employees to make decisions |
2.5 |
1.3 |
2.2 |
1.8 |
3.5 |
2.0 |
0.5 |
2.2 |
3.3 |
3.0 |
2.0 |
3.5 |
2.0 |
1.0 |
1.0 |
3.0 |
1.0 |
3.0 |
2.0 |
0.0 |
0.0 |
0.0 |
2.5 |
3.0 |
2.5 |
3.0 |
2.0 |
4.0 |
4.0 |
2.0 |
4.0 |
2.5 | |
|
I–27D |
Ability of the project to dismiss employees with cause |
2.0 |
2.0 |
3.0 |
2.3 |
1.0 |
0.5 |
1.0 |
1.4 |
1.0 |
0.3 |
1.0 |
1.5 |
3.0 |
2.0 |
0.0 |
2.0 |
1.0 |
1.0 |
2.0 |
2.0 |
2.0 |
2.0 |
0.5 |
1.0 |
1.0 |
2.0 |
5.0 |
3.0 |
3.0 |
1.0 |
5.0 |
1.5 | |
|
I–27E |
Rewards for exemplary service |
1.0 |
2.0 |
4.0 |
4.0 |
1.0 |
1.0 |
2.0 |
2.2 |
2.7 |
0.3 |
2.0 |
4.0 |
3.0 |
0.0 |
2.0 |
1.5 |
0.0 |
1.0 |
1.0 |
0.0 |
0.0 |
0.0 |
2.0 |
3.0 |
2.5 |
0.0 |
0.0 |
0.0 |
0.0 |
1.0 |
2.5 |
3.0 | |
|
I–27F |
Relative salary of an operator compared to a day laborer |
2.0 |
3.7 |
0.0 |
0.0 |
1.0 |
1.0 |
3.0 |
1.6 |
4.0 |
3.3 |
4.0 |
1.0 |
2.0 |
3.0 |
2.0 |
3.0 |
3.0 |
1.0 |
1.0 |
2.0 |
2.0 |
4.0 |
0.0 |
4.0 |
1.5 |
1.5 |
2.0 |
2.0 |
2.0 |
4.0 |
2.0 | ||
|
I–28 |
WUAs |
6.5 |
0.7 |
1.2 |
0.5 |
0.9 |
0.9 |
1.2 |
1.42 |
2.9 |
0.7 |
1.8 |
2.0 |
2.9 |
1.2 |
1.2 |
0.8 |
1.3 |
0.6 |
0.3 |
0.5 |
0.5 |
0.5 |
0.0 |
0.0 |
0.0 |
0.0 |
3.4 |
3.7 |
3.6 |
3.6 |
3.7 |
3.4 | |
|
I–28A |
Percentage of all project users who have a functional, formal unit that participates in water distribution |
2.5 |
0.0 |
1.7 |
0.5 |
0.0 |
0.0 |
1.1 |
2.02 |
4.0 |
0.3 |
1.0 |
2.0 |
4.0 |
0.0 |
0.0 |
0.0 |
0.0 |
0.0 |
0.0 |
0.0 |
0.0 |
0.0 |
0.0 |
0.0 |
0.0 |
0.0 |
4.0 |
4.0 |
4.0 |
4.0 |
4.0 |
4.0 | |
|
I–28B |
Actual ability of the strong WUAs to influence real-time water deliveries to the WUA. |
1.0 |
0.7 |
1.5 |
0.8 |
1.0 |
1.0 |
2.0 |
1.0 |
2.3 |
1.7 |
2.0 |
2.0 |
1.0 |
2.7 |
1.0 |
1.0 |
1.0 |
1.0 |
0.0 |
1.0 |
1.0 |
1.0 |
0.0 |
0.0 |
0.0 |
0.0 |
4.0 |
4.0 |
4.0 |
3.5 |
3.5 |
3.0 | |
|
I–28C |
Ability of the WUA to rely on effective outside help for enforcement of its rules |
1.0 |
0.0 |
1.7 |
0.4 |
3.0 |
3.0 |
2.0 |
0.4 |
2.5 |
0.3 |
2.0 |
2.0 |
3.0 |
1.7 |
3.0 |
2.0 |
4.0 |
0.0 |
1.0 |
1.0 |
1.0 |
1.0 |
0.0 |
0.0 |
0.0 |
0.0 |
3.5 |
3.0 |
3.0 |
3.0 |
3.0 |
2.0 | |
|
I–28D |
Legal basis for the WUAs |
1.0 |
1.6 |
0.0 |
0.4 |
1.0 |
1.0 |
1.0 |
1.9 |
2.7 |
1.3 |
2.0 |
2.0 |
3.0 |
2.3 |
3.0 |
2.0 |
3.0 |
2.0 |
1.0 |
1.0 |
1.0 |
1.0 |
0.0 |
0.0 |
0.0 |
0.0 |
3.5 |
3.5 |
3.5 |
3.5 |
3.5 |
3.0 | |
|
I–28E |
Financial strength of WUAs |
1.0 |
2.3 |
0.3 |
0.5 |
1.0 |
1.0 |
0.2 |
1.8 |
1.3 |
0.7 |
3.0 |
2.0 |
2.0 |
1.3 |
0.5 |
0.0 |
0.5 |
1.0 |
0.0 |
0.5 |
0.5 |
0.5 |
0.0 |
0.0 |
0.0 |
0.0 |
1.0 |
3.5 |
3.0 |
3.5 |
4.0 |
3.8 | |
|
I–29 |
Mobility and size of operations staff |
|||||||||||||||||||||||||||||||||
|
Operation staff mobility and efficiency, based on the ratio of operating staff to the number of turnouts |
0.0 |
0.0 |
0.0 |
0.0 |
0.0 |
0.0 |
0.0 |
0.0 |
0.3 |
0.0 |
0.0 |
0.0 |
0.0 |
1.0 |
1.0 |
0.0 |
0.0 |
0.0 |
0.0 |
0.0 |
0.0 |
1.0 |
1.0 |
1.0 |
3.0 |
3.0 |
4.0 |
3.0 |
1.0 |
4.0 |
4.0 | |||
|
I–30 |
Computers for billing and record management |
|||||||||||||||||||||||||||||||||
|
The extent to which computers are used for billing and record management |
1.7 |
1.0 |
1.0 |
1.0 |
1.0 |
1.0 |
3.0 |
0.7 |
0.3 |
3.0 |
0.0 |
2.0 |
0.0 |
0.0 |
0.0 |
0.0 |
2.0 |
0.0 |
0.0 |
0.0 |
0.0 |
2.0 |
1.0 |
2.0 |
0.0 |
1.0 |
1.0 |
0.0 |
0.0 |
4.0 |
3.0 | |||
|
I–31 |
Computers for canal control |
|||||||||||||||||||||||||||||||||
|
The extent to which computers (either central or on-site) are used for canal control |
2.0 |
0.0 |
0.5 |
3.0 |
1.0 |
1.0 |
2.0 |
1.3 |
0.0 |
0.0 |
0.0 |
0.0 |
0.0 |
3.0 |
0.0 |
1.0 |
0.0 |
0.0 |
0.0 |
0.0 |
0.0 |
0.0 |
0.0 |
1.0 |
0.0 |
0.0 |
0.0 |
0.0 |
0.0 |
0.5 |
0.0 | |||
|
INDICATORS THAT WERE NOT PREVIOUSLY COMPUTED |
||||||||||||||||||||||||||||||||||
|
THESE INDICATORS REQUIRE THE INPUT OF VALUES (0-4) IN EACH OF THE BOXES |
||||||||||||||||||||||||||||||||||
|
I–32 |
Ability of the present water delivery service to individual fields, to support pressurized irrigation methods |
3.0 |
0.0 |
0.6 |
2.9 |
1.7 |
1.7 |
0.7 |
0.0 |
0.1 |
0.6 |
0.0 |
1.0 |
0.3 |
0.0 |
0.8 |
0.8 |
0.7 |
0.7 |
0.0 |
0.3 |
0.3 |
0.3 |
1.5 |
1.7 |
2.0 |
3.0 |
2.7 |
3.0 |
2.0 |
2.2 |
2.8 |
0.0 | |
|
I–32A |
Measurement and control of volumes to the field 4 — Excellent volumetric metering and control; 3.5 — Ability to measure flow rates reasonably well, but not volume. Flow is well-controlled; 2.5 — Cannot measure flow, but can control flow rates well; 0 — Cannot control the flow rate, even though it can be measured |
1.0 |
0.0 |
0.0 |
2.8 |
2.5 |
2.5 |
2.0 |
0.0 |
0.3 |
1.0 |
0.0 |
0.0 |
1.0 |
0.0 |
2.5 |
2.5 |
2.0 |
1.0 |
0.0 |
0.0 |
0.0 |
0.0 |
2.0 |
2.0 |
3.5 |
2.0 |
2.0 |
2.5 |
2.0 |
2.5 |
3.0 |
||
|
I–32B |
Flexibility to the field 4 — Arranged delivery, with frequency, rate and duration promised. All can be varied upon request; 3 — Same as 4, but cannot vary the duration; 2 — 2 variables are fixed, but arranged schedule; 0 — Rotation |
1.0 |
0.0 |
0.7 |
3.0 |
0.0 |
0.0 |
0.0 |
0.0 |
0.0 |
0.3 |
0.0 |
1.0 |
0.0 |
0.0 |
0.0 |
0.0 |
0.0 |
0.0 |
0.0 |
0.0 |
0.0 |
0.0 |
0.0 |
0.0 |
0.0 |
4.0 |
3.0 |
3.0 |
2.0 |
2.0 |
2.5 |
||
|
|
Indicator Name |
|
|
Malaysia |
Thailand |
Indonesia |
Philip |
Viet Nam |
India |
Nepal |
Pakistan |
Iran |
Mor |
Mali |
DR |
Colombia |
Mexico |
Turkey | ||||||||||||||||
|
|
|
|
|
|
|
|
|
|
|
|
|
|
|
|
|
|
|
|
|
|
|
|
|
|
|
|
|
|
|
| ||||
|
I–32C |
Reliability to the field 4 — Water always arrives as promised, including the appropriate volume; 3 — A few days of delay occasionally occur, but water is still very reliable in rate and duration; 0 — More than a few days delay |
1.0 |
0.0 |
1.0 |
3.0 |
2.5 |
2.5 |
0.0 |
0.0 |
0.0 |
0.3 |
0.0 |
2.0 |
0.0 |
0.0 |
0.0 |
0.0 |
0.0 |
1.0 |
0.0 |
1.0 |
1.0 |
1.0 |
2.5 |
3.0 |
2.5 |
3.0 |
3.0 |
3.5 |
2.0 |
2.0 |
3.0 |
||
|
I–33 |
Changes required to be able to support pressurized irrigation methods |
2.0 |
0.2 |
0.5 |
1.4 |
2.8 |
2.0 |
0.5 |
0.83 |
1.7 |
1.7 |
0.0 |
2.0 |
1.8 |
0.0 |
1.5 |
2.8 |
0.5 |
1.0 |
0.5 |
1.5 |
1.5 |
1.5 |
1.5 |
2.3 |
1.0 |
2.8 |
1.5 |
3.3 |
1.5 |
1.3 |
3.0 |
0.0 | |
|
I–33A |
Procedures, Management 4 — No changes in water ordering, staff training, or mobility; 3.5 — Improved training, only. The basic procedures/conditions are just fine, they just are not being implemented to their full extent; 3.0 — Minor changes in water ordering, mobility, training, incentive programmes; 2.0 — Major changes in 1 of the above; 1 — Major changes in 2 of the above; 0 — Need to completely revamp or convert almost everything. |
1.0 |
0.3 |
1.0 |
1.0 |
3.0 |
2.0 |
0.0 |
1.1 |
1.0 |
1.0 |
0.0 |
2.0 |
1.0 |
0.0 |
1.0 |
3.0 |
0.0 |
1.0 |
0.0 |
1.0 |
1.0 |
1.0 |
0.5 |
2.5 |
1.0 |
2.5 |
1.0 |
3.5 |
2.0 |
0.5 |
3.5 |
||
|
I–33B |
Hardware 4 — No changes needed; 3.5 — Only need to repair some of the existing structures so that they are workable again.; 3.0 — Improved communications, repair of some existing structures, and a few key new structures (less than US$300/ha needed), OR…very little change to existing, but new structures are needed for water recirculation; 2 — Larger capital expenditures — US$300 to US$600/ha; 1 — Larger capital expenditures needed (up to US$1 500/ha); 0 — Almost complete reworking of the system is needed |
1.0 |
0.0 |
0.0 |
1.8 |
2.5 |
2.0 |
1.0 |
0.4 |
2.3 |
2.3 |
0.0 |
2.0 |
2.5 |
1.0 |
2.0 |
2.5 |
1.0 |
1.0 |
1.0 |
2.0 |
2.0 |
2.0 |
2.5 |
2.0 |
1.0 |
3.0 |
2.0 |
3.0 |
1.0 |
2.0 |
2.5 |
||
|
I–34 |
Sophistication in receiving and using feedback information. This does not need to be automatic. 4 — Continuous feedback and continuous use of information to change inflows, with all key points monitored. Or, minimal feedback is necessary, such as with closed pipe systems; 3 — Feedback several times a day and rapid use (within a few hours) of that information, at major points; 2 — Feedback once/day from key points and appropriate use of information within a day; 1 — Weekly feedback and appropriate usage, or once/day feedback but poor usage of the information; 0 — No meaningful feedback, or else there is a lot of feedback but no usage |
3.0 |
1.5 |
1.6 |
3.0 |
2.0 |
1.0 |
1.0 |
1.0 |
0.7 |
1.0 |
2.0 |
0.5 |
0.0 |
3.0 |
3.0 |
1.0 |
1.0 |
0.0 |
2.0 |
2.0 |
2.0 |
1.0 |
2.0 |
1.0 |
1.0 |
1.0 |
1.5 |
1.5 |
0.0 |
2.5 |
|||
|
SPECIAL INDICATORS THAT DO NOT HAVE A 0–4 RATING SCALE |
||||||||||||||||||||||||||||||||||
|
I–35 |
Turnout density Number of water users downstream of employee-operated turnouts |
15.7 |
21.7 |
4.0 |
4.4 |
45.0 |
83.7 |
94.0 |
15.0 |
150.0 |
25.0 |
100 |
6 000 |
30.0 |
30.0 |
30.0 |
||||||||||||||||||
|
I–36 |
Turnouts/Operator (number of turnouts operated by paid employees)/ (Paid employees) |
0.6 |
3.1 |
1.6 |
17.19 |
1.0 |
0.8 |
3.6 |
0.7 |
0.6 |
0.1 |
0.3 |
0.3 |
0.0 |
0.0 |
0.0 |
||||||||||||||||||
|
I–37 |
Main canal chaos (actual/stated) Overall service by the main canal |
0.9 |
0.9 |
0.9 |
0.96 |
0.7 |
0.6 |
0.75 |
1.10 |
1.00 |
0.6 |
0.83 |
0.28 |
0.48 |
0.42 |
0.42 |
||||||||||||||||||
|
I–38 |
Second level chaos (actual/stated) Overall Service at the most downstream point operated by a paid employee |
0.8 |
1.1 |
1.1 |
0.82 |
0.5 |
0.7 |
0.50 |
1.00 |
0.50 |
0.4 |
0.48 |
0.30 |
0.31 |
0.31 |
0.42 |
||||||||||||||||||
|
I–39 |
Field level chaos (actual/stated) Overall service to the individual ownership units |
0.8 |
0.8 |
1.0 |
0.72 |
0.7 |
1.1 |
0.71 |
0.90 |
1.75 |
0.3 |
0.60 |
0.33 |
0.55 |
0.55 |
0.57 |
||||||||||||||||||
Notes:
• The values shown in this table are true values of indicators (not weighted values of indicators)
• For the data from series 19 (old version), the project name with * , there are no data for indicators No. I-16, I-20 to I-25 and I-35 to I-39.
• For the MARIIS Project; there is no information on third level canals as the information is on main, second and final delivery levels.
1 Senior Water Management Officer, Regional Office for Asia and the Pacific, Food and Agriculture Organization of the United Nations, 30 Phra Athit Road, Bangkok 10200, Thailand.
2The RAP manual and files can be downloaded from the following Website: www.watercontrol.org. It is available in Chinese, English, Indonesian, Russian, Spanish, Thai and Vietnamese.
3The only difference in the definitions of indicators between RAP and the IPTRID indicators is related to rice. Seepage rates for paddy rice (percent of water applied to fields that goes below the root zone of the rice) are estimated in RAP if rice is a crop grown in the project. However, contrary to many studies that combine “seepage” together with “evapotranspiration” for rice, to come up with a combined “consumptive use” or “beneficiary use”, that convention is not used in RAP because such a combination makes it very difficult to separate ET (which cannot be recirculated or reduced) from seepage water (which can be recirculated via wells or drains). Furthermore, such a convention ignores the fact that deep percolation is unavoidable for all crops, not just on paddy rice. Therefore, the convention would apply to all crops, not just paddy rice.
4 A number of technical completion reports of the training workshops organized under FAO’s regional training programme, the programme’s training materials and a RAP manual (in several regional and international languages) are available on FAO’s Website dedicated to the modernization of irrigation systems: www.watercontrol.org.
5 RAP external performance and internal process indicators for a number of representative systems are presented in Appendix 4 (external performance indicators) and Appendix 5 (internal performance indicators). In Appendix 5, the values of the internal indicators of the irrigation systems evaluated with RAP under the World Bank study are also presented, so that Southeast Asian systems can be compared with systems in other regions.
6RAP appraises the level of service as perceived or declared by the systems managers (stated service) and the actual level of service as observed in the field investigations (actual service). The ratio of (actual/stated) service indicators is called a “chaos” indicator. A chaos indicator significantly lower than “1” denotes a management structure with poor interest in and knowledge of its performance.
Jeremy Berkoff
1. Economics, agriculture and rice production in Southeast Asia
1.1 Introduction
Economics has been defined as the “application of reason to choice” in the use of scarce resources (Green, 2003). Two other points can be made by way of introduction (Young, 1996):
The reason for belabouring these perhaps obvious points will, I hope, become clear. I now address in turn issues related to paddy yields, irrigated areas and the modernization of large rice-based irrigation schemes.
1.2 Paddy yields
Yields and incentives. Numerous publications, including those of FAO, the International Food Policy Research Institute (IFPRI), the International Water Management Institute (IWMI) and the World Bank refer to “a yield gap” in paddy cultivation. The documentation for the workshop for instance refers to a gap that has been closed in East Asia but persists in Southeast Asia. But this observation begs a number of important questions. Why has a yield gap persisted in Southeast Asia but been closed in East Asia? Are Southeast Asian farmers, irrigation officials and research scientists so much less competent than those in East Asia? If average yields were to rise by 50 to 100 percent within ten years, what would they do with all that rice? Even if it were possible to enhance yield potential, would this be reflected in actual yields? Perhaps there are valid reasons why yields are what they are. If so, these reasons must be understood before prescribing solutions designed to close the “yield gap”.
Again, this is not to say that physical factors are unimportant: “The maximum yield of a crop is primarily determined by its genetic characteristics and how well the crop is adapted to the prevailing environment” (Doorenhos and Kassam, 1986). If total radiation during the growing season is higher in East Asia than in Southeast Asia then, other things being equal, yields will be higher in East Asia; and if land is irrigated it will yield more than land that is rainfed under similar environmental conditions. Agricultural research and investment expand the range of options open to the individual. Without the green revolution, farmers could not adopt high yielding varieties (HYVs) or apply fertilizer profitably. Again, without education, health, roads etc., farmers would be less well-equipped to exploit their opportunities. But that it is possible to increase rice yields does not necessarily mean that it is always desirable to increase rice yields, nor that in practice rice yields will increase. Yields are the outcome of numerous simultaneous decisions by farmers, consumers, irrigation managers and others, each reacting to the incentives they face in ways that optimize their separate individual welfares. This does not necessarily maximize physical output.
This point is well illustrated by the history of Mbarali, a small paddy scheme in interior Tanzania (Berkoff, 2001b). The Chinese, who built it and operated it for a few years, spared no expense on labour, fertilizer etc. to make it a success. Yields during the first ten years or so were as high as anywhere else in the world and planted area rose steadily to the full potential (about 3 000 ha). But in 1983/84 the project was corporatized, operating subsidies were withdrawn, financial losses became transparent, and yields collapsed since inputs could no longer be afforded. But sales of rice were still guaranteed at fixed prices by the State Milling Corporation (SMC) so the full area was still planted. This guarantee ceased in the early 1990s. Yields then fell further and this time areas also collapsed as markets dried up. Output in 1997/98 was no more than 10 percent of the 1980/81 peak.
What makes Mbarali so intriguing is that environmental (i.e. physical) conditions stayed much the same over the whole period but incentives shifted radically — not once but twice. When the scheme was heavily subsidized and markets were guaranteed, yields in this small isolated scheme in the depths of Africa were as high as anywhere in the world; when subsidies and guarantees were removed, yields fell to a typically low African smallholder average and areas collapsed. The loss in area was replaced by smallholders exploiting return flows so that the total irrigated area remained much the same — it may even have increased. An economist would say that this final outcome has optimized welfare since without subsidies scheme managers and smallholders separately optimize their welfare as they see it. What it certainly has not done is to maximize yields and output.
Trends in paddy yields in Asian countries. Mbarali if of course atypical and differs greatly from the large rice-based systems of Asia. Nevertheless, it shows with clarity the role of incentives. I believe that incentives also help explain why differences in yield persist between countries in Asia and elsewhere: why the “yield gap, which has been closed in East Asia, still persists in Southeast Asia”. Figure 1 summarizes trends in paddy yields in six Asian countries: 7
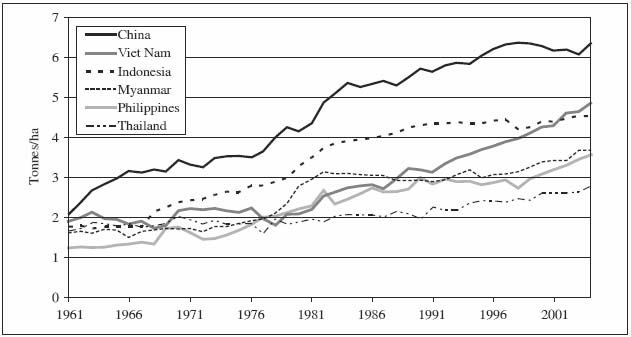
Source: FAOSTAT
Figure 1. Trends in paddy yields six Asian countries, 1961 to 2004 (tonnes/ha)
What is going on? 8 Yield trends are influenced both by physical factors and by public policy. All countries intervene in domestic grain markets in one way or another. Importers often aim for self-sufficiency; exporters may support local producers and/or promote exports. However, I think there is also something else going on and that this “something” applies to grains generally and not just to rice in Asia (Berkoff, 2005).
Grains are relatively easy to store and preserve so that trade is eminently feasible if the necessary institutions exist. But grains are also bulky and of low value so that trading costs provide a level of inherent protection that is greater than for most other commodities. Within national borders, public policy may distort outcomes but it is striking how many countries remain marginally self-sufficient, importing in bad years, exporting in good years. Meanwhile yields continue to rise in most countries and world trade in grains remains some 14 to 15 percent of output despite intermittent panics that regions are shifting into chronic deficit (Indonesia and South Asia in the 1960s, Africa and China more recently).
At least part of the explanation for the stable share of trade in world output lies in feedback loops betweens prices, trading costs and risk. Liberalized markets have become more prevalent over time.9 Prices in liberalized markets are inherently unstable because of climatic, seasonal and trade-related factors. But in countries that are marginal traders (i.e. most developing countries) inherent instability is further aggravated by the divergence between import and export equivalent prices. If trading costs are 10 percent of the final price, the difference between import and export equivalent prices is 20 percent and may be more. If prices switch from import to export equivalence (e.g. because of a bumper crop) then, other things being equal, farm gate prices will fall by 20 percent and — assuming farm costs are 25 percent of gross returns — net returns by 30 percent. Other things may not be equal, but this may still greatly accentuate inherent price instability.
Rich farmers can take risks but most farmers play safe, securing their own needs while limiting exposure to risk and debt. If in a good year prices collapse, adjustments are made the following year — some lose their land, all reduce their exposure by adjusting input levels and hence yields. The sum of such decisions tends to maintain average yields at levels that limit imports. Think of it in an equilibrium context. If India achieved China’s average yields, it would produce unsustainable surpluses, local prices would collapse, and farm incomes would suffer. The government would be pressurized to subsidize exports, as in Europe or the USA, but this could be very costly and world prices would decline further. In effect, this is an accounting issue: substantially higher average yields in India simply cannot work. They must remain below those in China because otherwise local Indian prices would collapse or farm subsidies would become insupportable. Structural traders face prices that are more stable than in marginal traders, being relatively high in importers and relatively low in exporters. Incentives for fertilizer and other cash inputs are lower in structural exporters than structural importers (unless offset, e.g. by price support or fertilizer subsidies) and it is perhaps no coincidence that structural exporters in liberalized markets often obtain relatively low yields (wheat in Australia, rice in Thailand) while structural importers often obtain relatively high yields (e.g. Egypt).
This is primarily a yield not an area issue since, where possible, farmers plant their full farm, especially if farm size is small and labour abundant. Planted areas thus remain similar from year to year and the burden of adjustment falls largely on yields. If yields of some farmers are higher — because they are “good” or “lucky” — those of others must be lower. This not only helps explain differential yields between countries but also between rainfed and irrigated yields. The larger the irrigated area, the lower are rainfed yields so that the overall balance is maintained. This is inequitable since irrigated farmers get subsidies that improve returns to fertilizer use, whereas rainfed farmers get few subsidies and suffer from many other disadvantages.
In other words, yields are a function not just of physical factors (climate, soils, irrigation, farming practices etc.) and of government policies (tariffs, subsidies, trade controls), but also of country conditions — arable land relative to population, the proportion of arable land under irrigation, the level of incomes etc. Africa is poor and has much land so (rainfed) yields are low: if they were significantly higher, surpluses would be unmanageable. Irrigated wheat yields in Pakistan Punjab are lower than in Indian Punjab in part because arable land in Pakistan is almost entirely irrigated whereas irrigation covers a lower share of the total in India. Egypt’s wheat yields are exceptionally high because arable land is limited, water is fully controlled by the High Aswan Dam, and the farmer knows he will always get at least the (high) import equivalent price. Yields in China are high in part because arable land is limited relative to population, and yields must be higher than in, say, India to ensure that marginal self-sufficiency is maintained.
As population and incomes rise, local markets expand until cereals become inferior goods. Yields, and hence production, rise in response to demand and most countries maintain broad self-sufficiency. If yields rise too fast, surpluses emerge, prices collapse and there is a correction in the following year. If yields fail to rise sufficiently, imports mount, price risks decline and farmers respond. This is how markets work, through feedback loops and the hidden hand. Stochastic events lead to imports in bad years and exports in good years— trade is the lubricant that balances demand and supply from year to year and meets the needs of structural importers. But yield differences persist between countries not just because physical conditions and government policies and investments differ. They persist also because no other solution is mathematically feasible without seriously depressing farm incomes or seriously increasing budget deficits.
The international market in cereals. If correct, this rationale helps explain why most countries remain broadly self-sufficient in cereals and why the proportion of cereals traded has remained at some 12 to 16 percent of world output. Indeed, after rising to a peak of almost 16 percent, this share if anything declined after 1980. This might seem counter-intuitive. Intensifying land and water constraints, rising income disparities, differential technical progress, diet diversification and globalization might be expected to reinforce comparative advantage and have led many at various times to anticipate expanding trade in cereals (IFPRI, 1976; Brown, 1998; IFPRI, 2000). Whole industries have relocated for comparable reasons and even in agriculture there has been a huge increase in the volume and value of trade. But this has not so far been the case for cereals. It is sometimes argued that if the World Trade Organization (WTO) negotiations are successful this will stimulate trade in cereals as prices rise (USDA, 2001) and underlying comparative advantage is exposed. But, equally, higher prices could stimulate domestic output and reduce the budgetary costs of self-sufficiency. If so, declining European Union (EU) (and even USA?) exports could be replaced by domestic output rather than imports and the proportion of grains traded might even decline.
Rice is less widely traded than wheat or maize. In 2003, exports accounted for 7 percent of world output compared to 22 percent for wheat and wheat flour equivalent, 14 percent for maize and 14.5 percent for all cereals. The share of wheat that is traded has been fairly stable though it has perhaps fallen slightly since 1980. The share of maize traded rose steeply in the 1960s and 1970s but has fallen markedly since 1980. In contrast the share of rice, after consistently falling below 5 percent, has risen since 1990. Dawe argues that the stabilization of per capita rice production and rising exports have together helped reduce price variability (Dawe, 2002). Evidence from the past — and from wheat and maize with their more mature markets — implies that the rice trade will remain fairly limited and Dawe argues that governments that have struggled to maintain rice self-sufficiency such as the Philippines might be well-advised, and would be taking fewer risks, if they moderated these efforts in future (see below).
How is this reflected in Asian paddy yields? I now return to the points made above relating to Asian paddy yields and interpret them in the light of the above arguments. The points are:
The last point can be readily explained in terms of liberalization and incentives. Indonesia liberalized its rice market after the fall of Sukarno, but in a fairly gradual manner (the National Logistic Agency for Food Distribution (BULOG) continued to actively intervene); Myanmar introduced green revolution technologies in the late 1970s in the context of a controlled economy; China liberalized rice markets dramatically in the context of the 1978/79 reforms; and Viet Nam liberalized rice markets in 1988/89 under the doi moi policies. In contrast, Philippines and Thailand have always had fairly open market economies and even the advent of the green revolution is not reflected in any obvious discontinuity in these two countries. Philippines and Indonesia have been consistent importers; Myanmar and Thailand have been consistent exporters; Viet Nam moved from being a marginal importer to being a consistent exporter in the late 1980s; and China has consistently been a marginal exporter. It is striking that net imports have remained a fairly small proportion of output except in the exporters and with the partial exception of the Philippines.
The inclusion of three major rice exporters is in some ways atypical if most countries remain broadly self-sufficient in cereals. Nevertheless, they illustrate the argument and can be briefly discussed in turn:
China, along with South Asian and many other developing countries, will probably remain marginal traders in cereals. If so, the share of trade in world output will probably remain roughly at the level prevailing since 1980. In principle a few countries no doubt should shift from marginal to structural importers (e.g. Philippines and Indonesia) and a few developed countries should withdraw from exports (e.g. the European Union). According to United States Department of Agriculture (USDA) estimates, if all trade distortions were to be abolished, world prices of wheat would rise by 18 percent, of rice by 10 percent and of other grains by 15 percent, resulting in an annual gain of US$56 billion in world welfare (USDA, 2001). The main benefits would, ironically, accrue to developed countries but they would also go to competitive exporters (in rice especially Myanmar, Thailand and Viet Nam) and to surplus farmers in countries with liberalized market regimes. Whether higher world prices would be associated with a rising proportion of output entering world trade is uncertain for reasons already discussed.
Irrigated and rainfed yields. Systematic data comparing irrigated and rainfed yields on a country basis are not readily available. However, Philippines data are available for 1967–89. Yields in National Irrigation Systems (NIS) were higher than irrigated yields as a whole (which also include communal schemes); and irrigated yields in turn were higher than rainfed yields. These patterns are to be expected. More interesting, perhaps, is that trends between irrigated and rainfed yields were also very comparable, at least between 1967 and 1989. I cannot prove it, but I suspect that similar results would also characterize other countries as the feedback loops described earlier affect all farmers simultaneously, whether they cultivate paddy in NIS, in communal irrigation or under rainfed conditions. Thus, just as average yields have remained relatively constant between countries, so have relative irrigated and rainfed yields within countries.
If this is correct, it could have significant implications for irrigation policy (Berkoff, 2001a, Berkoff, 2001b). If average national yields are in part a result of feedback loops between prices, trading costs and risk, then average yields are in part a consequence of broad country conditions, including the proportion of the arable area that is irrigated. The greater the proportion of arable area that is irrigated, the lower must rainfed yields be if the overall balance is to be maintained. In other words, the decision to invest in new irrigation not only increases yields of benefited farmers, but also tends to depress rainfed yields. The relative impacts on poverty are in part offset by the additional labour opportunities provided and, perhaps, by multiplier effects often attributed to irrigation development. These issues are considered further in Section 2. But, before moving to the evidence to be derived from economic evaluation of irrigation projects something should be said about irrigated areas and approaches to irrigation modernization.
1.3 Irrigated areas
The hidden hand of scarcity. Irrigated areas are influenced primarily by physical water availability. Farmers respond to physical scarcity so as to optimize water’s value to them, both in real time and over the longer-term. Response to scarcity is comparable to response to price, itself a mechanism for allocating (economic) scarcity. Except in fully controlled on-demand systems — the rare exception — water pricing in surface irrigation is impracticable not just because of the administrative and technical problems in huge complex systems with innumerable small farmers and variable rainfall and supply, but also because if they are to play an allocative role, prices would have to be far higher and more variable than is politically feasible under most conditions.10 But water pricing is unnecessary if scarcity impinges directly on farmer decisions as it does in Asian paddy schemes. The stochastic, varying and scarce characteristics of water not only provide continuous real time incentives for efficient use of the water supplied via the irrigation system but also long-term incentives for investment in complementary water sources, notably in re-use and groundwater.
“Scarcity” is typically built into irrigation systems by design so as to limit infrastructural costs and make full use of dry season flows. The nature of scarcity varies seasonally and over time:
Asian paddy-based irrigation systems are thus typically much more efficient than commonly supposed. To repeat, low efficiency in the wet season may not matter. Rainfall and flows in uncontrolled rivers often more than cover irrigation needs. In the absence of a reservoir, water either flows through the fields to the delta and sea or through the channels. Much of it cannot be used. It would be pointless to force farmers to be “efficient” at such times. Why should they be? Indeed, low physical efficiency may correspond to maximum welfare since management is simplified, farmers have fewer problems, and the opportunity cost of water is in any case zero. During the dry season supplies often come largely from reservoir storage and irrigated areas depend on irrigation efficiency. But then dry season irrigation is typically efficient. Peasant farmers fight for water if it is scarce. Anyone who visits such schemes in the dry season sees that — if action is not taken to prevent it — every last drop is taken even if it dries up the river. Quoting average annual levels of “efficiency” can be very misleading.
Furthermore, these are seldom single schemes but a patchwork served by numerous rivers, some controlled others uncontrolled. Over time they adapt to make best use of rainfall, return flows, uncontrolled supplies etc. If topography is favourable and rainfall unreliable, small reservoirs are built (“melons on the vine” in South China, the tank systems of South India and Sri Lanka). If topography is unsuitable or rainfall is relatively high, as in the Philippines, Indonesia and most of mainland Southeast Asia, rivers remain uncontrolled and wet season efficiency is inherently low. One or more larger dams may be built in the context of multipurpose development. As far as irrigation is concerned, the art of reservoir management is to make best use of uncontrolled flows and rainfall, conserving as much water as possible for the dry season. But in large complex systems, with thousands if not hundreds of thousands of small farmers, and dozens if not hundreds of diversion points, this is no easy task. Much of the time there is too much water. During a dry spell, every farmer begins to suffer stress at about the same time, and water must be released and conveyed over long distances to each small farm. By the time it reaches the farm, it may have rained. At a gross level, effective rainfall and uncontrolled flows may appear sufficient, but paddy farmers need reliable water day-to-day. In systems without storage, not even this is possible and wet season irrigation efficiency is necessarily low.
Responding to unpredictable rainfall and river flows in large schemes implies there will be some excess releases. Indeed some waste may be desirable to preserve farmer confidence. Reservoir operations in the dry season are easier because more predictable. But the swing from water abundance to water scarcity is itself a major problem that contributes to farmer indiscipline and physical damage as farmers respond to their short-term predicaments. Nevertheless, this does point to a typical weakness in system management. Many studies, e.g. of Kaudulla in Sri Lanka (HRS, 1985) and Porac-Gomain in the Philippines (HRS, 1989) have shown that relaxed wet season operations at the expense of restricting dry season irrigated areas, along with inequitable distribution of main system supplies, can cause welfare losses. Simulation is a straightforward exercise and can often point to where improved reservoir and main system management can limit avoidable losses and enhance dry season production.
1.4 Irrigation modernization
Introduction. It is often argued that irrigation schemes operate inefficiently, and that the key to improved performance lies in technical innovation (Plusquellec, 2002) or economic water pricing (Rosegrant and Cline, 2003) or in a combination of both (Rosegrant et al., 2002). It has been suggested above that large surface irrigation schemes are in practice more efficient than is commonly supposed and that the role of water pricing has been greatly over-stated. As for technical issues, it is worth quoting from a leading advocate of technical modernization:
“The shortages of food production projected for the 1990s have been averted because of the explosive exploitation of groundwater and the many-fold increase in water-saving application techniques over the last three decades. However, exploitation of aquifers and associated decline in water quality have been occurring in many parts of the developing and developed world, particularly in the semi-arid regions … no further complacency in addressing the long due issue of the poor management practices of the large irrigation systems is acceptable. The failures to understand the links between technical improvements in large surface schemes and required reforms may exacerbate the problem of water scarcity and threaten food security in the future. Development of reliable irrigation in surface systems is crucial to realizing the challenge of irrigation. The magnitude of investments and capacity building in human resources to achieve this goal is likely underestimated.” (Plusquellec, 2002).
Two important points raised by Plusquellec need to be addressed: (i) the potential role of groundwater; and (ii) implications for surface irrigation modernization.
Groundwater. The growth in groundwater use can be attributed to numerous factors including: subsidies, greater access to pump equipment and drilling services, the expansion of electricity distribution systems, and the low price of diesel in some countries. But, as emphasized by Plusquellec, the most important driver has been the security of supply that wells confer on farmers. Private groundwater is on-demand and fully controlled by the end user. Subsidies and externalities distort incentives relative to “economic” outcomes but, this apart, farmers adopt marginal cost pricing — pumping only when the marginal cost to them is justified by their assessment of marginal returns. So long as water tables are accessible, groundwater can offset all the vagaries of rainfall and surface supply. It thus confirms “a secure water supply on farmers who would otherwise have to depend on unreliable or rigid supplies from canal systems” (Plusquellec op cit.; Berkoff, 1990). Crop yields tend to be higher (though still necessarily consistent with the general level of national yields, see above) and groundwater has been the driving force behind diversification into high value crops. Of particular interest is the role of groundwater within irrigation perimeters. It is hard to envisage a more efficient system than one that combines otherwise unusable rainfall with reliable surface supplies and access to groundwater. Such conditions are especially prevalent in the warabandi schemes of Northwest India and Pakistan. But the generally accepted view is that large irrigation schemes in developing countries are inefficient. And though large paddy-based systems differ in many respects from the warabandi systems of Northwest India, these arguments still, to a perhaps lesser degree, apply (see below).
Reasons why irrigation efficiency is higher than commonly supposed have been suggested above. Two further ideas are introduced here: (i) that rainfall especially in semi-arid areas often cannot be profitably used in the absence of irrigation; and (ii) that groundwater provides full on-demand irrigation in otherwise rigidly or even poorly managed systems. No doubt groundwater involves costs that, strictly speaking, would be unnecessary if surface supplies could be provided on demand. But, as discussed above, water supplies cannot readily be provided on demand in large systems and the investment and transactions costs would be much higher than the direct costs of groundwater. Moreover, since it is the farmer who decides on how much to invest and how much to pump, there is a strong case that groundwater use is relatively efficient in economic terms (subject to the impact of subsidies and externalities).
Plusquellec poses the question: how long can groundwater irrigation last? His view is that the writing is on the wall. But is it? Recharge will last indefinitely and, to this extent, groundwater will also last. Indeed, surface irrigation is itself a major source of recharge, adding significantly to natural recharge from rainfall and river seepage. And, though pumping in excess of recharge is an undoubted fact, recharge itself is still a massive quantity. As water tables fall, pumping costs rise and in some cases this brings supply and demand into sustainable balance. In others, vulnerable aquifers may be exhausted or become salinized. If so, farmers become dependent once again on surface supplies, or revert to rainfed farming, or cease farming altogether (move to the towns?). How significant this is depends on the economic context, the pace of structural shifts in the economy, and environmental considerations. Affected farmers will of course suffer but then farmers already suffer from numerous adverse developments, such as low and falling crop prices, declining farm size, environmental degradation, and declining incomes relative to urban incomes. Moreover, irrigated farmers have been heavily subsidized relative to their rainfed counterparts and it is rainfed farmers that have borne the main burden of structural shifts in the economy.
If feedback loops ensure that most countries remain broadly self-sufficient in cereals, the main issue here is whether groundwater can continue to support expansion of the high value crops that have been so critical to agricultural growth or whether surface irrigation also needs to be modernized. FAOSTAT data show that cereal crops still account for 50 to 60 percent of the total harvested area of all crops and high value irrigated fruit and vegetable crops for no more than perhaps 5 or 6 percent. Oilseeds, pulses, tree crops and other non-irrigated commercial crops account for the remainder. Entrepreneurial enterprise typically responds to opportunities as they emerge, notably in urban areas and increasingly for export. The area under such crops is thus ultimately constrained by markets rather than by water supply. If so, there is little doubt that there is adequate groundwater in most countries to support areas under high value crops. The corollary is that the need for modernization of surface irrigation to meet the demands of high value crops can be (greatly) over-stated.
There is a case for introducing responsive modernized systems where: irrigation is a residual activity (Israel? Cyprus?); or accounts for a small share of agriculture (Morocco?); or the benefits of high value exports are great (Northern Mexico?); or water shortages are extreme (the North China Plain?); or farming is typified by rich commercial farmers for whom water is a small part of costs (USA? Spain?). In the long-term, such approaches may become more widely justified. But generalizing the case now for modernization to large, complex smallholder paddy-based irrigation systems that are more efficient than is commonly supposed and that will remain predominantly for cultivation of basic grains, risks major financial waste. Forcing technological innovation has almost invariably failed not because of unreceptive farmers but because of unrealistic expectations and over-optimism of their promoters. Groundwater under the direct control of individual farmers will out-compete modernized surface delivery systems in the large majority of cases for the foreseeable future, and there will be adequate groundwater recharge to more than cover the likely demands for high value crops. Although this will favour those with access to groundwater, this is how markets work and expensive modernization would itself be aimed at irrigated farmers who have been relatively favoured over rainfed farmers in the past.
Surface irrigation. How then should improving surface system management of large-scale Asian paddy-based schemes be approached? The major opportunities in my view lie in conventional low-cost improvements, in reservoir operations and in the predictability and reliability of main system management. Reservoir operations are critical because, under monsoonal conditions, systematic exploitation of effective rainfall and uncontrolled river flows during the dry season can often increase the water retained for the dry season. Predictability and reliability are critical because they facilitate informed farmer responses, with regard to groundwater and other cropping, investment and on-farm decisions.
Under conditions prevailing in large systems, this often implies simplifying operations and management since unrealistic expectations undermine predictability and reliability. For instance, gate operations at the level of the individual farm or watercourse may be impracticable given social and institutional constraints. Alternatives, including proportional division and rotational practices, are often preferable, especially if complemented by local storage and/or private groundwater investments. Such approaches in effect delegate an increased share of the management to the farmer or farmer group, with farmers required to plan operations in response to a predictable supply rather than the scheme manager seeking to satisfy detailed crop water requirements of the farmers. This does not rule out modifying schedules to satisfy the predominant cropping requirements (i.e. some form or arranged demand schedules), nor does it rule out investing in improved structural controls and other measures, for instance in level-top canals or surface level control. But it does imply that such measures should be judged rigorously in terms of the cost, realism and practicality.
Systems differ widely and each must be considered on its merits through the preparation of a practical operational plan. What might be involved has been set out in a number of past publications; notably those of the HRS Wallingford for paddy systems (HRS, 1985, HRS, 1989); of Albinson and Perry for the “Structured Design” especially in non-paddy systems (Albinson and Perry, 2002); and for all types of system by Horst in The Dilemmas of Water Division (Horst, 1998). The way ahead has been eloquently described by these various authors and it is strange that they are referred to so seldom in the large literature on food and the future of irrigation.
2. What economic evaluations of irrigation projects suggest
2.1 Introduction
The most readily available data on the economic performance of irrigation projects are those of the completion, audit and impact assessment reports carried out by the World Bank and Asian Development Bank. The International Water Management Institute (IWMI) and others have also undertaken numerous performance assessments. However, I have limited the data set to World Bank reports, notably the 1994 OED report which covers all irrigation projects funded by the World Bank until that date, and to impact assessment reports of major rice-based projects in Asia (Berkoff, 2001a, Berkoff, 2002). The 1994 OED report is comprehensive and, though it is dated and suffers from deficiencies discussed below, it is a valuable, indeed unique, database. And the impact assessment reports consulted are particularly appropriate for the present workshop.
2.2 Economic rates of return
Table 1 summarizes economic rates of return (ERRs) for World Bank-supported irrigation projects from the 1994 OED review. Of 340 majority irrigation projects approved between 1948 and 1993, 208 had been “evaluated” (that is had a completion, audit or impact report). The table distinguishes between completion and audit reports, compiled by the recipient country and World Bank respectively when the loan closes, and impact assessment reports undertaken by OED typically after about five years of actual operations. Table 1 also includes results for four major Asian paddy-based systems included in a 1996 OED impact report. Table 2 indicates that from appraisal to completion to impact, ERRs successively tended to decline and in the case of projects included in the 1996 report fell to very low levels. Moreover, even at impact, benefits remain uncertain given that project life is typically taken to be 20 to 30 years. Furthermore, the World Bank supported at most 10 percent of irrigation investment in developing countries. As there is a prima facie case that World Bank projects perform above average (they are externally monitored, better financed and less open to implementation delays), Table 1 may overstate performance of all irrigation.
Despite these results, OED concluded that irrigation had generally performed satisfactorily. This is partly because the 1994 Review did not distinguish between impact, completion and audit results, adopting the results of the most recent report available (which explains the question marks in Table 1). However, this is not the full story. The OED review made no attempt to update rates of return of individual projects, simply accepting the results from each report at its disposal. This is not surprising — updating the results in 204 reports with actual data would have been a monumental task. More surprisingly, given that the reports fell over a range of years — the earliest impact assessment date from 1979, the last from 1990, while completion/audit reports dated over a longer period — there was no assessment of impacts of more recent trends. Such an assessment is attempted below. Two main assumptions determine benefits: future crop prices and incremental crop output.
Table 1. ERRs at appraisal, completion and impact assessment: OED review
|
Appraisal |
Completion/Audit |
Impact assessment | ||
|
OED Review: (1994) |
||||
|
Gravity |
103 projects |
21 percent |
14 percent |
? |
|
Pump |
48 projects |
25 percent |
19 percent |
? |
|
Mixed/not-known |
37 projects |
19 percent |
13 percent |
? |
|
Gravity |
13 projects |
19 percent |
? |
12 percent |
|
Pump |
7 projects |
17 percent |
? |
6 percent |
|
OED impact study 1996 |
||||
|
Lam Pao |
Thailand |
26 percent |
12 percent |
10 percent |
|
Maeklong |
Thailand |
35 percent |
8 percent |
4 percent |
|
Kinda |
Myanmar |
21 percent |
14 percent |
7 percent |
|
Dau Tieng |
Viet Nam |
17 percent |
5 percent/7 percent |
4 percent |
Source: OED, 1994 and OED, 1996.
2.3 World grain prices
Table 2 compares World Bank grain price projections made at various times with subsequent actual prices. Despite in most cases adjusting projections down with each successive forecast (but not interestingly for rice) the Bank failed to keep pace with actual declines. In September 1987, for instance, the Bank anticipated a rice price in 2000 of US$315 per tonne, in November 1994 a price of US$332 per tonne and in November 1998 a price of US$296 per tonne, whereas the actual price was US$187 per tonne (all prices at 1990 price levels). If ERRs were to be re-estimated based on actual 2000 prices rather than the earlier OED projections, it is doubtful whether more than a handful of projects would have remained viable. Since 2000, grain prices have stabilized and in the case of wheat recovered from the low levels of the 1990s. Even so, grain prices are well below levels in the 1970s and 1980s let alone levels prior to 1970. More recent World Bank projections (World Bank, 2005a, 2005b) suggest that prices will remain low, at least in the short term.
Table 2. World Bank grain price projections and actual prices: 1990 prices
|
Projections made in: |
Actual prices2 |
||||||||||
|
Sept. 1987 |
November 1994 |
November1998 | |||||||||
|
2000 |
2000 |
2005 |
2000 |
2005 |
2010 |
1970 |
1980 |
1990 |
1995 |
20001 |
|
|
US$/tonne 1990 prices |
|||||||||||
|
Rice: Thai 5 percent |
315 |
332 |
369 |
296 |
277 |
267 |
504 |
571 |
271 |
268 |
209 |
|
Wheat: US HRW |
1553 |
150 |
153 |
120 |
140 |
128 |
219 |
240 |
136 |
148 |
117 |
|
Maize: US-2 Yellow |
143 |
121 |
125 |
102 |
107 |
100 |
233 |
174 |
109 |
103 |
92 |
|
Relative to Projections made in Sept. 1987 |
|||||||||||
|
Rice: Thai 5 percent |
100 |
105 |
117 |
94 |
88 |
85 |
160 |
181 |
86 |
85 |
66 |
|
Wheat: US HRW |
100 |
97 |
99 |
77 |
90 |
83 |
141 |
155 |
87 |
95 |
75 |
|
Maize: US-2 Yellow |
100 |
85 |
87 |
71 |
75 |
70 |
163 |
122 |
76 |
72 |
64 |
1 Actual prices in 2000 at current US$ per tonnes were: rice — 202.4, wheat (US HRW) — 114.1, maize — 88.5.
2 Actual prices in 1990 prices based on G-5 MUV Index: 1985 — 68.61: 1990 — 100, 2000 — 97.3.
3 The 1987 projections were for Canadian wheat (CWRS). Its price is converted to US HRW using a ratio of 1:0.76.
Sources: World Bank Commodity Price Forecasts September 1987, November 1994 and November 1998.
World Bank Commodity Price Data (Pink Sheets) March 2001 and July 2005c.
World Bank Development Report 2004 for MUV Indices.
If the WTO negotiations are successful, there will no doubt be upward pressure on prices. USDA analysis has suggested that if all distortions on trade were removed, then world wheat prices would rise by about 18 percent, rice prices by 10 percent and prices for other grains by 15 percent (USDA, 2001). Others anticipate further declines given past trends, technical change (e.g. the impact of GM crops) and developed country trade policies. A more sophisticated analysis would also need to incorporate shifting exchange rates and dollar values. Whatever the details, it seems most unlikely that grain prices will return to the levels anticipated in the 1980s and 1990s and, if so, all future irrigation projects will need to reflect real price levels that are low in historical terms.11
2.4 Incremental production
The OED Review failed to analyze yields in any detail, concluding only that with production targets would on the whole be met. However, most schemes with impact reports (i.e. for which actual data were available) fell short of production targets and in the case of four Asian projects for which detailed data are available (Table 3) the shortfall in yields was drastic. Again, impact estimates were more pessimistic than those at appraisal, completion and audit.12
Table 3. Yields and production, evaluation and appraisal estimates: four Southeast Asian projects
| “With” yields: tonnes per ha |
“With” production | ||||
|
At appraisal |
At impact assessment | ||||
|
Wet season |
Dry season |
Wet season |
Dry season |
Impact estimate as % of appraisal estimate1 | |
|
Lam Pao: Thailand |
3.8 |
4.0 |
3.0 |
3.0 |
73% |
|
Maeklong: Thailand |
3.5 |
4.2 |
3.9 |
3.9 |
48% |
|
Kinda: Myanmar |
4.0 |
3.6 |
3.6 |
3.1 |
40% |
|
Dau Tieng: Viet Nam |
3.8 |
4.4 |
3.6 |
3.2 |
47% |
|
Weighted Average |
3.8 |
4.1 |
3.5 |
3.3 |
n.a. |
1 It has not been possible to reproduce these production estimates from the area and yield data given in the report.
Source: OED, 1996.
Over-optimism also affects incremental crop areas. As argued above, irrigation is more efficient in economic terms than is commonly supposed since farmers fight for water when it is scarce and little water is wasted when it has value. The corollary is that there is less potential for efficiency increases than often assumed, especially in appraisal reports for rehabilitation and modernization projects that are justified in terms of current “inefficiency”. Optimistic efficiency assumptions are reflected in optimistic projections of irrigated areas (Table 4). Again, completion and audit reports often retain appraisal assumptions but impact reports adjust expectations downwards. For the four Asian projects, areas at impact were no more than 67 percent of appraisal targets and in the Philippines, based on additional actual data, expected increases were even less.
If incremental yields and incremental irrigated areas are both exaggerated, then incremental production will be exaggerated by a cumulative amount. Moreover, incremental irrigated areas and cropping intensities are a good indication of direct water use assumptions. Data on this are available but are more difficult to summarize. Nevertheless in my judgement they also would confirm that efficiency targets often have been over-stated and often by very considerable amounts.
Table 4. Irrigated areas at appraisal, completion/audit and impact assessment
|
No. of schemes |
Average project area: ha |
Average cropped area: ha |
Evaluation as % of appraisal |
Cropping intensity: % | |||||
|
Appraisal |
Evaluation |
Appraisal |
Evaluation |
Proj. area |
Crop. area |
Evaluation |
Appraisal | ||
|
OED Review (1994) |
|||||||||
|
Impact |
20 |
60 592 |
50 743 |
81 938 |
65 975 |
84 |
81 |
135 |
130 |
|
Completion/Audit1 |
111 |
75 830 |
80 368 |
118 856 |
129 829 |
106 |
109 |
169 |
175 |
|
Completion/Audit2 |
51 |
86 230 |
86 991 |
n.a. |
n.a. |
101 |
n.a. |
n.a. |
n.a. |
|
Completion/Audit3 |
6 |
1 827 000 |
1 804 000 |
n.a. |
n.a. |
99 |
n.a. |
n.a. |
n.a. |
|
OED Impact Study 19964 |
|||||||||
|
Lam Pao |
1 |
49 000 |
49 500 |
78 400 |
74 250 |
101 |
95 |
160 |
150 |
|
Maeklong |
1 |
66 000 |
39 500 |
132 000 |
63 200 |
60 |
48 |
200 |
160 |
|
Kinda |
1 |
79 000 |
71 000 |
126 400 |
83 070 |
90 |
66 |
160 |
117 |
|
Dau Tieng |
1 |
72 000 |
45 000 |
162 720 |
112 500 |
63 |
69 |
226 |
250 |
|
Weighted Average |
4 |
86 100 |
51 250 |
12 880 |
83 255 |
77 |
67 |
188 |
162 |
1 Projects for which data are available for expected project and cropped areas at full development (111 schemes).
2 Projects for which data are available only for expected project areas.
3 Six large rehabilitation/modernization-type programmes that in many ways are atypical.
4 It has not been possible to reproduce the production data from the area and yield data provided in the report.
Source: OED, 1994 and OED, 1996.
2.5 The bias in project appraisal
If price and incremental output projections have fallen well short even of the revised estimates included in completion and impact assessment reports, then the true ERR of many, if not most, irrigation projects when recalculated based on actual data would be found to be well below appraisal estimates, and in many cases far below. And this is before allowing for cost over-runs, implementation delays and environmental externalities. Evidence on cost over-runs and implementation delays are provided in the OED report. They are not analyzed here since the emphasis has been on benefits, but adjusting for these alone would reduce ERRs significantly below the original appraisal estimates.
What explains this bias in project appraisal? The answer in my judgement lies primarily in the fact that surface irrigation still lies largely in the public sector and the institutional incentives for going ahead with a project often outweigh any doubts associated with the economic analysis: Surface irrigation is unusual among productive enterprises in that public construction and ownership is rarely questioned. No doubt irrigation is often classified as infrastructure but it is also analogous to industry and it is many years since most governments thought they were qualified to pick winners in industry. Yet governments still pick winners in irrigation. Socialist states had a straightforward planning rationale for investments in basic industry, a rationale that held for decades because accounting practices and prices hid what was really going on. Well that still seems to happen in irrigation, even in countries that in most other respects are characterized by active market economies. Irrigation potential is typically expressed in terms of physical potential — whether the water and land resources are available. If they are, plans are developed to exploit these resources so as to satisfy food requirements, promote regional and rural development, tackle poverty or for some other reason.
These arguments may have merit. Markets are not everything and governments should intervene if a wider development, national security, poverty-alleviation, job-creation and/or rural-urban balance purpose is served (Berkoff, 2003b). But in practice the best projects were built first when the best sites were available, when water was abundant, when groundwater was much less developed, when real grain prices were (much) higher, when international trade was more risky, and when economies were simpler and much less diversified. Irrigation projects in earlier times often served important national objectives and were in many cases undoubtedly justified in economic terms. But many more recent projects have simply not been worthwhile. Just because there is water and land does not mean that they must be exploited, yet this is how many irrigation plans continue to be prepared. And countries that continue to devote large sums to irrigation, as was the case in regard to heavy industry in the Soviet Union before it collapsed, often remain unaware of the true costs and subsidies involved.
Nowhere, even in developed countries, has surface irrigation borne anything like its full direct costs, let alone its opportunity and externality costs. In developed countries, water charges may cover a part of capital costs in addition to operation and management (O&M), but in developing countries agencies struggle to recover O&M costs. Yet surface irrigation supply is a very capital-intensive enterprise and O&M costs typically account for no more than 10 to 20 percent of discounted (present value) costs. The fact that the farmer will not (cannot) pay more than a fraction of project costs is ultimately attributable to the fact that these costs simply cannot be justified by the benefits he receives. If he had to pay full costs, he would be worse off than he was in the first place. If a market for irrigation schemes had been feasible, then the true equilibrium price would have been many times the typical irrigation water charge and much existing irrigation would never have been built. In due course, of course, the subsidies that have been provided are incorporated in the land price in which case it becomes essentially impossible — and indeed inequitable — to recover full costs. Those who benefited from the subsidies in the first place can rest assured that the windfall gains they obtained by selling land will remain theirs.
Moreover, analysts are too often subject to pressures from the client or their bosses — it is far easier to say yes than no. No doubt this applies in other sectors but the economic analysis of irrigation is particularly unstable and uncertain. Incremental production represents the difference between two large hypothetical future flows (production with and production without) that depend on a host of assumptions that cannot be readily validated and for which no one is ultimately accountable. If crop prices, or incremental yields, or irrigation efficiencies, or cropping patterns are adjusted even modestly, the impact on the ERR can be surprisingly large. And who is to say the assumptions are wrong? Moreover, as was shown above, notably for Mbarali, in physical terms, production almost everywhere undoubtedly could increase, often substantially, whether under irrigated or rainfed conditions. Wheat yields in the United Kingdom, for instance, are the highest in the world even though they entirely rainfed. No doubt rainfall is relatively favourable and technologies are advanced. But without the subsidies under the European Union’s Common Agricultural Policy (CAP), how many United Kingdom farmers could make a profit using these same technologies? Not many — wheat would no doubt still be grown if all protection and subsidies were withdrawn and it was profitable relative to the alternatives, but patterns of input use and hence yields would be very different. The same goes for irrigation. Yields and irrigated areas are a reflection of the incentive structures prevailing in the country concerned and the potential for improvements is typically greatly over-stated.
3. Concluding remarks
The paper began with two propositions: first, that the objective function of economic analysis is maximization of human welfare and not the maximization of physical output and second, that incentives matter. Within this framework, Section 1 aimed to throw light on the general evolution of agriculture and rice production. It concluded that average paddy yields in any particular country are at least in part determined by feedback loops between prices, trading costs and risk, and that these processes limit opportunities for augmenting yields. Differential average yields between countries thus reflect real factors, and the assumption that it is possible to close an apparent “yield gap” between East Asia and Southeast Asia is to this extent illusory. With respect to irrigation, it argued that “the hidden hand of scarcity” provides incentives that contribute to levels of water use efficiency in large surface systems in Asia that are much greater than commonly supposed and, again, that the potential for improved irrigation performance in large paddy-based schemes may have been greatly over-stated. Moreover, surface irrigation will invariably be out-competed by groundwater in respect of high value cropping. Such schemes will necessarily continue to be devoted primarily to the production of basic grains. It follows from these arguments that expensive modernization of large irrigation schemes is usually both unnecessary and uneconomic, and risks major financial misallocation. Section 2 summarized evidence drawn from World Bank reports that generally confirm these conclusions, showing that the economic returns from irrigation projects have been greatly overstated taking into account the evidence on actual crop prices and agricultural outcomes.
References
Albinson B., & Perry, C.J. 2002. Fundamentals of smallholder irrigation: the structured system concept. Research Report 58, IWMI, Colombo, Sri Lanka.
Andrus, J.R. 1948. Burmese economic life. The American Council, Institute of Pacific Affairs, Calcutta.
Berkoff D.J.W. 1990. Irrigation management on the Indo-Gangetic plain. World Bank Technical Paper No. 129, Washington, DC.
Berkoff, J. 2001a. Irrigation, grain markets and the poor. Presentation to ICID British Chapter, 21 February.
Berkoff, J. 2001b. World Bank water strategy: some suggestions related to agriculture and irrigation. Mimeo, Draft, 7 May.
Berkoff, J. 2002. Economic evaluation: why is it so often unsatisfactory and does it matter? (with reference to the irrigation sector). Paper presented to the International Consulting Economists’Association (ICEA) on 19 June.
Berkoff, J. 2003a. China: the south-north water transfer project — is it justified? Water Policy 5:1–28.
Berkoff, J. 2003b. Prospects for irrigated agriculture: has the international consensus got it right? Paper presented at the Alternative Water Forum held at Bradford University, 1–2 May.
Berkoff, J. 2005. Memo addressed to MNA region of the World Bank, 19 September 2005, mimeo.
Brown, L. 1998. China’s water shortage could shake world food security. World Watch, July/August.
Dawe D. 2002. The changing structure of the world rice market, 1950-2000. Food Policy, Vol. 27(4): 355–370.
Doorenhos J., & Kassam, A.H. 1986. Yield response to water. FAO Irrigation and Drainage Paper 33, Rome.
Green, C. 2003. Handbook of water economics: principles and practice. Chichester, John Wiley & Sons.
Horst, Lucas. 1998. The dilemmas of water division, considerations and criteria for irrigation system design. 138 pp., International Water Management Institute.
HRS. 1985. Irrigation water management at Kaudulla, Sri Lanka. Hydraulic Research Station, Wallingford, Report No OD 70, July.
HRS. 1989. Performance assessment of the Porac River irrigation system. Hydraulic Research Station, Wallingford, Asian Regional Symposium on the Modernization and Rehabilitation of Irrigation and Drainage Schemes, Development Academy of The Philippines, 13–15 February.
IFPRI. 1976. Meeting food needs in the developing world: the location and magnitude of the task in the next decade. Washington, DC. Research report No. 1, February.
MMP/HTS. 1971. Kali Progo Basin study. Consultancy Study undertaken by Hunting Technical Services and Sir M. MacDonald & Partners, under assignment by ODA, October.
Molle, F. 2004. Technical and institutional responses to basin closure in the Chao Phraya River Basin, Thailand. Water International 29(1): 70–80.
NIA. Undated. Performance evaluation of national irrigation systems. NIA databases (mimeo).
OED. 1994. A review of World Bank experience in irrigation. Report No. 13676, 2 Vols. Operations Evaluation Department, Washington, DC.
OED. 1996. Irrigation O&M and system performance in Southeast Asia: an OED impact study. Report No. 15824, Operations Evaluation Department, Washington, DC.
Plusquellec, H. 2002. Is the daunting challenge of irrigation achievable? Irrigation and Drainage 51: 185—198.
Rosegrant M.W, Ximing Cai & Cline, S.A. 2002. World water and food to 2025: dealing with scarcity. Washington, DC.
Rosegrant M.W. & Cline, S. 2003. The politics and economics of water pricing in developing countries (mimeo).
Third World Water Forum. 2003. Water, food and environment. Session Report, Kyoto, 20 March.
USDA. 2001. Agricultural policy reform in the WTO — the road ahead. Market and Trade Economics Division, Economic Research Service, U.S. Department of Agriculture, Agricultural Economic Report No. 802. Ed. Mary E. Burfisher.
Van Hofwegen, P. & Svendsen, M. 2000. A vision of water for food and rural development. Prepared for the World Water Forum, Paris.
World Bank. 1983. Burma: irrigation sector review. Report No. 4644-BA, South Asia Projects Department, Washington, DC.
World Bank. 1987. Commodity price forecasts. September, Washington, DC.
World Bank. 1992. Philippines: irrigated agriculture sector review. Report No. 9848-PH, 2 Volumes, World Bank, Washington, DC.
World Bank.1994. Commodity price forecasts. November, Washington, DC.
World Bank. 1998. Commodity price forecasts. November, Washingon, DC.
World Bank. 2001. Commodity price data: (Pink Sheets), March, Washington, DC.
World Bank. 2005c. Commodity price data: (Pink Sheets), July, Washington, DC.
World Bank. 2005a. 2004 World development report. Washington, DC.
World Bank. 2005b. Prospects for the Global Economy: 2006, Washington, DC.
World Water Commission. 2000. World water vision — a water secure world: vision for water, life, and the environment. Report of the World Water Commission, World Water Council.
Young, R.A. 1996. Water economics. In Mays L. (ed.) Handbook of Water Resources. New York, McGraw-Hill.
7Cambodia, Lao PDR and Malaysia — represented at the regional workshop — are smaller than these countries in terms of population, irrigated area and rice output. They also have other characteristics that in different ways set them apart. They have therefore been excluded from this discussion.
8 Since this paper was written, there has been a boom in cereal prices in part because of the expansion in production of grains for fuel. Moreover, concerns about global warming have risen. These factors imply that some statements in the paper need modification although the mechanisms described are still thought to be valid.
9 In earlier periods, farmers were often taxed to fund general development or industrial growth. But with falling prices and structural shifts such approaches have declined. Exchange rates may still be overvalued and other distortions persist but these are as likely to protect agriculture as to tax it. Thus importers often manage trade or impose tariffs so as to protect farmers and promote self-sufficiency, while exporters subsidize exports through price and/or income support (as in Europe) or by irrigation (as in many countries). But subsidies are costly and, on balance, liberalized markets in poor countries have played an increasingly important role in bringing supply and demand into balance.
10 This contrasts strongly with reticulated urban water systems, which are — at least in principle — usually designed for water on-demand. Under such conditions, water pricing is often the critical variable if water use is to be constrained.
11 The pressure on prices as a result of cultivation of grains for fuel purposes and other factors imply that this paragraph needs some modification.
12 Furthermore, OED failed in either report to discuss issues related to incremental production, which is the key to estimating benefits. If average national yields rise faster than expected, then incremental production will be less even if with yield targets are met. This can be illustrated well by data from the Philippines though these data have been excluded for lack of space.
Shahbaz Khan13
Abstract
Irrigated agriculture makes up over 70 percent of Australia’s consumptive water use. With the water resources in irrigation areas being close to fully allocated, or even over-allocated in some catchments, there is an increased competition for water. In the Murray Darling Basin it is hardly possible to withdraw more water from existing resources. It is generally accepted that there will be less water available for irrigated agriculture in the future and the only way to provide enough water for irrigation will be to use the available resource more efficiently at both farm and catchment scales. Water for the environment or new irrigation developments need to be resourced through irrigation water savings at the farm and system levels. However, water savings from one part of the system may lead to higher water use in another part of the system and the overall improvement may be negligible.
Some measures that may improve the water productivity in agriculture are canal lining, irrigation scheduling, high-tech irrigation technologies, improved cropping patterns and conversion to crops with higher economic returns. The key to achieving “real” and substantial water savings lies in the assessment and hydrologic ranking of water-saving options in a “whole of the system” context. This paper describes results of a major water use efficiency study in the Murrumbidgee Valley, Australia. Benefits of a systems approach are summarized through a hydrologic and economic evaluation of water-saving interventions at the field, irrigation area and catchment levels. Supply and demand theory is used to explore how to internalize the social costs created by irrigation activity and saving of associated losses that burden the local and regional environment.
A market-based approach which utilizes a “water leasing” and “preferential right to access saved water” is argued to take advantage of the market mechanisms for the preservation of the environment. Private-public investment for “efficient” water supplies which can account for third party impacts needs to be established to promote investment in water-saving technologies. This will help provide secure “saved water supplies” for “water efficient irrigation and the environment” especially during periods of drought because of real water savings from “fixed system losses”.
1. Introduction
As elsewhere in the world, Australia’s irrigation systems suffer from problems associated with losses in storage and conveyance, on-farm losses and variable water use efficiency. In the Murray Darling Basin (MDB) it is widely accepted that 25 percent of diversions for irrigation are lost during conveyance in rivers, 15 percent are lost from canals and 24 percent lost on farm, meaning that only 36 percent of irrigation water is actually delivered to plants. Such losses are not atypical across the world (Table 1). The data in Table 1 for the Murrumbidgee Irrigation Area (MIA) do not include river conveyance losses and indicate on-farm losses better than the overall MDB average (Khan et al., 2004a). However, given that the world will need to feed 1.5 to 2 billion extra people by 2025, there has to be scope to reduce water conveyance losses and increase irrigation efficiency both in Australia and internationally.
In recent years, there has been a growing concern in Australia regarding the impact that major diversions of water for irrigation are having on the environment. This is creating further “economic” competition for water along with demands from urban and industrial users. Given that rural water users (predominantly irrigation) account for over 70 percent of Australia’s total water use, a figure similar to that in most Southeast Asian
Table 1. Surface water irrigation efficiency in three irrigation systems
|
Key indicators |
Liuyuankou, China |
Rechna Doab, Pakistan |
MIA, Australia |
|
Area (ha) |
40 724 |
2 970 000 |
156 605 |
|
Losses from supply system % |
35 |
41 |
12 |
|
Field losses % |
18 |
15 |
11 |
|
Net surface water available to crops (%) |
46 |
32 |
77 |
countries, and given increasing physical scarcity of the resource because of climate change and other environmental factors it is not surprising that pressure is increasing on irrigators to increase water use efficiency and to achieve “true water savings” by conserving water otherwise lost through non-beneficial evaporation or seepage to saline aquifers.
The key to achieving “real” and substantial water savings lies in the technical, economic and institutional assessment of water-saving options in a “whole of the system” context.
Figure 1 shows the water cycle in an irrigated catchment at different spatial scales. Key intervention points for improving the sustainability of irrigation systems and achieving water savings are shown with numbers in circles. These intervention points are set out below:
This paper describes technical, economic and institutional aspects of water use efficiency studies focusing on intervention points 1 to 5 (Figure 1) for catchments in Australia. Modelling approaches aimed at extrapolating the impact of water savings on the basin and country level food security and water balance are provided given by Khan et al. (2005c and d).
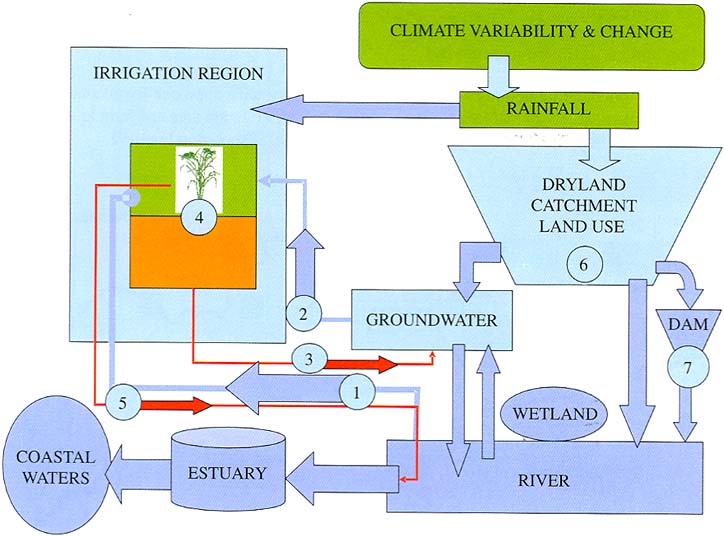
Figure 1. Schematic of irrigated catchments with key points of intervention in circles
2. Technical issues
It is imperative to save water to achieve higher productivity per unit of water consumed and to provide water for the environment. However, lower commodity prices do not allow investment in higher technologies because of government subsidies and international market competition.
Technical options for more efficient use of available water supply for irrigation include:
The relative economic and environmental merits of adopting these alternative water-saving options on the overall water saving and water productivity at the irrigation system or catchment levels are largely unknown because of a lack of integration of existing data sets; therefore it is imperative to start identifying and filling in vital gaps. As part of the Pratt Water Study (Pratt Water Group, 2005) in the Murrumbidgee Catchment, a targeted data-gathering, modelling and integration approach (Khan et al., 2005 a and b) was adopted to evaluate alternative technologies for reducing over 300 GL on-farm and off-farm losses within the Coleambally and the Murrumbidgee Irrigation Areas.
a. Systems approach
Water-saving options at the catchment level
To identify “true” water-saving options it is important to adopt a systems approach for accounting all surface water and groundwater use, losses and interactions at the catchment, irrigation area and farm levels. An example of a system’s water balance for the Murrumbidgee Catchment level is shown in Figure 2.
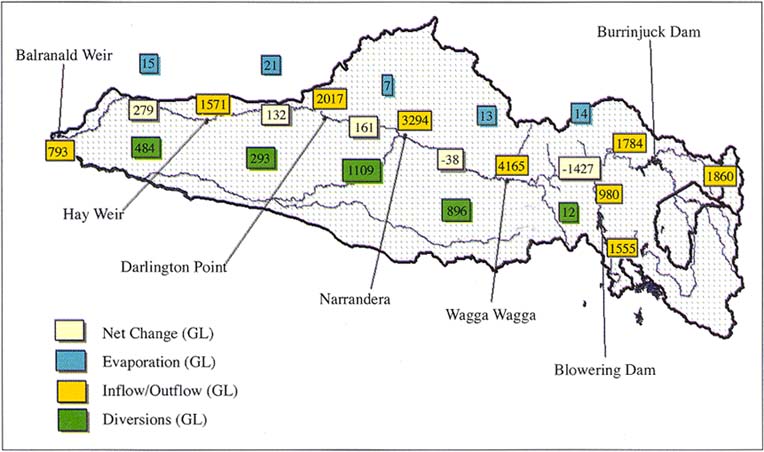
Figure 2. Systems water balance at the Murrumbidgee Catchment level
This analysis has shown unaccounted losses of greater than 300 GL (1 GL = 1 MCM) in some of the river reaches (Khan et al., 2004c) which could lead to real water savings and better environmental management by investments in catchment management infrastructure.
Water-saving options at the irrigation area level
A similar systems approach at the irrigation area level provides indications of water savings at the whole of the irrigation area level. An irrigation system’s water balance for the Coleambally Irrigation Area (CIA) is given in Figure 3, which provides a possible water use efficiency scenario for the CIA (using 2000 to 2001 water allocations). The water use efficiency at various points within the system is expressed in terms of water delivered versus the water supplied and net water use through evapotranspiration and the tonnes/GL of produce. Key water use efficiency indicators for the CIA show that irrigation efficiency in terms of root zone storage to the water diverted from the source is 70 percent. Unless there is an investment in irrigation infrastructure to improve measuring, monitoring and reducing losses this efficiency indicator will remain low. The overall water use efficiency of the CIA is 77 percent because of capillary water use by the crops. In terms of production efficiency the CIA is 343 tonnes/GL. Further analysis of the whole of the CIA water savings shows (Khan et al., 2004c) that it is possible to increase economic water use efficiency from $A91 000/GL to $A97 500/GL and total water use efficiency from 77 percent to 84 percent under the current cropping and irrigation regimes.
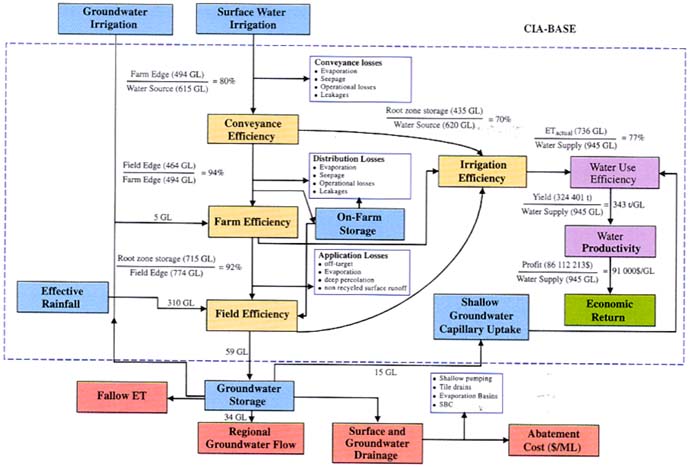
Figure 3. Base case water use efficiency of the CIA
b. Targeted water savings
Increasing on-farm water productivity
The current state of water use and water productivity in the Murrumbidgee Irrigation Area (MIA) is depicted by Table 2 and this provides an overview of the net crop water requirements (NCWR), current irrigation levels and yields in the MIA. In all cases (except for Lucerne) NCWR are well below the maximum reported irrigation application levels. There are major differences between minimum and maximum crop yields, as well as overall amounts of water consumed and the net crop water requirements. This data clearly illustrates that there is a potential to increase farm profitability at a range of levels which include:
Considering a range of soil, water and groundwater conditions Khan et al. (2004b) concluded that on-farm irrigation technology conversions can provide potential water savings ranging from 0.1 to 2.2 ML/ha for different broad acre crops (Figure 3), for example, 1.0 to 2.0 ML/ha for flood to sprinkler and 2.0 to 3.0 ML/ha from flood to drip irrigation for citrus, 1.0 to 1.5 ML/ha from flood to sprinkler and up to 4.0 ML/ha from flood to drip irrigation for vineyards, and 0.5 to 1.0 ML/ha for vegetables. Modelling simulations show water-saving potential of 7 percent for maize, 15 percent for soybean, 17 percent for wheat, 35 percent for barley, 17 percent for sunflower and 38 percent for faba bean, if on-farm surface irrigation methods can be replaced with pressurized irrigation systems.
Based on recent work by Khan et al. (2004b) the potential savings for converting from good surface water to pressurized irrigation systems (travelling irrigators or centre pivots or equivalent) are shown in Table 2.
Table 2. Net crop water requirements (NCWR), reported water use and yields in the MIA (2000/2001 reported crop areas are used)
|
Crop |
Crop area (ha) |
NCWR |
Reported irrigation‡ (ML/ha) |
Reported yield (t/ha) | |||||
|
(ML) |
(ML/ha) |
Median |
Low |
High |
Median |
Low |
High |
||
|
Rice |
46 120 |
506 562 |
11.0 |
14.0 |
12.0 |
16.0 |
9.5 |
6.0 |
12.0 |
|
Wheat |
39 215 |
111 835 |
2.9 |
2.0 |
1.0 |
3.0 |
5.0 |
3.0 |
7.0 |
|
Oats |
2 896 |
7 512 |
2.6 |
2.0 |
1.0 |
3.0 |
3.5 |
2.0 |
6.0 |
|
Barley |
3 034 |
8 615 |
2.8 |
2.0 |
1.0 |
3.0 |
5.0 |
2.5 |
7.0 |
|
Maize |
2 924 |
18 813 |
6.4 |
8.5 |
6.0 |
12.0 |
9.5 |
6.0 |
15.0 |
|
Canola |
2 685 |
4 643 |
1.7 |
2.5 |
1.0 |
4.0 |
2.5 |
1.8 |
3.0 |
|
Soybean |
2 881 |
18 383 |
6.4 |
8.0 |
6.0 |
9.0 |
2.6 |
1.5 |
3.8 |
|
Summer Pasture |
3 929 |
45 154 |
11.5 |
7.5 |
7.5 |
8.0 |
|||
|
Winter Pasture |
24 184 |
50 403 |
2.1 |
5.5 |
5.5 |
6.0 |
|||
|
Lucerne (Uncut) |
2 468 |
43 291 |
17.5 |
10.0 |
7.0 |
14.0 |
7.3 |
5.0 |
15.0 |
|
Vines |
13 635 |
77 508 |
5.7 |
5.0 |
3.0 |
7.5 |
15.0 |
9.0 |
25.0 |
|
Citrus |
8 700 |
68 861 |
7.9 |
7.0 |
4.5 |
10.0 |
38.0 |
20.0 |
60.0 |
|
Stone Fruit |
934 |
9 071 |
9.7 |
9.0 |
7.5 |
12.0 |
18.0 |
15.0 |
20.0 |
|
Winter Veg.* |
1 500 |
921 |
0.6 |
5.0 |
4.0 |
6.0 |
60.0 |
50.0 |
70.0 |
|
Summer Veg.** |
1 500 |
8 906 |
5.9 |
7.0 |
6.0 |
10.0 |
90.0 |
60.0 |
120.0 |
|
Lucerne (Cut) |
0 |
0 |
|||||||
|
Total |
156 605 |
980 477‡ |
|||||||
‡ Reported gross diversions for 2000/01 are 1 048 000 ML and on-farm deliveries are 857 000 ML.
* Irrigation requirement and yield is for onion. For salad crops (lettuce) the irrigation requirement is from 2.0 to 4.0 and yield is from 30.0 to 40. ** Irrigation requirement and yield is for tomato. For melons the irrigation requirement is from 4.0 to 7.0 and yield is from 30.0 to 40.0.
† Reported irrigations levels are subject to adjustment for measurement error — e.g. 14 percent accepted underestimation by the Dethridge wheels.
Sources of information: NSW Dept. of Ag. (2003), Beecher et al. (1995), MDBC (1997) , MIA and D LWMP WG (1997).
Table 3. Water use and savings (ML/ha) for selected crops under different irrigation technologies
|
Irrigation method ML/ha |
Surface |
Sprinkler |
Water savings | ||||||
|
High |
Low |
Average |
High |
Low |
Average |
High |
Low |
Average | |
|
Maize |
10.6 |
4.3 |
8.3 |
9.2 |
4.0 |
7.7 |
1.4 |
0.3 |
0.6 |
|
Soybean |
6.6 |
3.6 |
5.4 |
5.6 |
3.2 |
4.6 |
1.0 |
0.4 |
0.8 |
|
Wheat |
4.2 |
0.5 |
2.4 |
2.8 |
0.5 |
2.0 |
1.4 |
0.0 |
0.4 |
|
Barley |
4.3 |
0.7 |
1.7 |
2.4 |
0.7 |
1.1 |
1.9 |
0.0 |
0.6 |
|
Sunflower |
7.0 |
3.5 |
4.6 |
4.8 |
3.1 |
3.8 |
2.2 |
0.4 |
0.8 |
|
Faba beans |
4.9 |
1.5 |
3.2 |
3.3 |
1.4 |
2.0 |
1.6 |
0.1 |
1.2 |
Measuring and managing water losses from supply channels
The study used a combination of geophysics and in situ measurement methods aimed at identifying seepage hotspots and the extent of overall water losses. In the Murrumbidgee catchment, seepage measurements were made over 700 km of channels. Both sides of the selected channels were surveyed using EM31 metres. These metres use electromagnetic induction to measure the average electrical conductivity of the soil from the surface to a depth of six metres. This average reading is known as “apparent conductivity”. This EM method provided a quick way of gathering a large amount of data without any ground intrusion, but is susceptible to interference from electrical or magnetic interference. Low conductivities indicate potential seepage sites.
Once the EM31 surveys were completed, maps were prepared from the EM imaging data using GPS based locations. These maps helped to identify the parts of channels where higher seepage rates were occurring. Doppler flow metres were then used to measure inflow and outflow of hotspot reaches of channels to cross-validate losses from channels. At the high seepage sites Idaho seepage metres were used to quantify seepage rates. In this method a cylindrical bell is pushed into the bottom of side of a channel and is connected by tubing to a reservoir and gauge located on the water surface. As water seeps from the bell, the change in pressure in the reservoir is measured by the gauge.
EM31, Idaho seepage metre and groundwater lithology and quality data from a MODFLOW model were used to “train” an artificial neural network (ANN) model (Khan et al., 2004c). Once trained, the network can be used for predicting seepage rates in channels.
Study of on-farm conveyance losses on nine farms shows that seepage losses vary from 1 to 4 percent of the total water supplied which can be more than 60 ML/yr (equivalent to 4 percent loss) for a studied farm.
Seepage losses computed for over 700 km length of channels in the Murrumbidgee Irrigation Area show that seepage losses are over 40 000 ML/yr and evaporation losses are over 12 500 ML/yr. The total losses in given channel reaches vary widely and can be from 1 to 30 percent of the water supplies and from 0.2 to 9 percent per km length.
Canal lining and piping options were considered for saving conveyance losses from channels.
Ladder of water savings
The possible on- and off-farm water savings can be summarized in the form of steps of a ladder of increasing on-farm and off-farm water savings (Figure 4) and water benefits. It is important to recognize that some steps are a prerequisite for the next water use efficiency level. For example, to realize on-farm water savings it is crucial to implement soil and groundwater and flow monitoring programmes, to ensure irrigation levels are being matched with the crop water requirement, at the same time considering conversion to high-tech irrigation. Similarly, for realizing off-farm water-saving options it is vital to know how much water is being delivered in space and time before piping/lining of channels. It is important to reduce the conveyance difference and narrow the wide gap between the gross diversions from rivers to deliveries on-farm by installing state-ofthe-art monitoring and delivery systems as a part of the modern irrigation infrastructure.
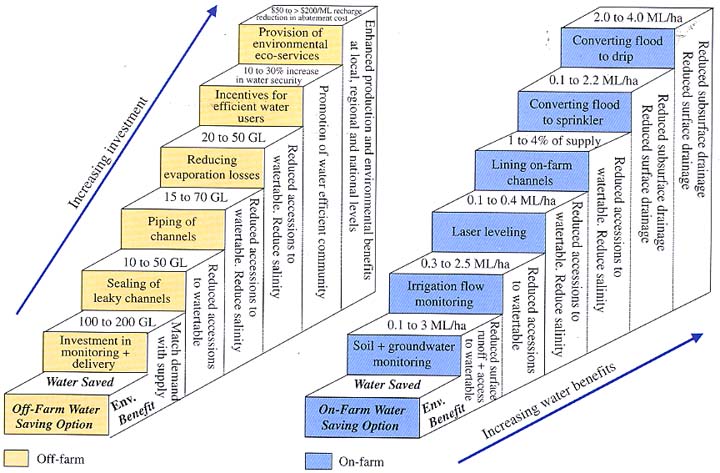
Figure 4. Ladder of possible water savings in an irrigation area
3. Economic issues
To target on-farm and regional water savings it is hypothesized that the marginal costs for saving irrigation water will increase with the volume of water saved and there is a possibility to formulate irrigation water-saving cost curves for traditional or alternative different irrigation technologies to help shift these cost curves to lower costs as illustrated in Figure 5. Figure 5 shows a simplified schematic of the marginal costs (MC) and benefits (MB) for the current cropping systems. X represents the current viable levels of water savings that can be shifted to the right through the low-cost alternative technology.
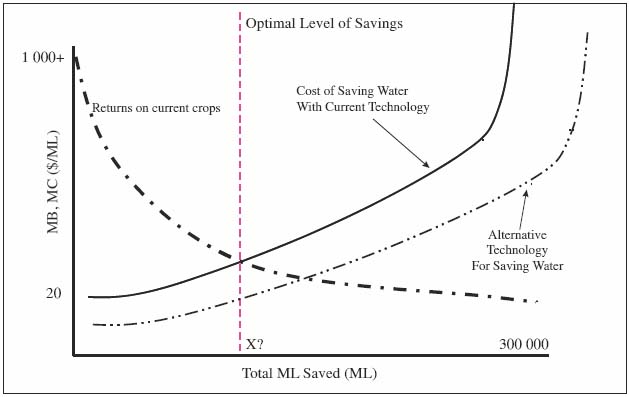
Figure 5. Cost–benefit curves for water-saving technologies
The economic analysis of on-farm conversions to save a ML of water increases with the total savings is shown in Figure 6. Typical capital costs to save a ML of water vary from less than $A2000/ML to over $A7000/ML depending on soil type, crop and irrigation technologies used.
Break-even analysis (not presented here) shows that the break-even years for conversion from flood to the pressurized irrigation systems are too long (greater than 15 years). There is a need to reduce the break-even period by considering leasing of water for the environment from farmers at around $A300/ML for a fixed period of five to ten years after which the water can be returned back to the farmer and the government can then lease the next lot of water from another group of farmers. This will help remove barriers to the adoption of irrigation technologies by moving farmers and irrigation area to the next step of the irrigation efficiency ladder, reducing local and regional environmental impacts and securing water for better ecological futures.
The economic analysis of alternative water-saving technologies for channels shows that the cost of saving a ML of water increases with the total savings, as shown in Figure 7. Typical capital costs to save 1 ML of water vary from less than $A500/ML to over $A4000/ML depending on losses per unit length and the seepage reduction method used.
In Australia there is wide feeling that water savings that cost more than $A1000/ML are not viable. The break-even analysis of different channel lining materials by Khan et al (2004b) shows that the price of saved water on an annual basis needs to be from $A30 to over $A200 to break-even within the design life of the project. This investment can be achieved in two ways: either by using the saved water on higher value crops or by including saving costs as part of the overall water supply charges with a proportionate cost sharing arrangement. For example, water delivery charges will increase by $A5 to $A15/ML/season to provide water more efficiently (the current water delivery charges are less than $A20/ML/season). This will reduce water logging and salinity abatement costs also (current estimate for water logging and salinity abatement are $A10 to $A200/ML or recharge/yr). The proportional cost to be paid by the farmer may be less than discussed here if it can be shared with the wider environmental beneficiaries. There is a need to promote a water efficient culture through a “preferential rights of access” by providing better level of security to farmers and irrigation investing in water-saving technologies.
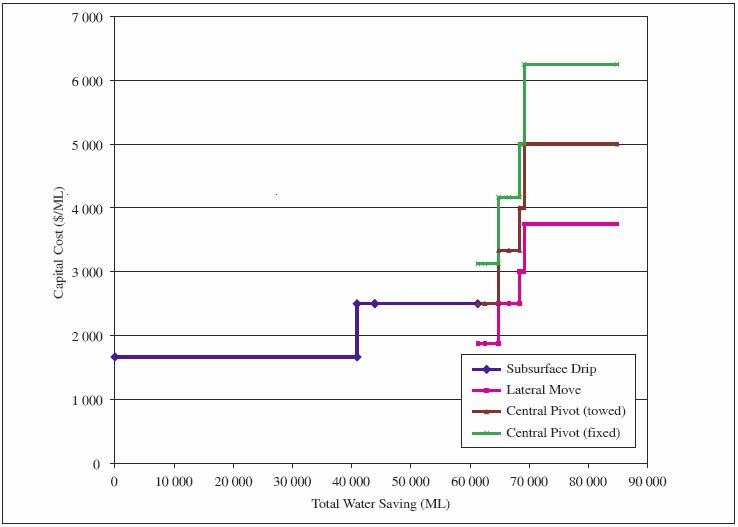
Figure 6. Capital investment and total water savings by high-tech irrigation technologies in MIA
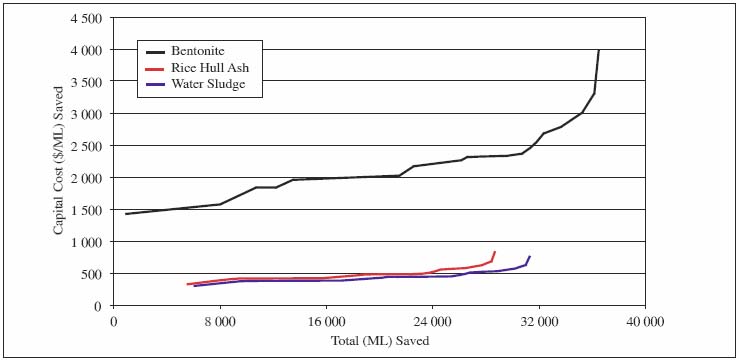
Figure 7. Capital investment curves for saving seepage losses
4. Institutional issues
Who saves and who owns the water losses
One of the key impediments to achieving real water savings is the issue of ownership of losses and how to reallocate on-farm and off-farm water savings. In New South Wales, conveyance losses are collectively “owned” by the farmers through the privatized irrigation companies through a conveyance allowance. For example, there is a provision in the Murrumbidgee Water Sharing Plan (Department of Land and Water Conservation, 2003) for a conveyance access component for the Murrumbidgee Irrigation Company up to 243 000 ML to make up for the transmission loss in water accounting (Clauses 26 and 40). Similarly, farmers are given water entitlements irrespective of the actual crop water use. This water entitlement is used to irrigate crops and results in evaporation and deep percolation losses. If farmers invest in new technologies to save water losses they may like to increase their area of production or sell the saved water in the open market.
Institutional complications are caused by the common pool nature of the irrigation supply infrastructure and deep drainage below the root zone. This may lead to lack of collective action. Managing irrigation systems requires coordinating actions of many users sharing the same resources of water and irrigation infrastructure. Users receiving the direct benefit are likely to ignore the effect of their actions on the common pool when pursuing their self-interest, therefore this “tragedy of the commons” is likely to place environmental sustainability of surface and groundwater and maintenance of irrigation infrastructure resources at risk.
To explore the reasons for the lack of action by farmers and irrigation companies reference is made to the long break-even years (greater than 15 years) to achieve net profit from investment for conversion from flood to the pressurized irrigation systems in the case of the Murrumbidgee Catchment. Farmers also have a lack of interest in permanently giving up their water entitlements in exchange for capital incentives for new technology because of the uncertainty arising from current and proposed water reforms.
There may be a possibility to reduce the break-even period by considering private-public investment models for “leasing of water” for the environment from farmers at around $A300/ML for a fixed period of five to ten years after which the water can be returned back to the “owner” and government can then lease the next lot of water from another group of farmers. This will help remove barriers to the adoption of irrigation technologies by moving farmers and irrigation area to the next step of the irrigation efficiency ladder, reducing local and regional environmental impacts and securing water for better ecological futures.
A business case for achieving water savings at the farm, regional and basin level has already been established by the Pratt Water Feasibility Study in the Murrumbidgee Catchment which asks for a uniform national water efficiency and environmental regulatory framework using the Council of Australian Governments (CoAG) framework (Pratt Water Group, 2005).
Recently the Australian Government initiated a National Water Commission (NWC) to drive the reforms faster. At the water distribution and on-farm level, the focus of reform and research is on the identification and reduction of leakage and water losses, the determination of water benefits and improved water accounts (the Commonwealth Scientific and Industrial Research Organization (CSIRO), for example has a $A20 million Flagship Project focusing on these and related water issues), improved efficiency of water delivery systems including the change over from gravity-fed to pressurized delivery systems and more optimal design of irrigation requirement and delivery to the root zone, as well as on the development of market-based instruments to facilitate improved natural resource management. However, there are still major differences in productivity across farms, so considerably more effort is also required at identifying the biophysical, management practice and social reasons behind this variability in order to get all enterprises working more productively.
5. Conclusions and way forward
In order to achieve true water savings a systems approach is necessary to target “real water-savings” and to remove technical, economic and institutional barriers.
A systems approach adopted in the Murrumbidgee Catchment showed accounted losses greater than 300 GL can be saved (Khan et al., 2004b and c). The on-farm and off-farm water-saving costs vary from less than $A50/ML to well over $A5000/ML. Such investments can be possible either by using the saved water on higher values crops or by including saving costs as part of the overall water supply charges with a proportionate cost sharing arrangement. There is a need to reduce the break-even period by considering “leasing of water” for the environment from farmers at around $A300/ML for a fixed period of five to ten years after which the water can be returned back to the “owner” and government can then lease the next lot of water from another group of farmers.
If the water-saving technologies are considered on their own; costs involved will discourage substantial investments by the individual farmers and irrigation companies. This is mainly because the irrigation supply systems represent a shared and jointly owned common pool resource. There is a possibility of inaction among local, regional and national actors leading to market failure and the classic tragedy of the commons. Institutional reforms aimed at minimizing the risk of market failure driven by the tragedy of the commons are required to secure a win-win situation for all stakeholders.
Because of lower commodity prices farmers and irrigation companies on their own will be unable to achieve water savings. Unless water-saving costs and benefits are shared by all players in a catchment the “real water savings” are not possible. Private-public investment models aimed at providing “preferential access rights” to those who save water by investing in water-saving technologies may be one of the possible ways forward.
Acknowledgments
Data inputs from the Department of Land and Water Conservation, NSW Department of Primary Industries and Irrigation Companies are acknowledged. Funding support from the ACIAR, Pratt Water Group and CSIRO’s Water for a Healthy Country Flagship is appreciated.
References
Beecher, G., McLeod, G.D., Pritchard, K.E. & Russell, K. 1995. Final report, benchmarks and best management practices for irrigated cropping industries in the Southern Murray-Darling Basin, NRMS I 5045.
Department of Land and Water Conservation. 2003. Water sharing plan for the Murrumbidgee regulated river water source 2003 Order.
Khan S., Rana T. & Blackwell, J. 2004a. Can irrigation be sustainable? Proceedings of the 4th International Crop Science Conference. Brisbane — New directions for a diverse planet. 4th International Crop Science Conference. 26 September — 1 October 2004 (available at http://www.regional.org.au).
Khan S., Rana T., Beddek R., Blackwell J., Paydar Z. & Carroll, J. 2004b. Whole of catchment water and salt balance to identify potential water-saving options in the Murrumbidgee catchment. Pratt Water Group — Water Efficiency Feasibility Project (available at http://www.napswq.gov.au).
Khan S., Akbar S., Rana T., Abbas A., Robinson D., Dassanayke D., Hirsi I., Blackwell J., Xevi, E. & Carmichael, A. 2004c. Hydrologic economic ranking of water-saving options Murrumbidgee Valley. Report to Pratt Water Group — Water Efficiency Feasibility Project (available at http://www.napswq.gov.au).
Khan, S., Akbar, S., Rana, T., Abbas, A., Robinson, D., Paydar, Z., Dassanayke, D., Hirsi, I., Blackwell, J., Xevi, E. & Carmichael, A. 2005a. Off-and on-farm savings of irrigation water. Murrumbidgee Valley water efficiency feasibility project. Water for a healthy country flagship report, 16 pp., CSIRO, Canberra, (available at http://www.cmis.csiro.au).
Khan, S., Rana, T., Beddek, R., Blackwell, J., Paydar, Z. & Carroll, J. 2005b. Whole-of-catchment water and salt balance. Identifying potential water saving and management options in the Murrumbidgee catchment. Water for a Healthy Country report, 16 pp., CSIRO, Canberra, (available at http://www.cmis.csiro.au).
Khan S., Mu J., Hu Y., Rana T. & Zhanyi, G. 2005c. Systems approaches to achieve real water savings in Australia and China. 19th International Congress on Irrigation and Drainage, 10–18 September 2005, Beijing, China.
Khan S. Mu J., Jamnani M.A., Hafeez, M. & Zhanyi, G. 2005d. Modeling country water futures using food security and environmental sustainability approaches. Proceedings of the 16th Congress of the Modelling and Simulation Society of Australia and New Zealand. 12–15 December 2005.
MIA & Districts Land and Water Management Plan Working Group. 1997. MIA & districts and water management plan, Griffith.
Murray-Darling Basin Commission (MDBC). 1997. Inland agriculture, best management practices and benchmarking study. Inland Agriculture Pty. Ltd. in association with Hutchins Agronomic Services, Darlington Point.
NSW Dept. of Agriculture. 2003. Murrumbidgee Catchment irrigation profile. Written and compiled by Meredith Hope and Marcus Wright.
Pratt Water Group. 2005. The business of saving water. Report of the Murrumbidgee Valley Water Efficiency Feasibility Project. Report prepared under the Pratt Water Murrumbidgee Project — a collaborative venture funded jointly by the NSW and Commonwealth Governments under the National Action Plan for Salinity & Water Quality, and by Pratt Water Ltd.
13 Charles Sturt University and CSIRO Land and Water, School of Science and Technology Locked Bag 588, Wagga Wagga, NSW 2678, Australia, [email protected]
Herve Plusquellec14
The adoption of modern technologies for the operation of medium and large surface irrigation systems has been slow in most developing countries and especially in rice-based systems despite the advantages of these technologies. No engineer uses a ruler or a typewriter any more in the region. Yet most irrigation canals are operated using century-old technology. There are many reasons for that situation, among them:
Most civil engineers are well trained in structural engineering and construction techniques, but not in the practical and theoretical aspects of unsteady flow hydraulics that are the norm in most irrigation systems. They are also unfamiliar with the constraints of the end user, i.e. on-farm irrigation management requirements.
There is now some evidence that the achievements of the institutional and policy reforms with a main focus on participatory management (reforms of irrigation agencies and integrated water management supported by donors in many countries) are far below the expected benefits. It is now recognized that physical changes and reforms have to be closely linked to provide the expected benefits in terms of water saving, increased efficiency and higher agricultural productivity. This is particularly valid for rice-based systems in Southeast Asia.
Many irrigation systems in this region have been designed for rice cultivation during the monsoon season when water efficiency is not a major concern. Canals were designed to operate at or near full supply with no consideration for operation at less than this. These systems cannot be operated efficiently as they are, whatever the type of management. The results are excessive releases of water during the wet season and lower than expected dry season cultivation. For example, dry season irrigation was introduced in the lower Chao Phraya Basin in Thailand in the late 1960s and extended to the entire area in just a few years, leading to frequent shortages of water in the basin. Crop diversification, which is highly encouraged by governments, donors and agronomic researchers, requires a management system based on frequent irrigation and low applications contrasting with the continuous flow application commonly used in the region.
Most of the irrigation systems in the region have been designed for manual local operation and equipped with undershot gates. (Figure 1) These systems are known to be the most difficult systems to operate because of the large number of gates to operate and the frequency of adjustments — at least three to four daily — required to provide a reliable service to the users (Figure 2).
Overoptimistic assumptions on system efficiency have been adopted by consulting firms at the feasibility stage. Overall project efficiencies adopted for donor-supported projects in the region were 50 percent or above.
Audit and impact evaluation studies carried out years after completion indicated that the efficiencies of rice-based canal systems in the region rarely exceed 35 percent. The high design values cannot be achieved with the physical control infrastructure in place. In some projects, water lost in the upper parts of the project is re-captured through pumping from the drainage system by the users downstream, increasing the overall efficiency of the project area to a value close to or above the design value (Figure 3). However, that practice has a high cost for the downstream users, and it limits their potential productivity because of the unreliability of their source of water.
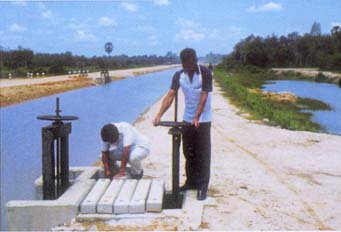 Figure 1. Thailand, Mae Khlong Project: Poorly understood operation of constant head orifice (CHO) |
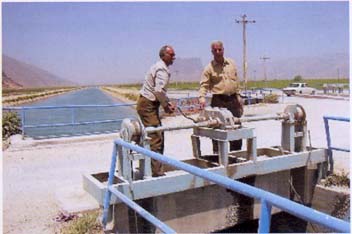 Figure 2. Iran, Duruzan Project: Manual operation of a gated cross-regulator |
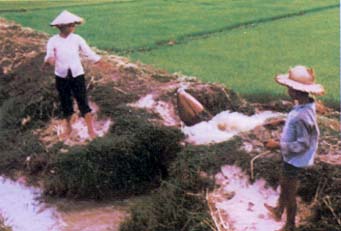 Figure 3. Viet Nam: Re-use of drainage water by the basket method |
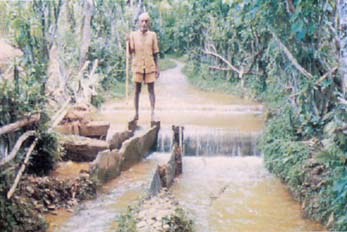 Figure 4. Nepal: Traditional irrigation systems using the principle of proportional distribution through flow dividers |
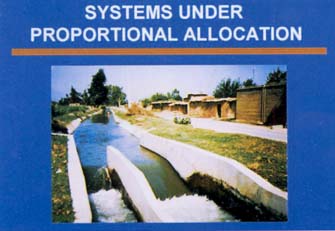 Figure 5. Pakistan, Northwest Frontier Province, Lower Swat Project: Modern flow dividers |
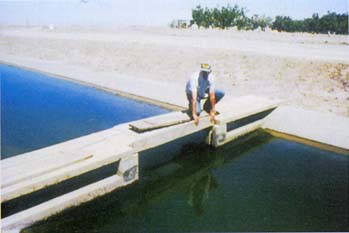 Figure 6. California: Cross-regulator equipped with flashboard |
This paper describes how the technology of water control has evolved over the years and discusses the advantages and disadvantages of the modern technologies for application in the context of rice-based irrigation systems.
Evolution of canal control
Traditional small and medium scale irrigation systems have been built by groups of farmers in many countries around the world. Management and construction of these systems are based, generally, on well-established water rights. In the absence of upstream seasonal regulation of water resources, the natural diverted flow was shared between subgroups of farmers through flow dividers, whatever the incoming flow (Figures 4 and 5).
Local manual control
With the construction of large reservoirs, the scale of irrigation systems took a wider dimension and the management of the water resources became an issue. Irrigation systems built before the mid-1950s were mostly equipped with simple flashboard devices to regulate the water level at judicious points and the offtakes were equipped with simple sliding gates. Most of the irrigation schemes in the Murray-Darling Basin in Australia, built in the 1920s and still operated with that control equipment, are now undergoing a modernization process using the most advanced equipment (Figure 6).
Because the handling of the boards is risky and time consuming, they were replaced progressively by undershot sliding or radial gates. This change was progress from a mechanical point of view but has the hydraulic disadvantage of increasing the sensitivity of operation of the canal systems. This change was made in the irrigation systems of Indonesia concurrently with the replacement of simple offtakes by overshot type gates (Figure 7). That arrangement of undershot regulators with overshot offtakes is the worst combination since the systems are now highly sensitive to any change of incoming flow.
Local manual control takes into account only local status data, whereas optimum operation requires knowledge of the status over a wider area. No operator can be expected to master the interaction between all the parameters of a complex system. Other shortcomings of manual control are the degree of dedication and motivation of the operating staff and their ability to resist pressure from the farmers and the accessibility of the control sites in all-weather conditions.
Automatic hydraulically operated gates
The difficulty of operation of a manually operated system encouraged the development of automatic hydraulically operated gates. Modern automatic control of gates may have begun in the 1920s when automatically-controlled leak gates, (known as Danaidean gates) were installed on the main canals of the Turlok irrigation project in California and on the San Carlos Project in Arizona. The Turlok gates built of hardwood are still in operation nearly 100 years after their installation (Figure 8). A similar gate was installed in the Red River Delta in Viet Nam in the 1930s. A French company developed a series of float operated gates to maintain upstream (AMIL) or downstream constant flow (AVIO and AVIS) in the late 1930s (Figure 9). These gates were widely used in the Mediterranean countries (Italy, the Middle East, North Africa, Spain) and elsewhere on a smaller scale. The company also developed modular devices to solve the technical problem of delivering a constant flow from a canal to another one of lower order or from a canal to users, despite the variations of upstream water level (Figure 10).
Concurrently, automatic flap gates were developed in the Netherlands to maintain an upstream constant water level (Figure 11). The design of flap gates has been revised recently by ITRC from California (Figure 12).
Passive concrete structures, known as long crested weirs, have been developed to limit the variations of upstream water level by increasing the length of the weir. These passive structures do not meet the definition of automation.15 They are designed to limit the variations of upstream level and their designs are highly versatile. They have been designed either in V or W shape, oriented upstream or downstream, alone or in combination with under-shot gates (Figures 13 and 14).
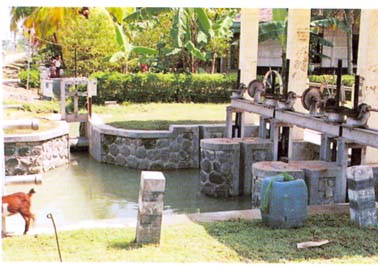 Figure 7. Undershot gate in Indonesia |
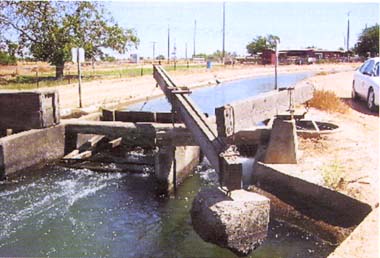 Figure 8. Turlok gate built of hardwood |
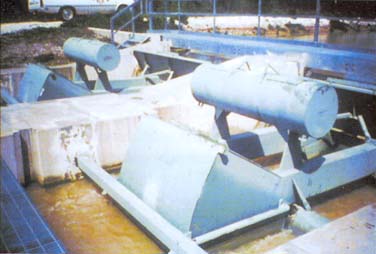 Figure 9. Automatic float-operated upstream control level gates |
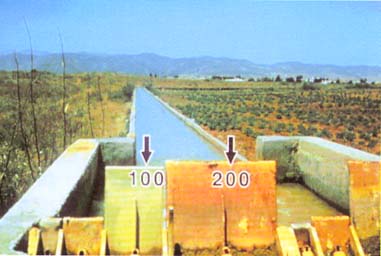 Figure 10. Morocco, Doukkala Project: Modular distributors providing nearly constant flows |
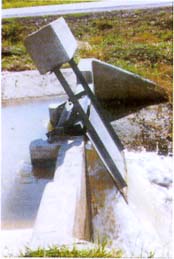 Figure 11. Dominican Republic: Automatic flap gate providing controlling upstream level |
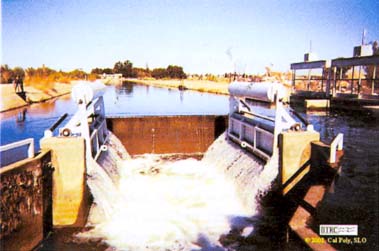 Figure 12. California: Combination of automatic ITRC flap gates and overflow section |
The development of hydraulic gates has considerably simplified the operation of canal irrigation systems and reduced the labour costs. The only adjustments of the gates are the openings and closings of the modular offtakes. However, there are some limitations. The two possible canal control logics with local automatic hydraulic control are upstream and local downstream control. Upstream control requires the preparation of an elaborate irrigation scheduling based either on the individual farm orders or on considerable field data and meteorological data collected by the operator and estimates of efficiency and time of transmission. The latter is used in most countries in the region. Downstream control eliminates the need to prepare an irrigation schedule, but its application is limited by the slope of the existing canals and the feasibility of raising banks of canals to convert them to level top canals (Figure 15).
Upstream control is the standard canal control logic in South Asia. Operational losses estimated at about 5 to 10 percent of the flow diverted into a canal under upstream control are needed to provide a reliable service to the downstream area because of the uncertainty in some hydraulic parameters, and unexpected changes in irrigation requirements. These losses are inherent to upstream control. Some schemes in South Asia or elsewhere have no operational losses but most of the time irrigation water is not delivered to the tail end users. Some additions to the infrastructure of existing systems can reduce operational losses, such as construction of compensation reservoirs and interceptor canals. This is an important component of the strategy of modernization in the western United States.
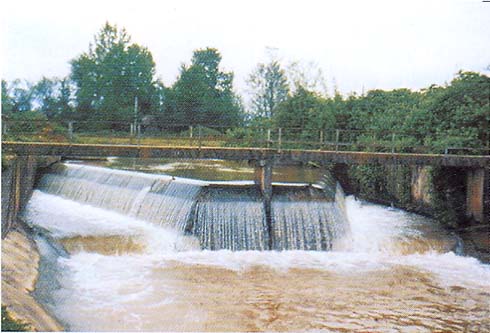 Figure 13. Sri Lanka: Simple long-crested weir regulator |
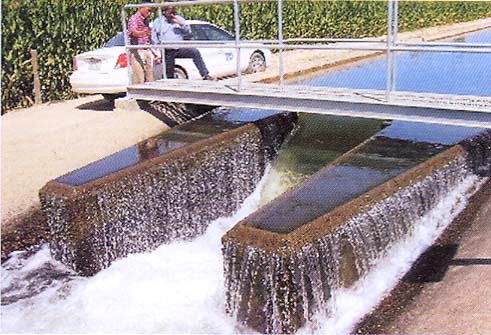 Figure 14. California, Turlok irrigation district: Double long crested weir |
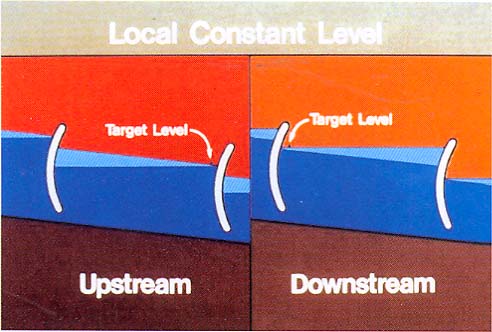 Figure 15. Principle of upstream and downstream level control |
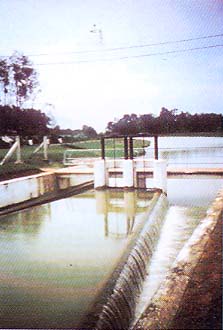 Figure 16. Malaysia, Kemubu Project: A perfect example of a composite regulator — a long crested section associated with two gates used for silt control and large variations of flow |
A feature of the local hydraulic control is that the target level is set once the gates are installed (in contrast to gates under local controllers, as discussed in the next section). Some operators consider this as a drawback. The cost of the float-operated gates is high compared to conventional gates because of the weight of steel needed for the construction of the float, the counterweights, the leaf gates and other elements. However, a simple investment cost comparison is not acceptable. Cost of operation and water saving should be included in a cost–benefit analysis.
Hydraulic regulation was adopted during the planning and design of the Kemubu Project in Malaysia in the 1970s and still operates satisfactorily (Figure 16). That design would have been a correct option for some of the new large-scale projects implemented in the region, such as the Lam Pao, Nam Moon in Northeast Thailand or in the Mae Khlong Basin.
The modernization of existing irrigation systems using hydraulic automation has some limitations. Downstream control with level top canals is not feasible where canals are too steep (Figure 17). Use of modular distributors requires hydraulic head not always available in flat rice-based areas. Flap gates cannot operate if submerged downstream.
Local controllers
The above hydraulic canal control technologies developed by European countries were not adopted in the USA, possibly because of the difficulty of adapting them to the constraints of existing systems. The design standards of the Bureau of Reclamation, widely introduced in the region in the 1960s, are based essentially on the use of manually operated undershot gates. Canal automation developed in the USA with the advent of electronics and progress in telecommunications. The first applications of local controllers occurred in the western USA in the late-1950s. These installations were electromechanical gate controllers to maintain a constant upstream water level at cross-regulator (Figures 18 and 19). In the 1960s, attempts were made to maintain the water level downstream from the structure through local automatic control. Since the water level sensors were distant from the control gate and, in most cases, upstream of the next control gate, communications were required (Figure 20). Local downstream controllers required better control logic to deal with the time lag between the gate and the sensor. Eventually, electronics replaced the electromechanical equipment (Figures 21, 22 and 23) in the form of programmable logic controllers or PLC. There are now many successful applications of local controllers. Applications include mainly control of flow at offtakes and control of local upstream water levels. There are many fewer applications to downstream local or remote water levels because flow disturbances in individual pools, which could cause instabilities in control, are difficult to eliminate.
Local automatic control alone, whether it is activated by hydraulic or electronic action, has the operational disadvantage that the field conditions are not continuously known by the headquarters unless a reporting system by field staff is established. However, this is cumbersome and hazardous in the case of an emergency.
Centralized monitoring and control
The advent of high capacity computers and progress in communications in the 1970s opened the door for centralized control of large canal irrigation systems in which a number of remote sites are linked through a central control centre.
Some of the applications in the USA and France are well known. In the USA, the large conveyance canals for interbasin water transfer, the California Aqueduct and the Central Arizona Project, are operated under remote monitoring and remote manual control.
Supervisory control consists of bringing system-wide information from remote sites to a single master station. Supervisory monitoring can give a water master the power to see his whole project without leaving his office. Supervisory control consisting of changing the target points of local controllers empowers a water master to make rapid coordinated changes at key structures. Supervisory control was implemented in the 1970s at several irrigation systems, such as the Salt River Project (Figure 25) and the Coachella Irrigation District. With further advances in equipment, supervisory control and data acquisition (SCADA) has now spread to a number of irrigation districts in the western States, such as the Turlok Irrigation District, the Imperial Irrigation District and many others.
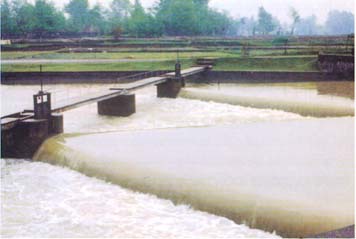 Figure 17. Iran, Guilan Project: A double long crested weir on the main canal with a 100 m3/s capacity |
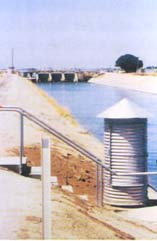 Figure 18. California, Friant-Kern Canal: A Littleman controller of the lateral canal offtake in the background |
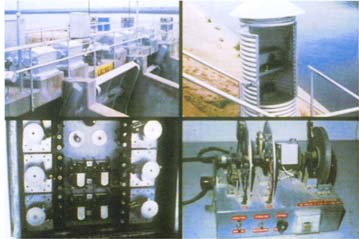 Figure 19. Details of Littleman controller: An outdated electromechanical technology |
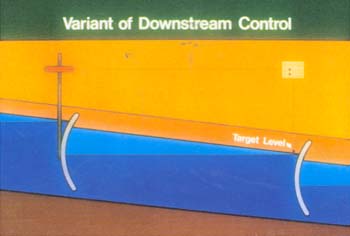 Figure 20. Schematic of distant downstream control |
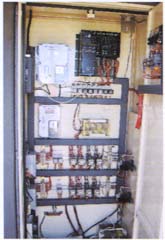 Figure 21. SCADA site: Electronic controller |
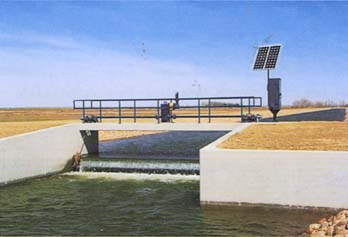 Figure 22. Canada, Alberta: Automatic control of an overshot gate |
The increased capacity of computers in the 1970s made it possible to develop simulation models to study channels under unsteady flow conditions. The well-known dynamic regulation of the Canal de Provence providing irrigation water and raw domestic supply to a large area in Southern France is based on a large simulation model and a predictive method of water demand (Figures 26, 27 and 28). Dynamic control was adopted for the King Abdullah canal in Jordan and for the Majalgaon canal project in Maharashtra State, India. Implementation of dynamic control is still under implementation in the Narmada Project in India.
Few centralized projects or SCADA projects have been implemented in developing countries and many of them have failed for various reasons. The most critical phase in an automation project is implementation: the transition from design to implementation, which includes the integration of hardware and software components, installation and testing. Shortcomings in electronic/communications based automation are possible at all stages: design, implementation and operation, control algorithm limitation, poor integration of components, malfunctioning of equipment, lack of training of operation staff, lack of spare parts and poor maintenance. The problem of simulation is more challenging than earlier thought. The complexities of going from an algorithm to actual implementation in the field should not be underestimated.
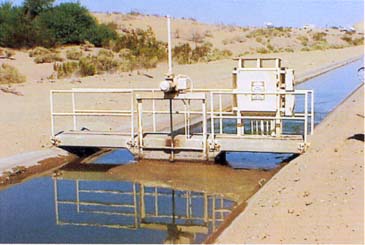 Figure 23. California, Yuma Irrigation District: SCADA site with local controller |
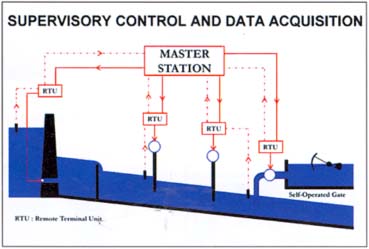 Figure 24. Schematic of a canal under supervisory control |
 Figure 25. Arizona, Salt River Project: SCADA master station with manual setting of site target conditions |
 Figure 26. France, Canal de Provence: Central control of the SCP system under dynamic regulation |
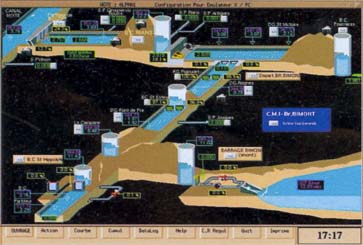 Figure 27. Canal de Provence: Real time display of the conditions of the canal and reservoir system |
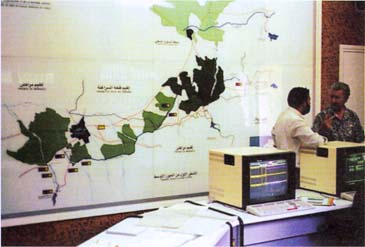 Figure 28. Morocco, Office du Haouz, Marrakech: Central control of the Haouz canal |
The right social environment is also essential for implementation of automation, as risk of vandalism could preclude the adoption of any advanced technology. In developing countries, it is strongly recommended to start with simple automation or SCADA projects and to expand progressively.
Breakthroughs in canal control technology
Despite the advances in technology, the design, implementation and operation of local controllers, SCADA and automated centralized control has been the domain of a few researchers and automation experts until recently. The industry is now developing friendly user canal control equipment. For example, a company from Australia has addressed the shortcomings in electronic based automation by developing integrated control equipment in a single set including an overshot gate, level and gate position sensors, motor, battery and solar panel, electronics with software (Figure 29). This equipment is easy to install. Its operation through a keypad and a liquid crystal display is user-friendly. The keypad is used to navigate between various menus (remote or local control) and control parameters (flow, upstream or downstream level control) and set point entry screens. These gates can be used under local control, remote control from a central office or integrated in a “total channel control” (TCC). These gates are also installed at farm outlets providing a much more accurate measurement of delivered volumes than the old Dethridge wheel (10 percent). After a few years of piloting, the technology is now being applied extensively in Australia to modernize the 80-year-old systems mostly operated with flashboards (Figure 30). Its application is now spreading to irrigation districts in the western USA (Turlok and Imperial Valley Districts) (Figure 31). TCC combined with interactive voice response (IVR) to place farmer orders and the new generation of gates provides an integrated package to move from century-old to twenty-first century technology. Its success however is based on the absence of vandalism.
Conclusions and recommendations
The performance of rice-based irrigation systems in Southeast Asia is constrained by deficiencies in both management and physical infrastructure. The existing schemes often designed for full supply or without operation in mind cannot be operated efficiently. Experience indicates that substantial progress in performance can be achieved only if both aspects are addressed.
There are two potential disadvantages, which need to be considered at the early stages of a modernization process:
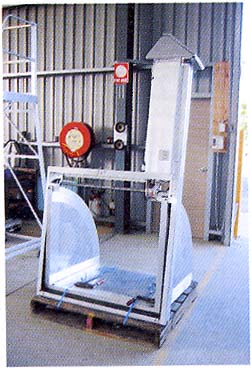 Figure 29. Australia: A RUBICON gate in the factory ready for site transportation |
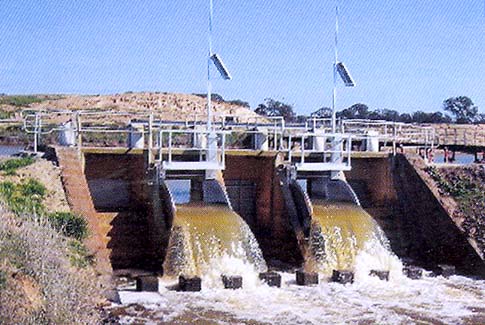 Figure 30. Australia, Murray Darling Basin: A cross-regulator equipped with two RUBICON gates |
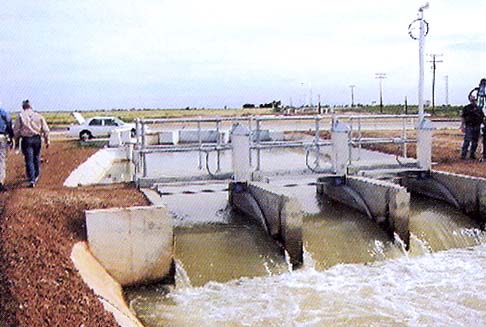 Figure 31. California, Imperial Irrigation District: A cross-regulator equipped with three RUBICON gates |
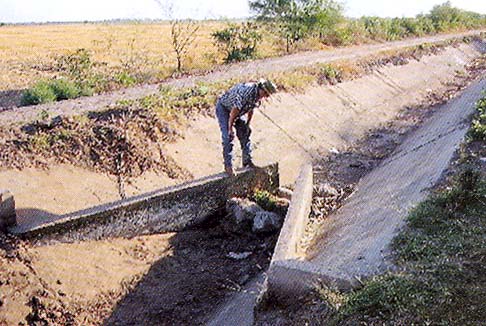 Figure 32. Mexico, Mayo Irrigation District: Vandalized long crested weirs, most likely because the basic principle of upstream control operation by excess was not applied |
Reference
Burt, C.M. & Piao, X. 2002. Advances in PLC-based canal automations. Paper presented at the July 9–12, 2002 USCID conference on benchmarking irrigation system performance using water measurement and water balances. San Luis Obispo, CA. ITRC Paper No. P02-001 (available at http://www.itrc.org).
14 Consultant, Former World Bank Irrigation Adviser.
15 “Canal automation … refers to a closed loop in which a gate or pump changes its position/setting in response to a water level, flow rate, or pressure because that level/rate/pressure is different from the intended target value. Closed loop means that the action is performed without any human intervention. The automation may be performed through hydraulic, electrical, electronic, or a combination of these means.” (Burt and Piao, 2002, p. 1).
Ian W. Makin16
Abstract
Irrigation has played, and will continue to play, an important role in securing the food supply for the rapidly expanding population of the world. However, the irrigation sector must increasingly develop approaches to the design and implementation of management and infrastructure that can provide flexible and responsive services to the agricultural sector. The need for greater consideration of the impacts of agricultural development on the broader environment and the impacts on the livelihood systems of the communities in the vicinity will increasingly constrain the freedom of action available when designing interventions, particularly in the irrigated agriculture sector.
A major shift in thinking is required to move away from a distinction between the development and operational phases in the life cycle of an irrigation system. Instead, irrigated agriculture should assume that irrigation schemes are in both phases at all times, after initial completion of infrastructure development. The development plan for each scheme must focus on achieving the strategic goals set for the sector, and the surrounding community. This places irrigation schemes in the broader river basin and socio-economic contexts, whereby decisions on investment in the irrigation system are considered not only in terms of the improvements in system performance but also in terms of their contribution to improving livelihoods and minimizing environmental degradation.
Although interventions made at various times in the management of water for agriculture are done to achieve sustainable increases in production, in reality sustainability is achieved by continuous changes in management and infrastructure designs. It is by being flexible and responding to changing conditions and opportunities that agricultural production can be maintained and rural livelihoods can be sustained and improved. In many cases the interventions are, in themselves, not sustainable, but rather are a stepping stone that helps the transition from one form of management to another.
Introduction
Management of enterprises, whether public or private sector, must operate keeping in mind that change is the only constant. Irrigation is a major undertaking, whether for an individual farmer diverting water from a small stream to irrigate a few hundred square metres; or for a government irrigation department mobilizing international financing to develop or modernize a system serving many hundreds of farm households. Across the full spectrum of irrigation systems the challenges of adapting irrigation to the vagaries of the weather, pest and weed infestations, labour availability and dynamic markets are apparent to everyone involved.
There is widespread recognition that government bureaucracies are not the most well suited to manage in situations that require flexible and adaptive responses to changing conditions. Centrally financed irrigation departments have found it increasingly difficult to sustain the recurrent expenditures required for operation and maintenance (O&M) and are faced with a strong reluctance on the part of farmers to pay governments for, what is often, a service not well matched with farming requirements. Lack of funds, poorly motivated staff in O&M departments, and growing demands from farming communities for improved services have encouraged governments to seek to restructure irrigation service providers through some form of management transfer. Vermillion and Sagardoy (1999) identify three forms, summarized in Figure 1, noting that decentralization provides water users with little management control and little improvement in irrigation service. Irrigation transfer on the other hand provides greater authority to the water users, with increased responsibility for decision-making and funding the costs of O&M.
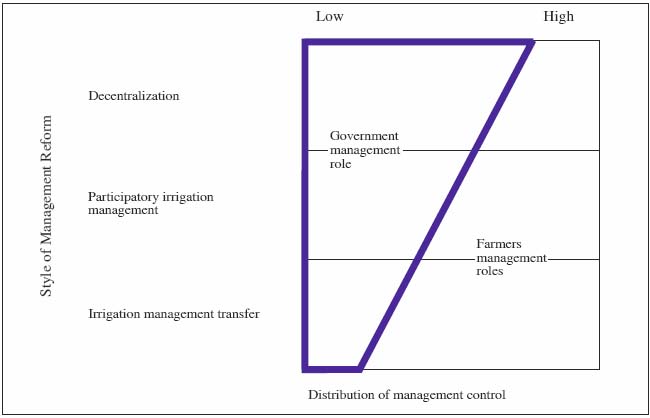
Figure 1. Illustration of distribution of management control with style of management transformation
Changes in the relationship between users of irrigation systems and government officials have proceeded in many developing countries over the past 20 years, and especially through the 1990s. These changes have often been called “management transfer”, expressing the idea that some, or perhaps all, of the attributes of management, such as operational decision-making, acquisition and application of resources, maintenance, and in some cases ownership and responsibility for improvement of the facilities themselves, are moved from the sphere of government officials to that of the local community.
New organizations have often had to be promoted among water-user communities but, although that aspect of the change has received relatively high levels of attention, organizational development by itself is not enough. Some countries, which have given high prominence to the promotion of new organizations of irrigators, have experienced disappointment with subsequent results. The new organizations are in many cases reported to have low effectiveness, and have difficulty in attracting the efforts and active support of their communities. New organizations are frequently described as somewhat illusory or “existing only on paper.”
There are probably many reasons for this. One possible reason is that the planning of irrigation systems, and of rehabilitation and upgrading of older systems, is frequently performed in a top-down, technocratic way, and is not sufficiently influenced by the views of the users. Probably, a traditional view of the relationship that should exist between the users and the officials responsible for technical management carries over into the newer generation of organizational and institutional development projects.
Plusquellec (2002) reminds us that one conclusion from the E-mail conference on Participatory Irrigation Management (July–October 2001) was the importance of matching the management capacity of the irrigation service provider with the infrastructure available for water distribution. Furthermore, it is essential that these components are capable of providing the service the water users require. And, although the theme of the current conference is rice-based irrigation, it is increasingly clear that the future of irrigated agriculture will include increased demands for flexibility of service and increasingly differentiated demands for diversified crops. How the distribution technology and management institutions in the large rice-based irrigation systems of Southeast Asia will evolve to meet these challenges, in the face of changing economies, increasing globalization of markets, climate change and the changing aspirations of rural communities, is a critical question.
Gazing into a crystal ball
A prediction of how irrigation institutions will evolve to meet the challenges of the future is inevitably clouded with the uncertainty of the unknown. However, if we consider the trends of recent years and if we make some pragmatic assumptions about the nature of farming communities, we may have the basis to predict the form that irrigated agriculture may evolve towards over the next 20 years.
Competition for water for uses other than agriculture will continue to increase in many river basins. As the urban centres grow and industrial economies become more dominant in the region, agriculture will form a smaller percentage of the national economy and water will be diverted to other uses. However, in the majority of cases the impact on water available for agricultural production may be minimized by improvements in irrigation efficiency through the adoption of improved technology and techniques. However, the demands for high standards of water quality may place greater restrictions on agricultural water use to reduce the impacts of non-point pollution from fertilizer, herbicide and pesticide applications. In many cases the use of these inputs in the region remains low; however, increases in commercial farming enterprises can be expected to result in increasing use of these inputs. Furthermore, lifestyle changes in urban centres can be expected to create greater awareness of, and demands for access to, wetlands and forests. These ecosystems are water users of the same magnitude as agricultural systems, and will also compete for land allocations.
Where opportunities to move out of agriculture to other employment exist, rural people, particularly the young and better educated, are moving to take up these jobs. Timmer (2005) argues that preparing people to take up non-farm employment is the strongest justification for investment in rural health and education in the effort to eradicate rural poverty. Discussions with farmer families in many parts of the region will rarely elicit the ambition to see their children engaged in agriculture; it is simply work that is too hard and too unrewarding, even though there is often recognition that life is not easy outside the farm. There are already signs that the average age of farmers is increasing, and the size of the average farming unit in irrigation schemes is also growing, either through land acquisition or through rental to larger scale growers. The economies of scale that these larger units provide is leading to increased farm mechanization. These trends can be expected to continue, resulting in fewer farmers, operating increasingly commercial agricultural enterprises.
Timmer (2005) identifies another transformation which has happened in the region, but has been largely unrecognized, in the expansion of vertically linked supply chains from farm through to retail outlets supplying expanding urban populations with food. These supply chains are dominated by the retail supermarkets with demands for high-quality produce meeting international standards of hygiene. The expansion of membership of the World Trade Organization is opening the markets of the region to producers everywhere. For the local producers to retain their share of the local market they will have to meet the quality, supply and price standards of the retail markets. However, success in the local market will increasingly mean these products will also meet international standards and thus open new global markets for the producers.
To service these commercialized irrigated farms the irrigation service provider (ISP) will be expected to provide reliable and responsive services in return for payment of an irrigation service fee (ISF). The larger farmers may invest part of the farm unit to provide local storage of water to protect their investment in higher value food crops, i.e. not staple foods such as rice, from variations in irrigation supply.
In brief, rice will continue to be the dominant staple crop; however, we should expect that some of the rice-based large irrigation systems will change over the next 10 to 20 years to have few farmers operating larger farm units with a broader mix of crops supplying vertically linked market chains through rural agro-processing centres. These transformations will happen where transport and communication infrastructure has opened up the rural landscape and linked the producer centres to the consumers in the towns and cities of the region and beyond.
In other schemes, where transport and communication remain less well developed, irrigation schemes will continue to be the producers of staple grains for consumption and trade. The challenge for irrigation institutions will remain to deliver reliable irrigation services to large numbers of small farmer units, probably best achieved through the water user associations responsible for the full O&M costs of the schemes that supply their farms.
However, in these systems a greater proportion of the O&M costs will be met through contributions of labour rather than through formal ISF payments.
ADB water policy and future irrigation institutions
The Asian Development Bank water policy (ADB, 2003) seeks to promote the achievement of higher irrigation efficiencies in the context of river basins, through optimization of the performance of irrigation and drainage systems. The policy recognizes:
The ADB water policy identifies the need to phase out subsidies for O&M of public irrigation and drainage systems; and the need to establish virtuous cycles of investment, user charges, and O&M by autonomous and accountable service agencies, with user representation. These will be essential to the establishment of modernized irrigation and drainage systems. The phased turnover of responsibilities for distribution system operation and maintenance to farmer groups is expected to improve system sustainability.
For the schemes where larger farms have evolved and diversified cropping for vertically integrated markets is established, the ISP is likely to become a responsive client driven organization employing professional irrigation operations staff using modern command and control infrastructure as envisaged in the ADB water policy. Irrigation scheduling may become largely “on-demand”, although local on-farm storage may reduce the need for this level of sophistication. The ISP is likely to be “owned” by the water users with water user and river basin representation through a formal governance structure able to set policy; whereas routine O&M is implemented by the ISP.
The ADB water policy also records the need to identify and protect the collective and individual rights and responsibilities of water users (including poor and marginal farmers at the tail end of irrigation systems), service providers, and public agencies. The vision of possible transformation of large-scale irrigation above gives additional stress to this objective of the water policy. It is the poor and marginalized that are often the least able to participate in the opportunities such transformations present. Where smallholder agriculture remains the dominant farming system, the ISP will need to balance the demands of more commercial operators with the need to provide a reliable service to all stakeholders.
One characteristic that will emerge in future irrigation institutions will be the adoption of asset management plans for irrigation and drainage system maintenance planning. These techniques will supplant the use of available annual maintenance funds to, nominally, maintain the system in the design conditions, and a proportion of the funds will be set aside each year for incremental replacement of infrastructure to enable the adoption of different management strategies; examples may include:
Under traditional management by centralized bureaucracies, such changes would require a specific, often externally financed project. However, setting a goal of reducing water use by some specified amount over a specified time allows system managers to prioritize the investments to achieve these goals through better targeted maintenance and replacement planning. Where external funds become available these can be included in the long-term plans without disrupting the management strategy. A consistent strategy gives the irrigation system users greater confidence than is sometimes the case with the current decision-making norms that the interventions are being made for their benefit. Through transparent decision-making in the allocation of available funds to maintenance of the system, users are more likely to be willing to pay ISF, further strengthening the virtuous cycle envisioned in the ADB water policy.
Conclusions
As new irrigation institutions emerge to manage irrigation schemes, a major shift in thinking is required to move away from a distinction between the development and operational phases of a scheme’s life cycle (Makin, 2002). Instead, the irrigated agriculture sector should assume that all irrigation schemes are in both phases at all times after initial completion of the infrastructure. The development plan for each scheme must focus on achieving the strategic goals set for the sector, and the surrounding community. This places the irrigation scheme in the broader river basin and socio-economic contexts, whereby decisions on investment in the irrigation system are considered not only in terms of the improvements in system performance, but also in terms of the contribution to improving livelihoods and minimizing environmental degradation.
Sustainable irrigation and drainage system operations will involve:
To achieve these goals will require the involvement of water users, civil society and river basin regulatory authorities in the irrigation institutions that set the policy objectives for individual schemes. To deliver effective irrigation and drainage services to water users in large irrigation systems, whether growing staple foods such as rice and other grains or higher value diversified crops, will require professional irrigation service providers to operate and maintain the delivery system. These adaptations to the institutions currently managing irrigation services will go a long way to answering the observation (Molden and Makin, 1996) that both infrastructure and institutional changes are required. Three basic elements: water rights, infrastructure, and management institutions must be integrated and balanced in the design of both infrastructure and institutions. The combination of management and infrastructure must match with the desired level of water delivery service. Adequate institutional capacity of the irrigation agency, the local ISP organization and water users must be in place to manage the designed infrastructure.
References
ADB. 2003. Water for all. The water policy of the Asian Development Bank. Manila.
Makin, I.W. 2002. Sustainable Irrigation Development. In Proceedings of Asian Productivity Organization workshop. Colombo, Sri Lanka.
Molden, D.J. & Makin, I.W. 1996. Institutional change in support of modernization and management transfer. In Proceedings of FAO expert consultation on modernization of irrigation schemes: past experiences and future options. FAO, Bangkok.
Plusqullec, H. 2002. How design, management and policy affect the performance of irrigation projects. Emerging modernization procedures and design standards. FAO, Bangkok.
Timmer, C. 2005. Agriculture and pro-poor growth: An Asian perspective. Centre for Global Development. Working Paper No. 63 Washington, DC.
Vermillion, D.L. & Sagardoy, J.A. 1999. Transfer of irrigation management services. Guidelines. FAO Irrigation and Drainage Paper 58, Rome.
16 Water Resources Engineer, Mekong Agriculture and Natural Environment Division, Asian Development Bank. The views expressed in this paper are those of the author and do not necessarily reflect the views or policies of the Asian Development Bank.
![]()
![]()
![]()