![]()
![]()
![]()
In Asia and the Pacific region, capture fisheries have increased slightly in terms of production whereas aquaculture has continued to grow at a rapid rate since the publication of the previous APFIC biennial review Status and potential of fisheries and aquaculture in Asia and the Pacific region 2006. In terms of food security, revenue generation and employment, both capture fisheries and aquaculture sectors continue to be of fundamental importance to the region as can be seen by the tonnage and value produced.
In many of the countries of the region, catching or farming aquatic resources forms a vital part of rural people's livelihoods. Fisheries and aquaculture also have a deep cultural significance and are more than more just sources of income or food supply; traditional fishery products such as fish sauce and fish-based condiments have always been important ingredients of people's daily diets and are not easily substituted. All sizes and types of fish are utilized in a wide variety of ways and there is very little discarding or wastage.
The role that fish play in both the food security and nutritional security of many rural and coastal populations has often been underestimated in the past. It is also now increasingly recognized that fisheries and aquaculture are important contributors to the national economies of some APFIC member countries, especially those in the Asian region. In value terms, fish products are also the most heavily traded natural food commodity in the world and trade issues involving fish are becoming increasingly important.
Based on 2004 data, it has been estimated that Asia and the Pacific region is one of the heaviest fished areas in the world (Map A). Part of this effort can be handled by a highly resilient and productive ecosystem, but signs of overfishing are becoming more and more apparent in the region. The high mobility of regional fisheries fleets has so far kept the production high, but the unexploited areas are becoming fewer and fewer.
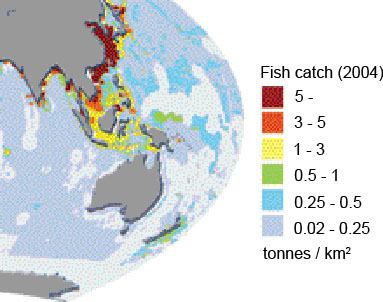
Map A:Fish catch (tonnes) by square kilometre, modified from UNEP. 2008.In dead waters.
Table 1 Contribution of capture fisheries and aquaculture to GDP (2006). Production value as percent of GDP2
Capturefisheries |
Aquaculture | ||
Marshall Islands |
62.8 |
Viet Nam | 16.0 |
| Kiribati | 57.7 |
Myanmar | 8.8 |
| Vanuatu | 37.6 |
Lao PDR | 4.4 |
| Maldives | 26.6 |
DPR Korea | 2.4 |
Solomon Islands |
14.9 |
China | 2.3 |
| Tuvalu | 13.6 |
French Polynesia |
1.9 |
| Cambodia | 11.4 |
Bangladesh | 1.9 |
| Myanmar | 9.9 |
Philippines | 1.5 |
| Viet Nam | 9.5 |
Cambodia | 1.3 |
| Micronesia | 7.0 |
Thailand | 1.3 |
Papua New Guinea |
4.6 |
Indonesia | 1.0 |
| Cook Islands | 3.9 |
New Caledonia | 0.6 |
| Philippines | 3.0 |
Nepal | 0.5 |
| Fiji | 2.5 |
India | 0.4 |
| Bangladesh | 2.0 |
Vanuatu | 0.3 |
| Indonesia | 1.9 |
New Zealand | 0.3 |
| DPR Korea | 1.6 |
Kiribati | 0.3 |
| Tonga | 1.6 |
Malaysia | 0.3 |
| Thailand | 1.6 |
RO Korea | 0.2 |
| Sri Lanka | 1.3 |
Iran | 0.2 |
| Lao PDR | 1.3 |
Pakistan | 0.2 |
| Malaysia | 1.1 |
Sri Lanka | 0.2 |
| Palau | 1.1 |
Japan | 0.1 |
| China | 0.9 |
Fiji | 0.1 |
| New Zealand | 0.7 |
Australia | 0.1 |
| India | 0.5 |
Brunei | 0.1 |
Table 2 Top five trading states in 2006 (World)
Import |
Export | ||
US$ |
US$ | ||
| Japan | 14 259 |
China | 9 150 |
| USA | 13 400 |
Norway | 5 544 |
| Spain | 6 378 |
Thailand | 5 245 |
| France | 5 109 |
USA | 4 190 |
| Italy | 4 746 |
Denmark | 3 999 |
Although not fully recognized as a major con-tributor to gross domestic product (GDP) in many countries, fisheries and aquaculture production is an important contributor to many national economies across Asia and the Pacific region.
Estimates of the capture production value3 indicate that the contribution of capture fisheries to GDP accounts for more than one percent in many states in the region (Table 1). In particular, the fisheries sector plays a critical role in contributing to the national economies of small island developing states (SIDS). The economic contribution of capture fisheries production is less in Southeast and South Asian states, yet eleven of these states have fisheries that contribute more than one percent of GDP. It is worth noting that these figures for the value of capture fisheries are probably underestimated and do not adequately account for the artisanal part of the sector, especially of the inland sector. Overall it is clear that more policy attention should be paid to this important production sector and this issue will be explored further in Chapter 3. Aquaculture also makes an important contribution to GDP in the Asian region and it is increasing. In Asian and Pacific states, aquaculture production accounts for over one percent of GDP in eleven states. Statistics related to export income from aquaculture products are not generally available and this affects the estimation of the contribution to foreign currency earnings through exports of aquaculture products.
It can be seen that some of the states referred to under "Aquaculture" in Table 1 export considerable amounts of seafood products (Tables 2 & 3), many of which are aquaculture products, particularly shrimp. China is an exception in this case, since the majority of aquaculture products it produces are consumed domestically. Still, China is the biggest exporter in the world and there is an increasing trend towards export-focused products.
It should be noted that besides making a considerable contribution to the national economies in terms of earnings from export of products from fisheries and aquaculture, these figures often mask the real importance to the national economy in terms of poverty alleviation and nutritional benefits.
There is only limited information available on employment in fisheries and aquaculture in Asia and the Pacific region and only a few states report the number of fishers and fish farmers. Despite this, there are clear indications that fisheries and aquaculture play a substantial role in providing vital income generation opportunities to the people of the region.
FAO (2006)4 estimated that Asia accounted for 87 percent of the total global number of persons engaged in fisheries and aquaculture production (total 41.4 million). China, the country with the highest number of fishers and fish farmers, had an estimated 13.0 million engaged in fisheries in 2004, accounting for 31.4 percent of the world's total. In Indonesia, 6.2 million people were directly engaged in fishing and fish farming. These figures typically represent full-time fishers and those for whom fishing is a highly significant activity and also full-time aquaculture farmers. The figures for people involved in fisheries seasonally or as a supplemental part of a more diverse livelihood (i.e. occasional fishers) are difficult to estimate and are often not even recorded. Figures, therefore, represent lower thresholds.
Although the number of people employed in fisheries and particularly in aquaculture has increased in several countries in the region, the number in developed countries has declined (e.g. Japan recorded a decline of 58 percent between 1970 and 2004). In addition to those people involved directly in the primary production sector, there are a number of people who are engaged in the supporting industries of fisheries and aquaculture such as boat building, ice making, feed manufacturing, processing, marketing and distribution of fisheries and aquaculture products. As demand outstrips supply, the price of fish is increasing worldwide and fish is becoming a "cash crop". In many cases, the more marketable fish are being sold to provide income that is used to purchase other more affordable food items. Fisheries and aquaculture therefore both help to secure nutritious food for rural and coastal populations and alleviate their poverty.
Table 3 Top ten seafood trading states in 2006 (APFIC region)
Import |
Export | ||
US$ |
US$ | ||
| Japan |
14 259 |
China |
9 150 |
| China |
4 189 |
Thailand |
5 245 |
| RO Korea |
2 768 |
Viet Nam |
3 363 |
| Hong Kong SAR |
2 058 |
Indonesia |
2 020 |
| Thailand |
1 573 |
India |
1 769 |
| Australia |
933 |
Japan |
1 457 |
| Singapore |
757 |
Taiwan POC |
1 442 |
| Malaysia |
580 |
RO Korea |
1 049 |
| Taiwan POC |
580 |
Australia |
940 |
| Viet Nam |
281 |
New Zealand |
876 |
China has been the top exporter in the region since 1999, with exports reaching US$9 200 million in 2006. Thailand is the second largest exporter, followed by Viet Nam exporting US$5 200 million and US$3 300 million tonnes respectively in 2006 (Table 3). Of these exports, the main commodities (by value) are: fish fillets, shrimps and prawns and molluscs (China); shrimp and prawns and tuna (Thailand); shrimp and prawns and catfish fillets (Viet Nam) and shrimp and prawns (Indonesia and India). Within the region, Japan is the main market followed by China, Republic of Korea and Hong Kong SAR.
Within the top ten states in the region, exports totalled US$27 300 million, whereas imports totalled US$28 000 million. Many of the countries now import large quantities of fish meal. The top five fishmeal importing countries in the region are China, Japan, Taiwan POC, Indonesia and Viet Nam (a total of 1.8 million tonnes) whereas the top five fishmeal exporting countries are Thailand, Viet Nam, Malaysia, New Zealand and Japan (a total of 0.17 million tonnes). Hence there is a net import of fish meal to the region to fuel its aquaculture growth.
Many developing countries have now become net exporters of fish, rather than net importers, a trend most evident in the Southeast Asian region. In contrast, the quantity of imported fisheries products in China exceeded that of exported products in 2006 (Figure 1); however, China achieved a remarkable trade surplus of US$5 800 million from fisheries products, which is an increase of more than US$2 000 million from 2002. This is indicative of the strong value adding that occurs in the process.
Trade for fish is particularly important in SIDS where land-based resources are very limited, e.g. the contribution of fisheries products can be as high as 80 percent of total exported commodities of these states. Other countries with a high trade surplus are the big net exporters such as Thailand, Viet Nam, Indonesia and India.
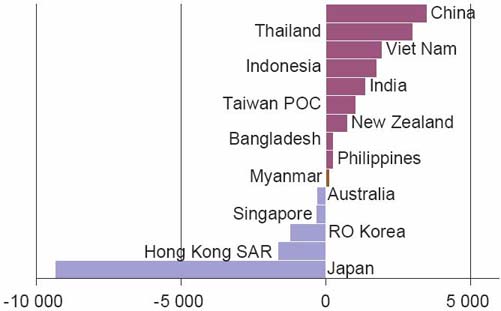
Figure 1 Net exporters (red bars) and net importers (blue bars) of fishery and aquaculture products in the APFIC region for 2006 (in millions of US$).
Importance of the fisheries sector in poverty alleviation
Although rapid economic growth in the region, especially in India and China, has lifted a large number of people out of poverty, 34 and 10 percent of Indian and Chinese populations, respectively, still live below the US$1 a day level.5 Bangladesh, Cambodia, Lao PDR and Nepal are other countries in the region that still have a high percentage of the population living below US$1 per day (43, 34, 27 and 24 percent respectively). Almost all analyses of poverty alleviation conclude that economic growth by itself will not be sufficient to alleviate poverty and reduce food insecurity, and that it must be accompanied by targeted pro-poor interventions. In this context, FAO6 advocates a vision in which the potential of small-scale fisheries to contribute to sustainable development is fully realized. FAO recommends greater emphasis on legislation and policy to support the poor and advocates: (i) better management that includes managing small-scale fisheries; (ii) making markets work for the poor; (iii) financing poverty alleviation programmes; and (iv) appropriate information, research and communication.
Importance of fish in human nutrition
In a few countries in the world, fish consumption can contribute up to 180 kcal per capita per day, but reaches such high levels only where there is a lack of alternative protein foods grown locally or where there is a strong preference for fish, e.g. Japan and some small island states.7 In industrialized countries, fish provides on average 20 to 30 kcal per capita per day. Additionally, fish proteins are essential in the diet of some densely populated countries where the total protein intake level is low, and are very important in the diets of many other countries. The fact that fish is of high nutritional value is well known. Less well known is the significant contribution that it makes to the diet of many fish-consuming communities in both the developed and developing world. Fish, especially marine fish, provides high quality protein and a wide variety of vitamins and minerals, including vitamins A and D, phosphorus, magnesium, selenium, and iodine. Fish is also a valuable source of essential fatty acids and its protein is easily digestible.
Even in small quantities, fish can have a significant positive impact on improving the quality of dietary protein intake by complementing the essential amino acids that are often present in low quantities in the rice and vegetable diets typical of many developing states. In particular, fish is a rich source of lysine which is an essential amino acid that is often deficient in rice diets with little animal protein.
Recent research shows that fish is much more than just an alternative source of animal protein. Fish oils in fatty fish are the richest source of a type of fat that is vital for brain development in unborn babies and infants. This makes all fish and especially fatty fish, such as tuna, mackerel and sardine, particularly good components of the diet of pregnant and lactating women. It is therefore apparent that fish makes a valuable contribution to the nutritional quality of the diets of the populations of many developing countries in Asia and the Pacific region.
One disconcerting point in relation to the above mentioned benefits is recent reports that the usage of vegetable oil in feeds instead of fish oil has meant a 50 percent reduction in Omega-3 fatty acids (DHA and EPA) in some cultured products.8 The same report also concluded that this reduction affected a number of known risk factors for heart diseases. Moreover, a higher fatty content of fish means a higher risk (prevalence) of stored toxins (e.g. heavy metals). The main source of mercury exposure, especially in populations that rely heavily on consumption of predatory fish, is consumption of contaminated fish and shellfish.9 Hence, the pros and cons of the fatty content of fish are still debated. However, more recently several health departments have concluded that the benefits of seafood consumption greatly outweigh the risks.
2 ESCAP's Statistical Yearbook for Asia and the Pacific 2007. Available from http://www.unescap.org/stat/data/syb2007/
3 The data to quantify the value of capture production is not readily available for many states. As an indicative figure, a unit value of US$1.0 per kg was applied for this estimation of capture production value.
4 FAO SOFIA, FAO, Rome, 2006
5 ESCAP's Statistical Yearbook for Asia and the Pacific 2007. Available from http://www.unescap.org/stat/data/syb2007/
6 FAO. 2005. Increasing the contribution of small-scale fisheries to poverty alleviation and food security. FAO Technical Guidelines for Responsible Fisheries 10.
7 http://www.who.int/nutrition/topics/3_foodconsumption/en/index5.html
8 Sverre Seierstad.2008. PhD dissertation, 2008 Veterinary University of Norway.
9 http://www.who.int/phe/news/Mercury-flyer.pdf
![]()
![]()
![]()