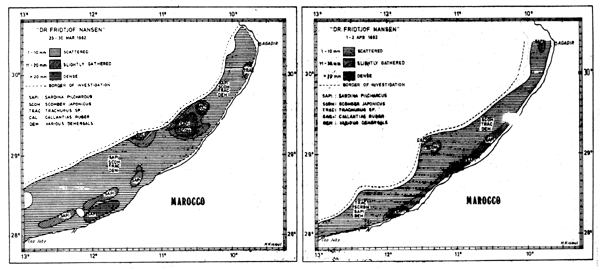
The region was covered twice in the period March 23 – April 3 1982. The first coverage was the most intense including all the sampling work and some acoustic experiments, while the second was carried out with a more open survey grid en route from Agadir to Tenerife. The primary objective of the second coverage was to get a second independent acoustic estimate, but also to check if the distribution pattern had changed significantly in the short period between the two surveys.
The fish distributions found during the two coverages are shown in Figure 44. The main species caught in the trawl are given in the maps and the three levels of density shown correspond roughly to 14–140, 140–280, and more than 280 tonnes/nm2.
As can be seen from the figures, the distribution pattern changes significantly between the two surveys as the pilchard (Sardina pilchardus), previously a dominant species in the area, had moved shoreward during the last survey and was only partially covered by the vessel's sampling track. This feature also affected the second acoustic estimate significantly and made the two estimates statistically incomparable in terms of sampling errors.

Fig. 44 Fish distribution from Cape Juby to Agadir Mar 23– 30 (left) and Apr 1–3 (right) 1982.
The biomass estimates were as follows (thousand tonnes):
| Sardina pilchardus | Scomber japonicus and Trachurus trachurus | Other fish | Total | |
|---|---|---|---|---|
| 1 coverage | 330 | 340 | 80 | 750 |
| 2 coverage | 180 | ® | 190 | 370 |
As already mentioned we consider the first coverage the most representative for the biomass in the area in that it was both the most detailed survey, and also that it seemed to include most of the biomass, while the second coverage seems to have omitted considerable quantities in the shallow areas. During the second coverage the chub mackerel (Scomber japonicus ) was more dispersed and it was difficult to assess its share of the integrated densities as it frequently occurred together with other fish. Consequently the mackerels are included in the “Other Fish” estimate for the second coverage.
Again we like to stress that, as mentioned several times earlier in the report, the group estimates are only to be interpreted as indicative, while we put higher reliance in the total estimates.
The close to 50% reduction in the total between the two surveys may only be partly explained by the loss of fish into the shallow waters. Another important factor seems to be that due to the open survey grid during the second coverage, considerable aggregates of fish seem to have been overlooked by the sampling track.
On the basis of our findings we assume the total biomass in the area surveyed to have been in the order of 750 thousand tonnes. Of this about 90% is made up of about equal shares of pilchard and mackerels (including horsemackerels), while the remaining 10% are allocated to other fish. Of the 80 thousand tonnes classified as “Other Fish”, 55 thousand tonnes are made up of Calanthias ruber, along the shelf edge. Apart from this the group on the basis of the very few bottom trawls carried out (3), consists mostly of various seabreams (Sparidae) and john dory (Zeus faber). See also Annexes II, III and V for further data from the catches.
During the survey the main part of the fishing fleet was concentrated in the northern area while the considerable resources in the south seemed virtually unexploited.