C. LEGER
Nutrition is the study of interactions between food and animals; therefore to study correctly nutrition, it is necessary to have a good knowledge of both the food and the animal, in this case, fish. It is necessary to know the metabolism of fish and, speaking about lipids, the metabolism of lipids.
Not alone is metabolism involved, but also the cell structures of the animals.
Lipids are not only a source of energy (fuel) but also important elements of cell structure and, sometimes, they can become essential as they are not completely synthetized by the organism.
Lipids are schematically shown in figure 1.
Triglycerides are formed by a molecule of glycerol and by 3 fatty acids; their position on the molecule of glycerol is of importance and must not be neglected. Triglycerides are the primary energy deposits of animals.
Phospholipids are also formed by a molecule of glycerol, by 2 fatty acids in position 1 and 2 and a phosphate having 4 possible bases: Choline, Serine, Ethanolamine and Inositol.
Sphyngophospholipids, glycophospholipids and waxes also exist. The latter are a very important source of nutrients for certain marine fish because they are present in copepods. We will see later on that waxes are molecules with the same functions as triglycerides. They are also present in mullet eggs, while absent in the adult.
Triglycerides are forms of energy storage, consequently they are present in adipose tissue, when it exists and, in the case of fish, this tissue is not very frequently found, Lipids are then stored in the muscles and the liver.
Phospholipids are the main lipid constituents of cellular membranes and their functions are very important.
Figure 2 shows the de novo (bio)synthesis of fatty acids and the origin of CoA acetyl. The end product is palmitic acid which is a saturated fatty acid with 16 carbon atoms, which can be elongated into stearic acid with 18 atoms of carbon.
The animal and fish synthetize both palmitic and stearic acid. The latter can be converted into oleic acid (figure 3).
Oleic acid has 18 atoms of carbon and one double bound in position 9 (n-9, the 9th carbon from the methyl end).
This bioconversion (desaturation) is possible in all animals.
Linoleic acid is a fatty acid with 18 atoms of carbon and 2 double bounds in position n-9 and n-6; but this form is not synthetized by animals. Generally speaking, for animals, it is impossible to insert double bounds in position n-6 and n-3. This impossibility makes these fatty acids essential.
Animals have 3 series of polyunsaturated fatty acids (P.V.F.A): the n-9 series (oleic series), the n-6 series (linoleic series), and the n-3 (linolenic series); only the oleic series is synthetizable by animals (figure 4).
There are two sorts of enzymes of bioconvergion: elongases and desaturases (figure 5), Desaturases prefer the more unsaturated forms, this notion of competition is very important. Consequently 9, 6, and 5 desaturases may be regulated physiologically by the food, in relation to the type of lipids found present in the latter. For example, this means that if we have a food with both n-3 and n-6 fatty acids, the 6 desaturase action is decreased along with the whole de nova biosynthesis which is also repressed when greats amounts of P.U.F.A are found present in the food (figure 6).
Glycerol may be derived through the degradation of glucose, or the hydrolysis of triglycerides. Triglycerides are hydrolized in monoglycerides which can synthetize other triglycerides or phospholipids.
The bases which are present in phospholipids may be derived from other phospholipids or may be synthetized from glycine (figure 7). A second way for the Choline synthesis requires the presence of both ethanolamine and methionine which are furnished by food alone.
Figure 8 shows the role of lipids.
Fatty acids are important sources of energy and they can also have a structural role in phospholipids.
Phospholipids have an important role in membrane structure.
P.U.F.A. are also precursors of hormone like substances. This must be taken into account especially during the reproduction period of fish (figure 9).
3.1. Lipid body partition
Figure 10 gives a classification of fish depending on their lipid content. It can be remarked that there is a reverse relation between the lipid content in the liver and that in the muscle. When there is high lipid content in the muscle that of the liver is low (figure 11).
Figure 12 shows some characteristics of the fatty acid composition of fish. The content of n-3 fatty acid is very high in all fish. There is a slight difference between marine and freshwater fish, in n-6 fatty acid (higher in the latter). Exceptionnaly high contents of n-6 fatty acids exist in Tilapia/oreochromis.
There exists an important correlation between the percentages of total lipid content and triglycerides.
In figure 13, the graphic shows that when the total lipid content rises, the phospholipid content remains at a low level while the triglyceride content increases. In other words, high contents in total lipids are mainly represented by triglycerides; phospholipids which are structural elements remain quite at the same level. Thus, a fatty fish will mainly contain triglycerides.
Between marine fish, there are also some differences in the fatty acid composition. Some fish, such as anchovy, sardine, etc... are very rich in n-3 fatty acids while others (such as herrings, etc.. )have lower content in n-3 fatty acids and increased amount of 20: 1 and 22: 1 (figure 14); the reason for this is still unknown.
Mugil cephalus (mullet) presents the peculiarity of having n-8 fatty acids (figure 15), perhaps the origine comes from food, but it has not been clearly defined as yet.
Natural food plays an important role in fatty acid composition; an importnat difference exists in captain in summer and winter (figure 16). This does not apply exactly for other fish (figures 17. 18, 19). In fact, there are differences in eicosapentaenoic and docosahexaenoic acids but no relevant differences in the total n-3 fatty acids are remarked. In the same way, it is natural that fatty acid composition also depends on the geographic origin (figure 18)
There also exist differences in the fatty acid composition of phospholipids and triglycerides. Phospholipids are more unsaturated than triglycerides (figure 20). Thus as fish oils are principally sources of triglycerides, they are relatively less unsaturated than fish meals.
3.2. Lipid structure and metabolism
Triglycerides
The structure of triglycerides is the partition of fatty acids between the 3 positions of glycero-alcohol functions. In general, mammals have triglycerides containing saturated fatty acids in position 1.3 and unsaturated fatty acids in position 2 of glycerol. The triglycerides structure is similar in trout. It can be obtained even if the food triglycerides have the inverse structure. Accordingly, there is a complete hydrolysis and re-synthesis of triglycerides.
It is very important to stress that fish do not conserve the fatty acid in position 2 of triglycerides. This is in complete contrast to all that has been assumed up to present. In terms of metabolism; there are two possible pathways for the passage of triglycerides: the monoglyceride pathway and the L glycerophosphate pathway. Fish do not conserve the fatty acid in position 2 and this means that the L glycerophosphate pathway is more important in fish enterocyte.
Wax esters (mainly present in the eggs of mullet) present: partition between saturated and unsaturated chains which are very similar in acid and alcohol moieties and large amounts of odd chains.
Alkyl diacylglycerol and 1 alkenil 2, 3 DAG
| C - R1 | - O - CH = R2 |
| O - CO - R' | - O - CO - R' |
| O - CO - R'' | - C - CO - R'' |
They are present in very large amounts in the liver and the muscles of Squalus acanthias and they are minor components of the liver and muscle in fish, receptively.
Phospholipids, as in other animals, teh fatty acid composition depends on: - Phospholipid class (ex. phosphatidlethanolamine is more unsaturated than phosphatidcholine)
- Type of membrane
- Tissue
- Species
- Food (This is very important. The influence of food on the composition of triglycerides is well known, but food can also have an influence on the fatty acid composition of phospholipids, thus consequently, on the membrane structure and the physiological activities of the membrane. The unsaturation rate of phospholipids has an effect on the fluidity of the membrane and consequently on the biological activity of the membrane proteins).
- Environmental conditions, in particular, temperature and salinity. Low temperatures increase the degree of unsaturation (with n-3 and/or n-6 which increase). High salinity increase the rate of 22; 6 n-3 (figures 21, 22).
But when very specialized membranes are observed, no particular differences between animals exist (ex. rod cell of the retine). In the case of the brush border membrane of enterocyte, very important difference exist. In very specialized membranes differences or no differences in composition could exist between species (figures 23, 24).
An essential element is an element which is physiologically indispensable and which is not completely synthetized (de novo synthesis) by the organism.
| WHERE ARE THE FATTY ACIDS DERIVED FROM WHICH | ARE INCORPORATED IN THE CELL ? |
| WHAT FATTY ACIDS | |
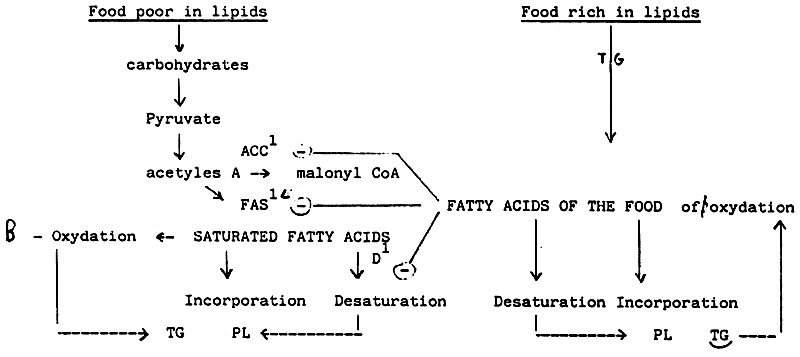 | |
| Principal neosynthetized fatty acids which are incorporated: 16: 0, 18: 0, 18: 1 n-9 | Principal fatty acids of the food which or incorporated: 16: 0, 18: 0, 18: 1n-9, 18: 2n-6, 18: 3n-3, 20: 4n-6, 20: 5n-3, 22: 6n-3, |
1. ACC = Acetyl CoA carboxylase
FAS = Fatty Acids Synthase
D = Δ 9 desaturase
Figures 25, 26, 27 show schematically the progression of ingested lipids and fatty acids from food to tissues.
Triglycerides enter into special structures, called chylomicrons, which are lipoproteic structures, then a very complex process for the transport of fatty acids in the blood stream starts.
Figure 28 shows the pathway of phospholipids synthesis. The most important stage is that of phosphatidic acid, which is derived from glucose and L glycerophosphate. There are some differences for the synthesis of the different phospholipids. It must be underlined that food influences the fatty acid composition of both phospholipids and triglycerides.
Figures 29, 30, 31 show some examples of this influence and stress the concept that the bioconversion of fatty acids which are incorporated into the phospholipids is very important.
Lipids are very important for both energetic and structural purpose. But :
Some example of lipid components belonging to point 2 are: glycerol, serine, ethanolamina, saturated fatty acids, monounsaturated fatty acids. Examples of point 3 are: polyunsaturated fatty acids from the n-3 or n-6 series (They are also essential for the synthesis of some hormone like substances), probably inositol and choline.
Figure 32 Shows the Essential Fatty Acid (E.F.A.) requirements in trout.
The presence in the food of mixture of P.U.F.A has a favourable effect. All fish cannot be compared with trout (figure 33). The main difference is for the unfavourable effect of linoleic acid. For some marine fish, such as the red sea-bream and turbot, the presence of the precursor of the n-3 series is not efficient because the bioconversion in this fish is impossible, or possible at very low rates The efficiency of the bioconversion is around 1 – 5%.
A particular case is seen with Tilapia, which need only n-6 fatty acids. This is very important from an economic view point, because the vegetable oils are cheaper and more available than those derived from fresh which are necessary for the other fish.
Figure 34 shows some requirements of “semi-essential” components. It is possible that the efficiency of the conversion of serine and ethanolamine in choline is very low in fish and crustaceans.
A good diet formulation concerning the required E.F.A. supply by food is very important, particularly in:
- vitellogentic females
- at early stages of fish development.
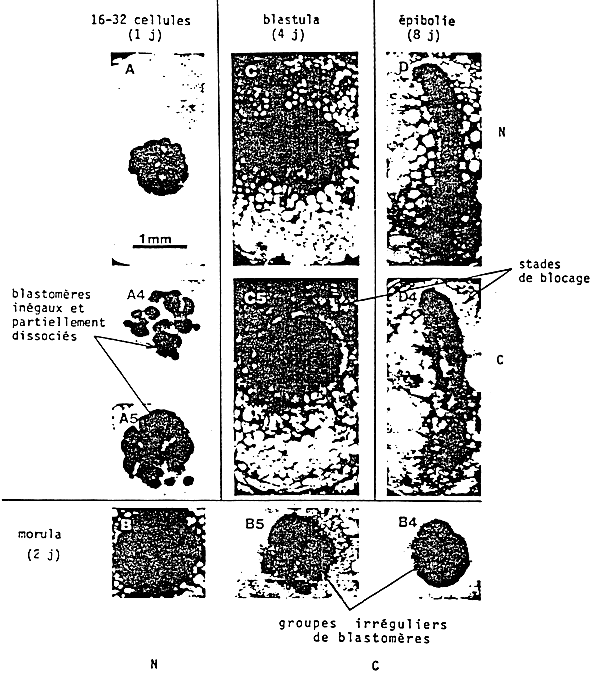
A deficient diet produces important disorders in embryo (figures 35, 36) and can result in a decreased hatching ratio and larva abnormalities.
FIGURE 1
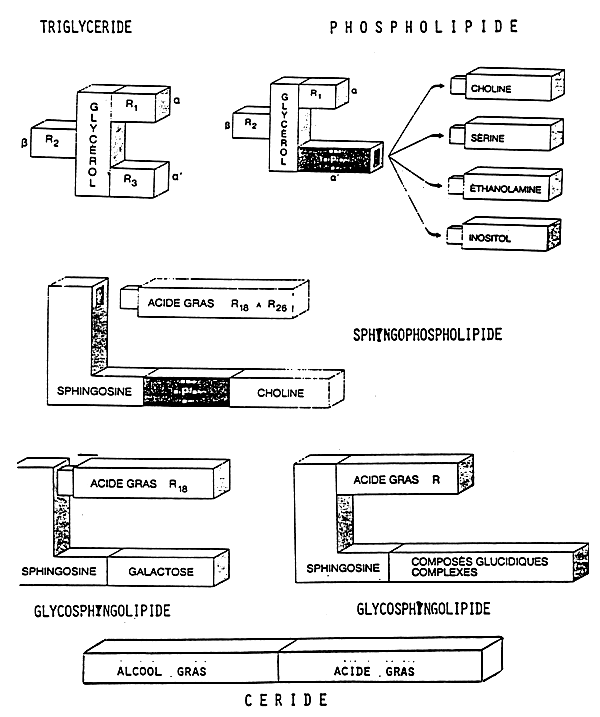
FIGURE 2
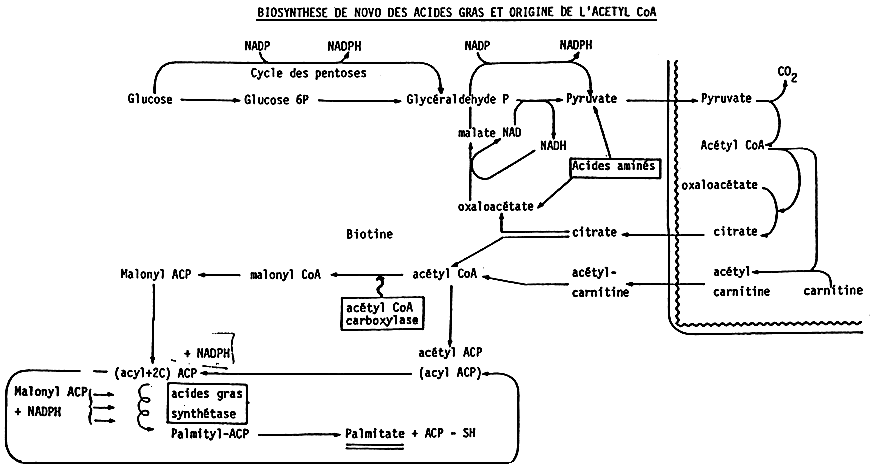
FIGURE 3
PRINCIPAL FATTY ACIDS
OF ANIMAL ORIGIN
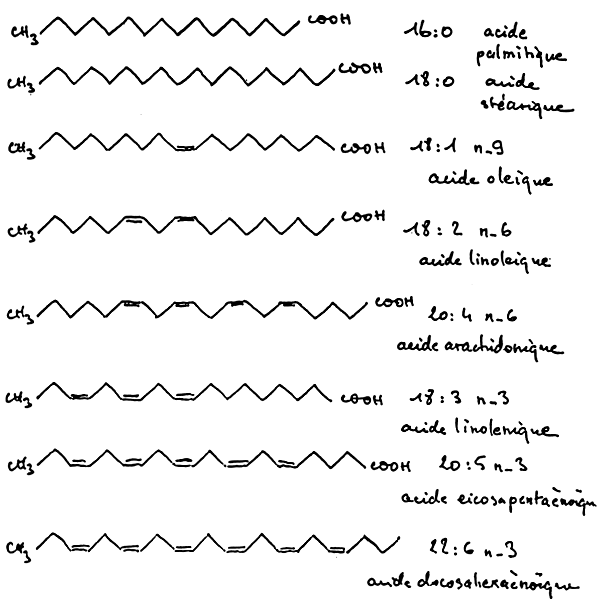
FIGURE 4
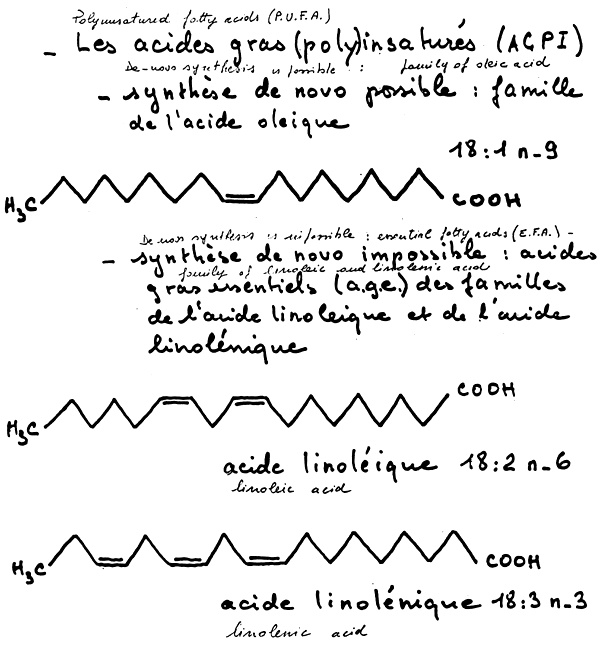
FIGURE 5
BIOCONVERSION DES ACIDES GRAS INSATURES:
ELONGATIONS ET DESATURATIONS
| 9-Dase* | 6-Dase** | 5-Dase | 4-Dase | ||||||
| n-9 | 18:0 | —→ | 18:1 | —→ | 18.2 | ||||
| 20:1 | → | 20:2 | —→ | 20:3 | |||||
| 22:3 | —→ | 22:4 | |||||||
| n-6 | 18:2 | —→ | 18:3 | ||||||
| 20:2 | → | 20:3 | —→ | 20:4 | |||||
| 22:3 | 22:4 | —→ | 22:5 | ||||||
| n-3 | 18:3 | —→ | 18:4 | ||||||
| 20:3 | → | 20:4 | —→ | 20:5 | |||||
| 22:4 | 22:5 | —→ | 22:6 | ||||||
| n-5 | 14:0 | —→ | 14:1 | ||||||
| 16:1 | → | 16:2 | * —→ | ** —→ | |||||
| 18:1 | 18:2 | ||||||||
| 20:2 | 20:3 | 20:4 | |||||||
| n-7 | 16:0 | —→ | 16:1 | —→ | 16:2 | ||||
| 18:1 | → | 18:2 | —→ | 18:3 | |||||
| 20:1 | 20:2 | 20:3 | —→ | 20:4 | |||||
| n-8 | 17:0 | —→ | 17:1 | —→ | 17:2 | ||||
| 19:1 | → | 19:2 | —→ | 19:3 | |||||
| 21:1 | 21:2 | 21:3 | —→ | 21:4 | |||||
| n-11 | 20:0 | —→ | 20:1 | —→ | 20:2 | ||||
| 22:1 | → | 22:2 | —→ | 22:3 | |||||
| 24:1 | 24:2 | 24:3 | —→ | 24:4 | |||||
→ 8-désaturase
—→ 9-désaturase, 6-désaturase ou 3-désaturase déplacement de haut en bas dans chaque famille: é longations
FIGURE 6 - REGULATIONS DES Δ 9-, Δ 6-, Δ 5 Dases
| ENZYMES | DEPRESSEURS | ACTIVATEURS |
Δ 9 Dase | A.G.E. Lipides alimê | Règ. riche en glucides et pauvre en lipides carence en A.G.E. |
Δ 6 Dase | A.G.E. glucose (diabàte) carenee frofaique âge | Carence en A.G.E proteines insuline |
Δ 5 Dase | carence en A.G.E. glucose | A.G.E. |
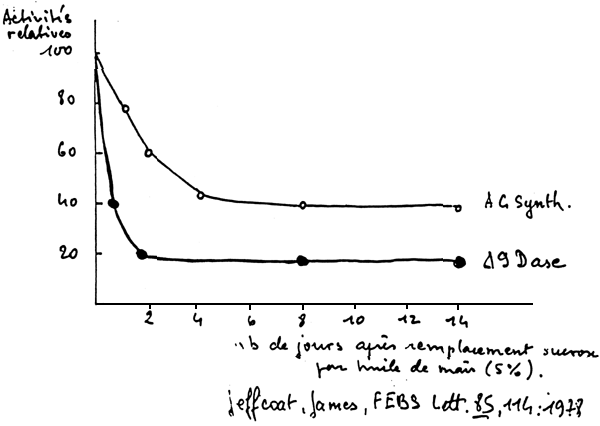
FIGURE 7- ORIGIN OF GLYCEROL AND PHOSPHOLIPID BASES
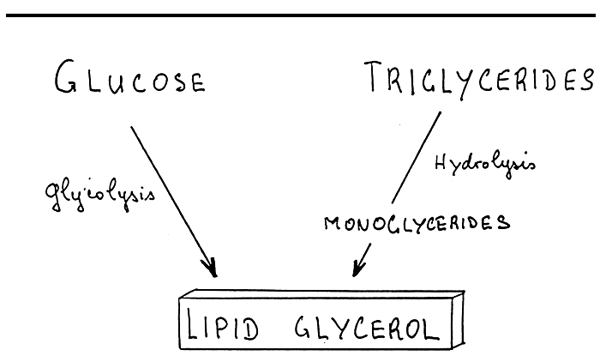
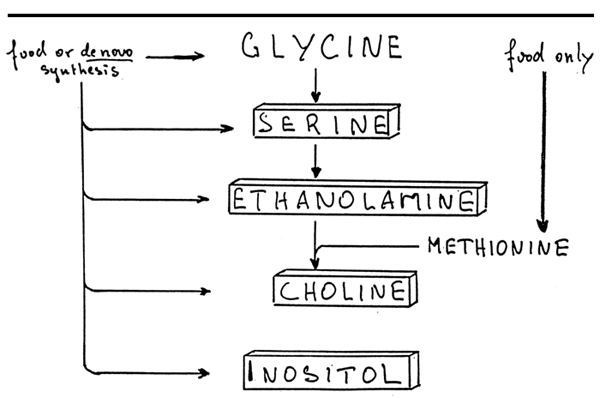
FIGURE 8
| ROLES DES LIPIDES | |
| TRIGLYCERIDES |  ACIDES GRAS ACIDES GRAS  ENERGIE: ATP ENERGIE: ATP |
| ALKYLDIACYGLYCEROLS | |
CERIDES (WAX ESTERS)  | |
| PHOSPHOLIPIDES |  STRUCTURES CELLULAIRES STRUCTURES CELLULAIRES |
| HETEROLIPIDES NON PHOSPHORES | |
| STEROLS ET STERIDES | |
HYDROCARBURES  |  FLOTTABILITE ? FLOTTABILITE ? |
FIGURE 9: ROLE DES ACIDES GRAS
| De 16: 0 | à 22: 6 n - 3 | |
| COMBUSTIBLE | 0,50 à 0,52 | moles ATP/G AG |
| (130 à 169 utilisant: | moles ATP/ mole AG) | |
| 88 à 90 moles O2/ G. AG | ||
| (23 à 29 moles O2/ mole AG) | ||
| STRUCTURAL | Tous, mais AGE non synthetisés | |
| PRECURSEUR | De dérivés oxygénés (PG, TX, PGI) | |
| (hydroxy et hyperoxy-lineaires) Lemotriènes) | ||
| à activité quasi hormonale | ||
| Les AGPI (AGE + AGPI n - 9 uniquement | ||
FIGURE 10: POISSONS CLASSES D'APRES LEUR RICHESSE EN LIPIDES TOTAUX (TG + PL)
| CLASSE | % de lipides dans le muscle | POISSONS |
| I | 5 % | More, Colin, Mulet, Bar Lieu jaune, Eglefin, Flétan, Daurade |
| II | 5 – 15 % | Maquereau, Hareng, Sardine, Menhaden, Capelan, Chinchard, Pilchard, Anchois |
| III | 15 % | Les poissons de la Classe II passent quelquefois en Classe III |
Tableau inspirè de STANSBY (1969)
| I | Cod, Saithe (for Cod steaks), Hake, Mullet, See-bass, Pollack, Haddock, Halibut, Sea-bream |
| II | Mackerel, Herring, Sardine, Menhaden, Capelin, Horse mackerel, Pilchard, Anchovy |
| III | Sometimes class II fish become class III fish. |
FIGURE 11
RELATION INVERSE ENTRE TENEURS EN LIPIDES DU MUSCLE
| Poisson | Lipides du music (%) | Lipides du foie (%) |
| Morue | 0,4 (a) | 50 – 75 (b) |
| Eglefin | 0,3 (a) | 50 – 75 (b) |
| Bar (c) | 1 – 5 | 7 – 20 |
| Hareng (d) | 11 | 2 |
| Maquereau (d) | 13 | 8 |
| Saumon (Atlantique) (d) | 15 | 7 |
(a) D'après STANSBY (1953)
(b) D'après BRODY (1965)
(c) D'après STEFAN et METAILLER
(d) D'après BRAEKKAN (1959)
FIGURE 12
COMPOSITION CARACTERISTIQUE DES POISSONS*
| Acides gras | Poisson de mer | Poisson d'eau douce |
| 16:0 | 10 – 30 | 10 – 20 |
| 16:1 | 2 – 11 | 7 – 11 |
| 18:0 | 2 – 6 | 3 – 4 |
| 18:1 | 12 – 28 | 18 – 28 |
| 18:2 | 1 – 3 | 4 – 6 |
| 18:3 | 0,5 – 1,2 | 3 – 5 |
| 19:0 | 0,5 – 2 | - |
| 20:1 | 1 – 10 | 1 – 3 |
| 20:4 | 0,5 – 4 | 2 – 4 |
| 20:5 | 5 – 14 | 5 – 7 |
| 22:1 | 1,5 – 3 | 0,5 – 3 |
| 22:5 | 0,6 – 2 | 2,5 – 4 |
| 22:6 | 8 – 20 | 8 – 20 |
| Σ ω5 | 1 – 5 | 6 – 10 |
| Σ ω3 | 15 – 35 | 16 – 35 |
FIGURE 13
CORRELATION ENTIRE % LT ET LES % DE
PL ET DE TG DANS DIFFERENTS TISSUS
ET CHEZ DIFFERENTES ESPECES DE POISSONS
(d'apràs OPSTVEDT)
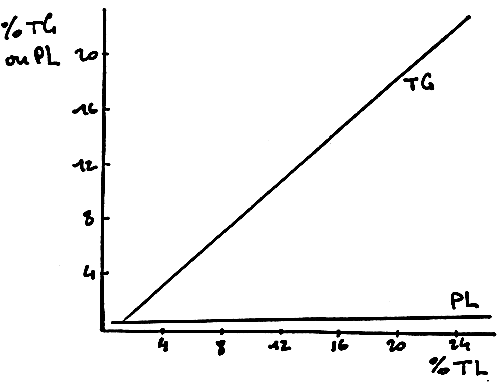
CORRELATION BETWEEN PERCENTAGES OF TOTAL LIPIDS, ON THE ONE HAND, AND PHOSPHOLIPIDS AND TRIGLYCERIDES, ON THE OTHER, IN DIFFERENT TISSUES AND SPECIES (from OPSTVEDT)
FIGURE 14
FAMILLES DE POISSONS CLASSES D'APRES LEUR RICHESSES RELATIVES EN 20: l ET 22: l, D'une PART, ET EN A.C. n-3 D'AUTRE PART
| Families | n - 3 | 20:1 | 22:1 |
| Anchors, Dilehard sardine, Chinchard menhaden | 25 – 40% | 0 – 4% | 0 – 4% |
| Hareng (atf + pac.) capelan, Maquereau Morue (foie) | 20 – 30% | 10 – 15% | 10 – 15% |
FIGURE 15
PRINCIPAUX ACIDES GRAS INHABITUELS CHEZ LE MULET MUGIL CEPHALUS *
| Acides gras | des A. G. T. | Autres acides gras prèsents ( <15 ) | |||
| 16: 0 | 11,2 | { | 15: 1ω6 | 15: 3ω3 | 15: 3ω3 |
| 15: 1ω8 | 15: 2ω3 | ||||
| 16: 3ω4 | 1,2 | { | 16: 2ω7 | ||
| 16: 2ω4 | |||||
| 17: 0 | 1,2 | { | 17: 2ω8 | ||
| 17: 4ω2 | |||||
| 17: 1ω3 | 4,6 | ||||
| 17: 2ω2,5 | 2,5 | ||||
| 17: 3ω5 | 1,2 | ||||
| 13: 1ω77 | 2,1 | ||||
| 19: 4ω5 | 1,7 | { | 19: 1ω8 | 19: 2ω7 | |
| 19: 2ω8 | 19: 2ω5 | ||||
D'après SEN et SCHLENK (1964)
FIGURE 16
| INFLUENCE DE LA SAISON DE PECHE SUR LA COMPOSITION EN.A.C. DE L'HUILE DE CAPELAN | ||
| A.G. | ÉTÉ | HIVER |
| 18: 1n-9 | 12.5 | 20.2 |
| 20: 1n-9 | 15.0 | 19.8 |
| 22: 1n-11 | 16.4 | 16.7 |
| n-6 | 2.6 | 1.8 |
| n-3 | 21.8 | 13.8 |
d'après Ackman et al, 1982
FIGURE 17
INFLUENCE DE LA SAISON DE PECHE SUR LA COMPOSITION EN A.G.D'HUILES DE POISSONS*
| A.G. | Janvier | Avril/mai |
| 14: 0 | 8 | 12 |
| 16: 0 | 16 | 12 |
| 16: 1 | 10 | 12 |
| 18: 1 | 10 | 8 |
| 20: 1 | 3 | 2 |
| 22: 1 | 2 | 1 |
| 20: 5n-3 | 21 | 31 |
| 22: 6n-3 | 14 | 6 |
FIGURE 18
INFLUENCE DE LA LOCALISATION GEOGRAPHIQUE DE LA PECHE SUR LA COMPOSITION EN A.G. D`HUILE DE POISSONS
| A.G. | Anchors Mexicains | Anchors Chilien |
| 14: 0 | 8 | 10 |
| 16: 0 | 20 | 17 |
| 16: 1 | 7 | 11 |
| 18: 1 | 10 | 7 |
| 20: 1 n-9 | 3 | 5 |
| 22: 1 n-11 | 3 | 3 |
| 20: 5 n-3 | 14 | 9 |
| 22: 6 n-3 | 12 | 4 |
| n-3 | 32 | 31 |
d'après ACKMAN, 1980, Advances in fish science and technology.
FIGURE 19
COMPOSITION EN ACIDES GRAS DU BROCHET *
| Acides gras | Testicules | Foie | |||
| TG | PL | EC | TG | PL | |
| 15: 0 | 8 | 21 | 2 | 11 | 24 |
| 15: 1 | 7 | 9 | 3 | 9 | 2 |
| 18: 0 | 1 | 5 | - | 4 | 5 |
| 18: 1 | 6 | 11 | 3 | 16 | 7 |
| 18: 2ω6 | 3 | 3 | - | 8 | 3 |
| 18: 3ω3 | 2 | 3 | - | 4 | 1 |
| 20: 4ω6 | 2 | 17 | - | 5 | 12 |
| 20: 5ω3 | 1 | 14 | - | 5 | 6 |
| 22: 5ω6 | - | 2 | - | 1 | 3 |
| 22: 5ω3 | - | 2 | - | 3 | 2 |
| 22: 6ω3 | 2 | 13 | - | 9 | 32 |
| P1C19H32O3 | 3 | - | - | 1 | - |
| P2C20H34O3 | 6 | - | - | 3 | - |
| P3C21H36O3 | 2 | - | 3 | ND | - |
| P4C21H36O3 | 15 | - | 18 | 6 | - |
| P5C22H38O3 | 12 | - | 3 | 1 | - |
| P6C23H40O3 | 30 | - | 69 | 11 | - |
FIGURE 20: FEATURES OF TRIGLYCERIDES - COMPOSITION EN A.G.n - 6 et n - 3 DES PHOSPHOLIPIDES (PL) ET DES TRIGLYCERIDES (TG) DE DIFFERENTS POISSONS
| ESPECES | n - 6 | n - 3 | ||
| TG | PL | TC | PL | |
| MENHADEN a | 2.2 | 3.9 | 25 | 32 |
| CHINCHARD b | 4.5 | 5.0 | 25 | 50 |
| HARENG c | 1.4 | 2.5 | 12 | 46 |
| CAPELAN d | 2.6 | 3.1 | 14 | 44 |
a = ACKMAN et al, 1976, J. Food sci, Agric.
b = TOYOMIZU et al, 1976. Bull. Japan. Soc. Sci. Fishes.
c = ADDITION et al, 1969, J. Fish Res. Bd Canada.
d = ACKMAN et
al., 1969. J. Fish. Res. Bd. Canada.
| COMPOSITION EN A.G.“SIMPLIFIEE” CHEZ LE CAPELAN | |||
| A.G | Capelan entier | Farine | Huile |
| 16: 0 | 11 | 16 | 9 |
| 16: 1 n-7 | 8 | 8 | 9 |
| 18: 1 n-9 | 17 | 16 | 17 |
| 20: 1 n-9 | 20 | 10 | 25 |
| 22: 1 n-11 | 15 | 7 | 20 |
| n-6 | 2 | 2 | 1 |
| n-3 | 15 | 32 | 6 |
URDAHAL et NUGARD, 1970, non publié
FIGURE 21
INFLUENCE DU MILIEU SUR LA COMPOSITION EN A.C. DES PL DE LA BB DE L`ENTEROLYTE CHEZ LA TRUITE
| PC | PE | |||
| Eau louce | Eau de mer (1 jour) | Eau doule | Eau de mer (1 jour) | |
| 16: 0 | 29 | 31 | 25 | 24 |
| 18: 0 | 22 | 12 | 24 | 16 |
| 18: 1 n-9 | 9 | 7 | 7 | 6 |
| 20: 4 n-6 | 5 | 4 | 3 | 4 |
| 22: 5 n-6 | 1 | - | 2 | 2 |
| 22: 5 n-3 | - | 1 | 1 | - |
| 22: 6 n-3 | 11 | 28 | 12 | 24 |
Ces modifications we s'accompagnent d'aucun
Changement de la repartition des classes
de PL et Ch/PL = ate
Main s'accompagnent d'une diminution de 
La “fluidite” augmente à 1 jour d'acclimatation
à l'eau de mer.
FIGURE 22: SALINITY DEPENDENT FATTY ACID COMPOSITION IN CARP.*
| U/S | n - 3/ n - 6 | ||
| Total PL | 10° C | 2.2 | 0.8 |
| 26° C | 1.8 | 1.4 | |
| PC | 10° C | 2.2 | 1.2 |
| 26° C | 1.6 | 2.8 | |
| PE | 10° C | 1.7 | 0.75 |
| 26° C | 1.4 | 1.65 | |
| * NODTKE E, 1978, Biochim. Biophys. Beta, 529, 280 – 291 | |||
FIGURE 23 COMPOSITION EN A.C DES 2 PRINCIPLES CLASSES DE PL DU SEGEMENT
EXTERNE DE LA CELLULE EN BATONNET DE LA RETINE
(In the enter segment of retina rod cell)
| PHOSPHATIDYL ETHANOLAMINE | |||
| Home | Rat | Poisson rouge | |
| 16: 0 | 9.7 | 5.5 | 6.4 |
| 18: 0 | 38.2 | 28.1 | 13.4 |
| 18: 1 n - 9 | 6.2 | 3.2 | 8.1 |
| 18: 2 n - 5 | 0.3 | 0.6 | 0.9 |
| 18: 3 n - 3 | - | - | - |
| 20: 4 n - 6 | 3.5 | 2.9 | 2.4 |
| 22: 6 n - 3 | 34.2 | 54.8 | 58.0 |
| PHOSPHATIDYL CHOLINE | |||
| 16: 0 | 32.5 | 29.5 | 29.7 |
| 18: 0 | 16.8 | 11.7 | 14.5 |
| 18: 1 n - 8 | 14.9 | 8.3 | 17.7 |
| 18: 2 n - 6 | 1.1 | 0.8 | 1.2 |
| 18: 3 n - 3 | - | - | - |
| 20: 4 n - 6 | 4.7 | 3.4 | 1.2 |
| 22: 6 n - 3 | 19.5 | 36.4 | 24 |
FRIESLER and ANDERSON, 1983, Progr. Lipid. Res 22, 79 – 131
FIGURE 24: FATTY ACID COMPOSITION OF TWO MAIN PHOSPHOLIPIDS OF INTESTINAL CELL MEMBRANE
(Brush border membrane of enterocytes)
| PHOSPHATIDYL ETHANOLAMINE | |||
| Trout | Pig | Guinea pig | |
| 16: 0 + 18: 0 | 55 | 36 | 33 |
| 18: 1 n - 9 | 1 | 12 | 5 |
| 18: 2 n - 6 | 2 | 12 | 12 |
| 20: 4 n - 6 | - | 9 | 2 |
| 22: 6 n - 3 | 31 | 5 | - |
| PHOSPHATIDYL CHOLINE | |||
| Trout | Pig | Guinea pig | |
| 16: 0 + 18: 0 | 55 | 35 | 42 |
| 18: 1 n - 9 | 14 | 17 | 7 |
| 18: 2 n - 6 | 1 | 18 | 18 |
| 20: 4 n - 6 | - | 5 | 2 |
| 22: 6 n - 3 | 23 | 2 | 1 |
FIGURE 25
PROGRESSION OF INGESTED
LIPIDS AND FATTY ACIDS
FROM FOOD TO TISSUES
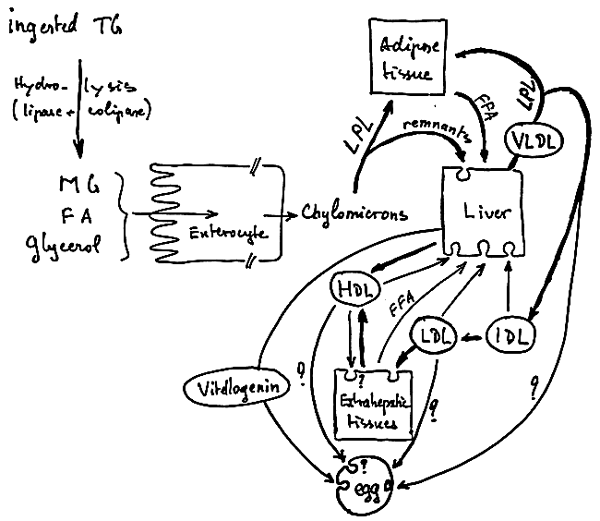
FIGURE 26
ABSORPTION DES ACIDES GRAS
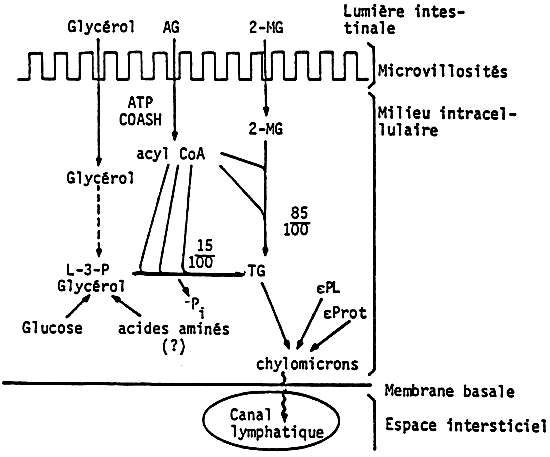
FIGURE 27
TRANSPORT, DEPOT et UTILISATION DES ACIDES GRAS
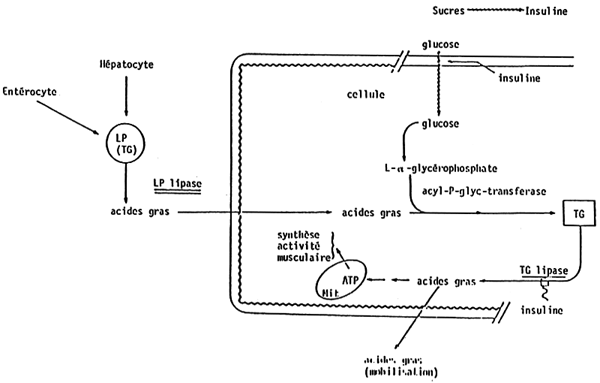
FIGURE 28
PHOSPHOLIPID SYNTHESIS
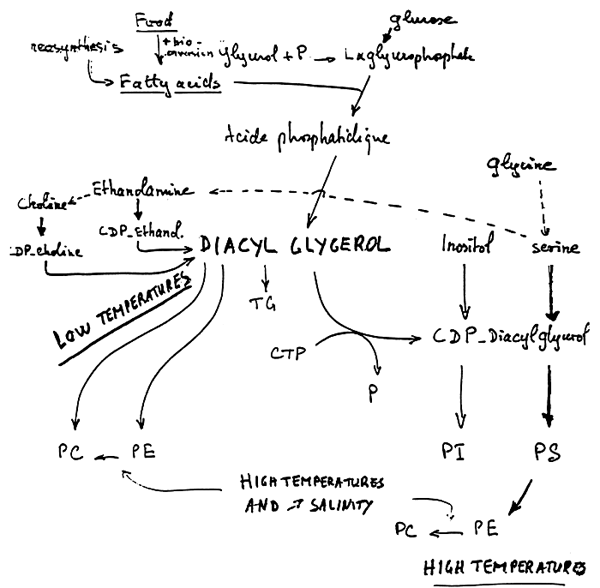
FIGURE 29
TRUITE: INFLUENCE DU REGIME SUR LA COMPOSITION EN ACIDES GRAS DU TISSU ADIPEUX PERIGASTRIQUE
| Aliment “standard” | Tissu adipeux | Aliment “saindoux” | Tissu adipeux | |
| 16:0 | 17 | 16 | 24 | 21 |
| 18:0 | 5 | 4 | 12 | 6 |
| 16:1ω7 | 5 | 6 | 3 | 10 |
| 18:1ω7 | 2 | 3 | - | - |
| 18:1ω9 | 20 | 26 | 52 | 49 |
| 20:1ω9 | 3 | 4 | 2 | 2 |
| 22:1ω11 | 3 | 2 | - | - |
| 18:2ω6 | 26 | 21 | 6 | 7 |
| 20:2ω6 | - | 1 | - | - |
| 22:4ω6 | - | 3 | - | - |
| 18:3ω3 | 3 | 2 | 1 | 2 |
| 18:4ω3 | 1 | - | - | - |
| 22:5ω3 | 2 | - | - | - |
| 22:6ω3 | 6 | 5 | - | - |
FIGURE 30
BAR: INFLUENCE DE L'ALIMENTATION SUR LES PRINCIPAUX
ACIDES GRAS DE
L'ANIMAL SAUVAGE OU NOURRI
| Alimentation “sauvage” | Alimentation “rationnelle” % lipides = 17,5 | ||
| Tissu adipeux | Aliment | Tissu adipeux | |
| 18:1ω9 | 26 | 23 | 26 |
| 20:1ω9 | 1 | 3 | 4 |
| 18:2ω6 | - | 38 | 34 |
| 18:3ω3 | - | 1 | 2 |
| 18:4ω3 | - | - | - |
| 20:5ω3 | 7 | 3 | 2 |
| 22:5ω3 | 3 | - | - |
| 22:6ω3 | 9 | 4 | 3 |
FIGURE 31
| PHYTOPLANCTON | → | ZOOPLANCTON | → | POISSON (GUPPY) | |
| CHAETOCEROS | ARTEMIA | LEBISTES | |||
| SIMPLEX | SALINA | RETICULATUS | |||
| (aliment pour A. salina) | (aliment pour L. reticulatus) | ||||
| 14:0 | 13 | 5 | 2 | ||
| 16:0 | 18 | 12 | 23 | ||
| 16:1 | 48 | 45 | 16 | ||
| 18:0 | - | 2 | 8 | ||
| 18:1 | 9 | 18 | 18 | ||
| 20:5 | - | 12 | 5 | ||
| 22:5 | - | - | 6 | ||
| 22:6 | - | - | 17 | ||
FIGURE 32
CHEZ LA TRUITE, LES A.G.E. SONT LES AG n-3
| AG | Besoins | Effet de favorable | Remasque |
| 18:3 n-3 | 1 à 2% | ≥ 3 % | 18: 3:n:3 |
| 18:2 n-6 | 0 | ≥ 2,5% | ↓ |
| 20:5 n-3 | 0.5 à 1% | 20: 5:n:3 ↓ | |
| 22:6 n-3 | 0.5 à 1% | 22:6 n-3 | |
| 20:5 n-3 | 0.5 à 1% | ≥ 2% | |
| + 22:6 n-3 |
IL EXISTE UN EFFET DE COMPLEMENTARITE
ENTRE 20:5 n-3 ET 22:6 n-3
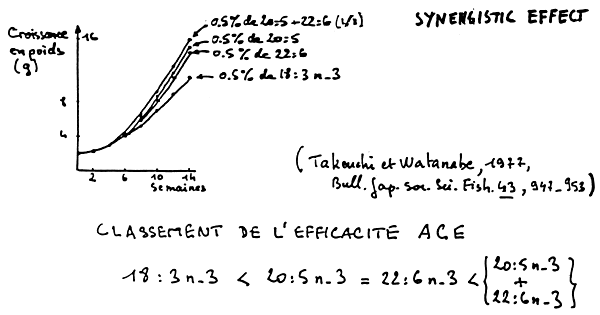
FIGURE 33
BESOINS EN A.G.E.COMPARES DE LA TRUITE ARC_EN_CIEL, LE SAUMON COHO ET LE SAUMON CHUM
EFA REQUIREMENT IN TROUT COMPARED SAIMON
| Besoins en 18:3 n-3 | Besoins en 20:5 n-3 + 22:6 n-3 | Effet du 18:2 n-6 | |
| Truite | 2% | 1% | défavorable in ≥ 25% |
| S. Coho | 2% | > 2% | défavorable |
| S. Chum | 1% avce 1% de 18: 2n-6 | 1% | favorable |
PRATIQUEMENT.…
L'aliment pour s.coho loit couteuir (p.ex.):
<10% h.depoissons
L'aliment pour s.chum loit contenir (p.ex.):
- soit 5% H. de soja ou de colza
+ 5% H. de soja de poissons
- soit 10% H. de soja ou colza
- soit 5 à 10% H. de poissons.
FIGURE 34
REQUIREMENTS IN SOME
“SEMI-ESSENTIAL” COMPONENTS
| mg/kg dry diet | Rainbow Trout | Salmon | Carp |
| Choline | Req. | 600 – 800 | 1500 – 2000 |
| tnoritol | 200 – 300 | 300 – 400 | 200 – 300 |
FIGURE 35
d'après LERAY et al., R.N.D., 25, 567: 1985
FIGURE 36
