![]()
![]()
![]()
FIGURE 7.1
District map of Kenya
The area inventory of thermal zones, pattern of growing period zones and length of growing period zones, by district was prepared at 1 : 1 million scale.
The mapped inventory was compiled by:
plotting the individual station data of temperature, pattern of length of growing period and mean total dominant length of growing period1; and
constructing boundaries of thermal zones, pattern of length of growing period zones and isolines of mean total dominant length of growing period with the values 0, 30, 60, 90, 120, 150, 180, 210, 240, 270, 300, 330, 365-and 365+ days respectively, delineating the mean total dominant length of growing period zones of 0,1–29, 30–59, 60–89, 90–119 120–149, 150–179, 180–209, 210–239, 240–269, 270–299, 300–329, 330–364, 365-and 365+ days.
In addition to normal extrapolation techniques, extensive use was made of landsat images, climatic maps, vegetation maps, land use maps, topographic maps and soil maps to guide the delineation of boundaries and isolines.
The three climatic inventories in map form, together with seven other layers (Exploratory Soil Map, land use maps, tse-tse infestation map and a district/province map) all at a scale of 1 : 1 million, were digitized by the Comprehensive Resource Inventory and Evaluation System Project (CRIES 1983) of Michigan State University (Section 9.2).
The digitized information from the maps was converted to a grid cell data base. The cell size is one squared millimetre corresponding to 100 ha.
A map of provinces and districts is presented in Figure 7.1, and their extents are presented in Table 7.1. A generalized thermal zones map is presented in Figure 7.2, and their extents are presented in Table 7.2. A generalized map of mean total dominant length of growing period zones is presented in Figure 7.3, and their extents are presented in Table 7.3. A generalized map of pattern of length of growing period zones is presented in Figure 7.4, and their extents are presented in Table 7.4.
TABLE 7.1
Extents of Districts and Provinces of Kenya
| Code | Name | Extent (ha) | percent of total |
| 101 | Kiambu | 256 700 | 0.45 |
| 102 | Kirinyaga | 138 600 | 0.24 |
| 103 | Muranga | 254 600 | 0.44 |
| 104 | Nyandarua | 333 400 | 0.58 |
| 105 | Nyeri | 339 000 | 0.59 |
| Central Province | 1 322 300 | 2.30 | |
| 201 | Kilifi | 1 262 500 | 2.19 |
| 202 | Kwale | 814 400 | 1.41 |
| 203 | Lamu | 654 000 | 1.14 |
| 204 | Mombasa | 25 400 | 0.04 |
| 205 | Taita | 1 735 200 | 3.01 |
| 206 | Tana River | 3 939 200 | 6.84 |
| Coast Province | 8 430 900 | 14.63 | |
| 301 | Embu | 271 200 | 0.45 |
| 302 | Isiolo | 2 542 100 | 4.41 |
| 303 | Kitui | 3 037 200 | 5.27 |
| 304 | Machakos | 1 463 100 | 2.54 |
| 305 | Marsabit | 7 087 000 | 12.31 |
| 306 | Meru | 976 700 | 1.70 |
| Eastern Province | 15 377 300 | 26.69 | |
| 401 | Nairobi | 75 400 | 0.13 |
| Nairobi | 75 400 | 0.13 | |
| 501 | Garissa | 4 408 700 | 7.65 |
| 502 | Mandera | 2 617 800 | 4.55 |
| 503 | Wajir | 5 722 900 | 9.93 |
| North Eastern Province | 12 749 400 | 22.13 | |
| 601 | South Nyanza | 588 500 | 1.02 |
| 602 | Kisii | 214 200 | 0.37 |
| 603 | Kisumu | 217 400 | 0.38 |
| 604 | Siaya | 247 200 | 0.43 |
| Nyanza Province | 1 267 300 | 2.20 | |
| 701 | Baringo | 1 066 000 | 1.81 |
| 702 | Elgeyo Mar. | 263 000 | 0.46 |
| 703 | Kaijado | 2 151 900 | 3.74 |
| 704 | Kericho | 478 100 | 0.83 |
| 705 | Laikipia | 927 500 | 1.61 |
| 706 | Nakuru | 742 700 | 1.29 |
| 707 | Nandi | 281 400 | 0.49 |
| 708 | Narok | 1 799 100 | 3.12 |
| 709 | Samburu | 2 051 100 | 3.57 |
| 710 | Trans Nzoia | 246 700 | 0.43 |
| 711 | Turkana | 6 586 800 | 11.43 |
| 712 | Uasin Gishu | 382 600 | 0.66 |
| 713 | West Pokot | 535 700 | 0.93 |
| Rift Valley Province | 17 512 600 | 30.40 | |
| 801 | Bungoma | 319 300 | 0.56 |
| 802 | Busia | 191 400 | 0.33 |
| 803 | Kakamega | 361 500 | 0.63 |
| Western Province | 872 200 | 1.52 | |
| KENYA | 57 607 200 | 100.00 |
FIGURE 7.2
Generalized map of thermal zones
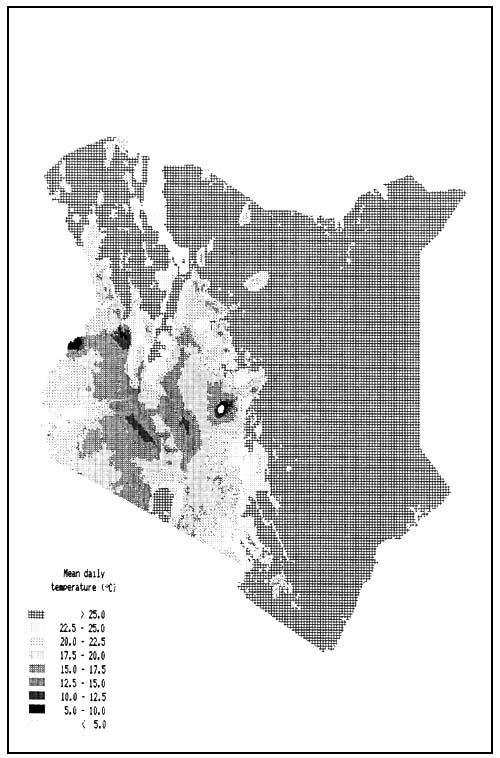
TABLE 7.2
Extents of thermal zones
| Thermal zone code | Temperature class (°C) | Extent (ha) | Percentage total area |
| 1 | > 25.0 | 38,120,600 | 66.17 |
| 2 | 22.5 – 25.0 | 5,783,600 | 10.04 |
| 3 | 20.0 – 22.5 | 4.070,100 | 7.07 |
| 4 | 17.5 – 20.0 | 4,484,400 | 7.78 |
| 5 | 15.0 – 17.5 | 3,448,300 | 5.99 |
| 6 | 12.5 – 15.0 | 1,268,200 | 2.20 |
| 7 | 10.0 – 12.5 | 307,100 | 0.53 |
| 8 | 5.0 – 10.0 | 107,400 | 0.19 |
| 9 | < 5.0 | 17,500 | 0.03 |
| 1 – 9 | 57,607,200 | 100.00 |
TABLE 7.3
Extents of mean total dominant length of growing period zones
| Growing period zone code | Growing period zone (days) | Extent (ha) | Percentage total area |
| 1 | 0 | 6,837,700 | 11.87 |
| 2 | 1 – 29 | 14,941,300 | 25.94 |
| 3 | 30 – 59 | 9,544,300 | 16.57 |
| 4 | 60 – 89 | 6,027,100 | 10.46 |
| 5 | 90 – 119 | 5,019,100 | 8.71 |
| 6 | 120 – 149 | 4,437,100 | 7.70 |
| 7 | 150 – 179 | 2,377,900 | 4.13 |
| 8 | 180 – 209 | 1,380,500 | 2.40 |
| 9 | 210 – 239 | 1,204.800 | 2.09 |
| 10 | 240 – 269 | 1,192,800 | 2.07 |
| 11 | 270 – 299 | 1,711,600 | 2.97 |
| 12 | 300 – 329 | 1,627,200 | 2.82 |
| 13 | 330 – 364 | 1,223.300 | 2.12 |
| 14 | 365- | 57,300 | 0.10 |
| 15 | 365+ | 25,200 | 0.04 |
| 1 – 15 | 57.607.200 | 100.00 |
FIGURE 7.3
Generalized map of mean total dominant length of growing period zones
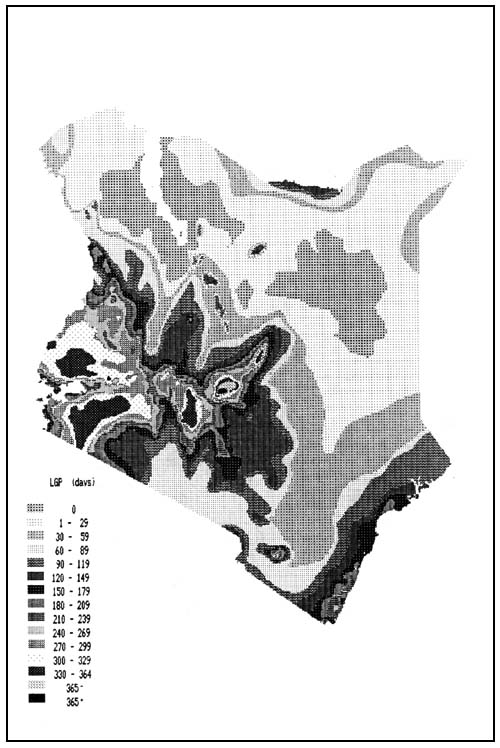
FIGURE 7.4
Generalized map of pattern of length of growing period zones
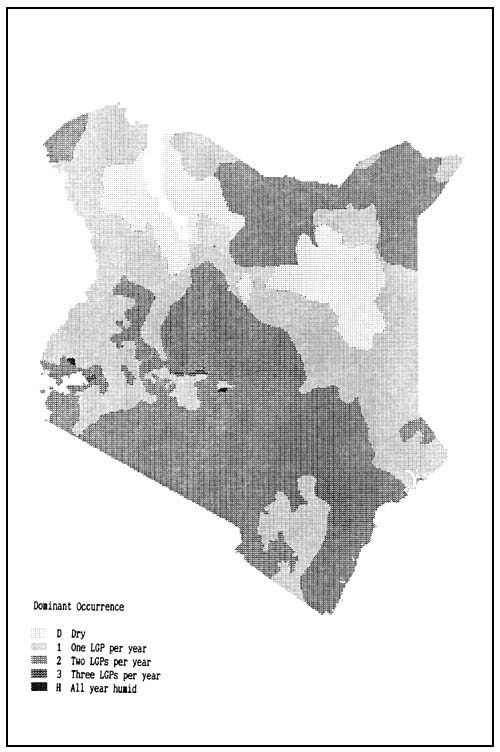
TABLE 7.4
Extents of pattern of length of growing period zones
| Pattern zone code | Pattern zone symbol | Extent (ha) | Percentage total area |
| 1 | 1 | 30,800 | 0.05 |
| 2 | H - 1 | 25,200 | 0.04 |
| 3 | 1 - H | 330,400 | 0.57 |
| 4 | 1 - H - 2 | 611,200 | 1.07 |
| 5 | 1 - 2 - H | 52,300 | 0.09 |
| 6 | 1 - 2 | 3,687,300 | 6.40 |
| 7 | 1 - 2 - 3 | 615,200 | 1.07 |
| 8 | 1 - 3 - 2 | 17,700 | 0.03 |
| 9 | 1 - 2 - D | 3,488,000 | 6.05 |
| 10 | 1 - D - 2 | 6,080,700 | 10.56 |
| 11 | 1 - D | 6,218,900 | 10.80 |
| 12 | 2 | 533,800 | 0.93 |
| 13 | 2 - 1 | 20,332,500 | 35.30 |
| 14 | 2 - 1 -H | 42,900 | 0.07 |
| 15 | 2 - 1 - 3 | 3,326,800 | 5.77 |
| 16 | 2 - 3 | 1.633,800 | 2.84 |
| 17 | 2 - 3 - 1 | 2,696,100 | 4.68 |
| 18 | 2 - 3 - 4 | 53,900 | 0.09 |
| 19 | 2 - 1 - D | 698,700 | 1.21 |
| 20 | 3 - 2 | 76,500 | 0.13 |
| 21 | 3 - 2 - 1 | 219,100 | 0.38 |
| 22 | D | 6,835,400 | 11.87 |
| 1 – 22 | 57,607,200 | 100.00 |
![]()
![]()
![]()