![]()
![]()
![]()
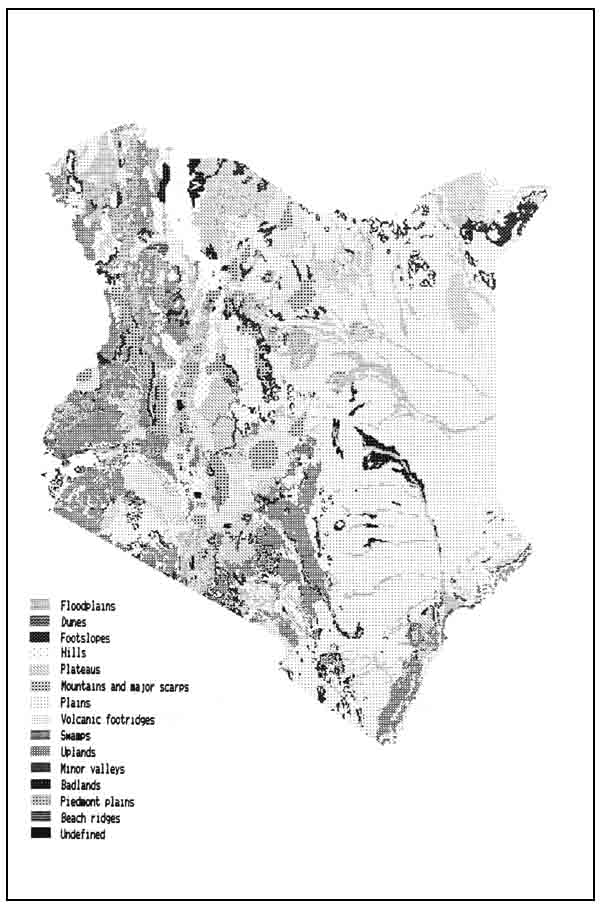
FIGURE 8.1
Generalized map of landforms
The Exploratory Soil Map of Kenya (Siderius and van der Pouw 1980; Sombroek, Braun and van der Pouw 1982) at 1:1 million scale was used to compile the soil resources inventory for this assessment.
This soil map published by Kenya Soil Survey in 1980 provides the latest country-wide soil data base and includes information on distribution and characteristics of soils, landform and geology/parent material.
The soil mapping units are soil associations or soil complexes composed of dominant soils, associated soils and inclusions. The soil mapping units have been registered on the map by a symbol reflecting the landform in which they occur. In Table 8.1 the occurrences of soil mapping units are presented by landform.
The Exploratory Soil Map consists of 390 different soil mapping units. Extents of the individual soil mapping units are presented in Appendix 8.1.
For each soil mapping unit the following semi-quantified information in terms of description, classes and extents has been transferred to the soil resources data base of this assessment:
- Landform
- Geology/Parent material
- Soil units (with implied characteristics)
- Slope- gradient classes
- Soil texture classes
- Soil phases.
Landform is the first entry in the legend of the Exploratory Soil Map. It provides information on physiography, altitudinal position and slope patterns. A generalized map of landforms in Kenya is presented in Figure 8.1, and a description of landforms is presented in Table 8.1. The extents of individual landforms are presented in Table 8.2.
TABLE 8.1
Occurrence of soil mapping units by landform
| Landform symbol | Landform description | Soil mapping units |
| A | Floodplains | A1 - A18 |
| A8 + A12 | ||
| B | Bottomlands | B1 – B16 |
| D | Dunes or dune land | D1 – D3 |
| D1 + P13 | ||
| F | Footslopes | F1 – F19 |
| FY | Footslopes and piedmont plains undifferentiated | FY1 – FY3 |
| Hills and minor scarps | ||
| H | H1 – H22 | |
| Step-faulted scarps of the Rift Valley | ||
| Hs | Hs1 | |
| Plateaus and high level structural plains | ||
| L | L1 – L31 | |
| Lava flows | ||
| La | Lava | |
| Coastal plateaus | ||
| Lc | Lc1 – Lc3 | |
| Step-faulted floor of the Rift Valley | ||
| Ls | Ls1 – Ls3 | |
| Plateau/upper-level upland transitions | ||
| Lu | Lu1 – Lu2 | |
| Mountains and mayor scarps | ||
| M | M1 – M12 | |
| Higher-level coastal plain | ||
| Pch | Lower-level coastal plain | Pc1 – Pc3 |
| Pcl | Reef coastal plan | Pc4 – Pc7 |
| Pcr | Pc8 – Pc10 | |
| Dissected erosional plains | ||
| Pd | Pd1 – Pd6 | |
| Pf1 | Sedimentary plains of large alluvial plains (older fans) | Pf1 – Pf3 |
| Pf2 | Sedimentary plains of large alluvial plains (younger fans) | Pf4 – Pf5 |
| Lacustrine plains | ||
| Pl | Pl1–Pl13 | |
| Pn | Non-dissected erosional plains | Pn1 – Pn35 |
| Psh | Higher-level sedimentary plains | Ps1 – Ps6 |
| Ps3 + Ps15 | ||
| Psl | Lower-level sedimentary plain | Ps21 – Ps27 |
| Psm | Middle sedimentary plains (‘enclosed’ plains and sealing loam plain) | Ps7 – Ps20 |
| Ps11 + D1 | ||
| Psx | Sedimentary plains of undifferentiated levels | Ps28 – Ps29 |
| Ps28 + D1 | ||
| Pt | Sedimentary plain of upper river terraces | Pt1 – Pt4 |
| Pv | Volcanic plains | Pv1 – Pv12 |
| R | Volcanic footridges | R1 – R14 |
| S | Swamps | S1 – S3 |
| T | Mangrove swamps | T |
| Uc | Coastal Uplands | Uc1 – Uc11 |
| Uh | Upper middle-level uplands | Uh1 – Uh19 |
| Uh3 + Uh4 | ||
| Ul | Lower-level uplands | Ul1 – Ul21 |
| Urn | Lower middle-level uplands | Um1 – Um29 |
| Up | Upland/high-level plain transitional lands | Up1 – Up8 |
| Uu | Upper-level uplands | Uu1 – Uu3 |
| Ux | Uplands, undifferentiated lands | Ux1 – Ux10 |
| V | Minor valleys | V1 – V2 |
| W | Badlands | W1 – W2 |
| Y | Piedmont plains | Y1 – Y13 |
| Z1 | Older coastal beach ridges | Z1 |
| Z2 | Younger coastal beach ridges | Z2 |
| Z3 | Lake side beach ridges | Z3 |
For the Exploratory Soil Map of Kenya six slope classes have been employed in 12 combinations. The slope classes are:
A generalized map of slope-gradient classes in Kenya is presented in Figure 8.2. The combinations of slope classes employed and their extents are presented in Table 8.3.
To each of the 12 slope classes, inventoried in the Exploratory Soil Map, associated slope classes have been assigned. These associated slope classes, covering up to 10% of the land area of the 12 slope classes, are used for evaluation purposes and included in the land resources inventory. The inventoried slope classes and associated slope classes are presented in Table 8.4.For the same purposes assumed mean slopes of quartiles of the land area of each of the slope classes have been assigned. These values are presented in Table 8.5.
TABLE 8.2
Extents of landform units FIGURE 8.2 Generalized map of slope gradient classes
| Landform symbol | Extent (ha) | Percentage Total area |
| A | 3,178,500 | 5.52 |
| B | 973,400 | 1.69 |
| D | 89,900 | 0.16 |
| F | 2,110,900 | 3.66 |
| FY | 614,000 | 1.07 |
| H | 3,203,600 | 5.56 |
| Hs | 514,600 | 0.89 |
| L | 4,051,800 | 7.03 |
| La | 959,800 | 1.67 |
| Lc | 212,800 | 0.37 |
| Ls | 810,800 | 1.41 |
| Lu | 97,600 | 0.17 |
| M | 2.375.200 | 4.12 |
| Pch | 429,500 | 0.75 |
| Pcl | 599,200 | 1.04 |
| Pcr | 82,600 | 0.14 |
| Pd | 1,895,300 | 3.29 |
| Pf1 | 311,500 | 0.54 |
| Pf2 | 377.000 | 0.65 |
| Pl | 862,500 | 1.50 |
| Pn | 6,007,100 | 10.43 |
| Psh | 3,885,400 | 6.74 |
| Psl | 3,138,300 | 5.45 |
| Psm | 5,618,100 | 9.75 |
| Psx | 247,100 | 0.43 |
| Pt | 322.700 | 0.56 |
| Pv | 998,000 | 1.73 |
| R | 3,121,500 | 5.42 |
| S | 94,700 | 0.16 |
| T | 133,700 | 0.23 |
| Uc | 533,000 | 0.93 |
| Uh | 786,200 | 1.36 |
| Ul | 1,400,000 | 2.43 |
| Um | 2,089,000 | 3.63 |
| Up | 385,900 | 0.67 |
| Uu | 131,900 | 0.23 |
| Ux | 1,744,000 | 3.03 |
| V | 112,400 | 0.20 |
| W | 722.000 | 1.25 |
| Y | 2,133,700 | 3.70 |
| Z1 | 79,300 | 0.14 |
| Z2 | 38,500 | 0.07 |
| Z3 | 5,100 | 0.01 |
| Lakes | 117,600 | 0.20 |
| Towns | 10,700 | 0.02 |
| Total extent | 57.607.200 | 100.00 |
FIGURE 8.2
Generalized map of slope gradient classes
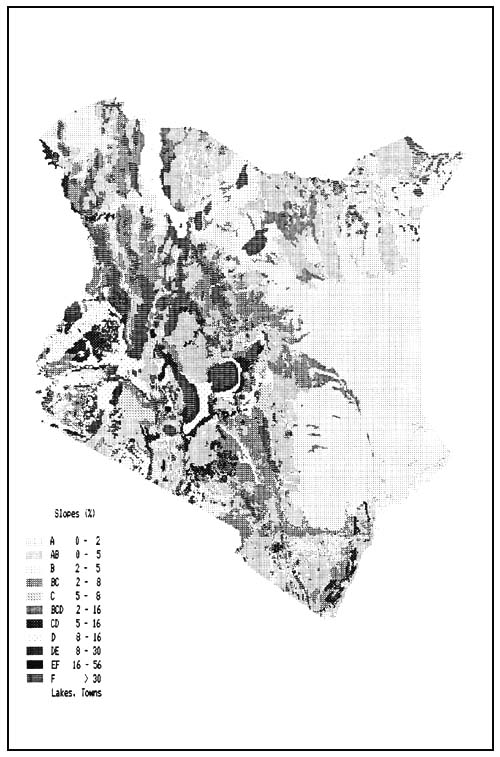
TABLE 8.3
Extents of slope classes
| Slope class symbol | Slope class (%) | Extent (ha) | Percentage of total area |
| A | 0 – 2 | 19 868 850 | 34.49 |
| AB | 0 – 5 | 14 540 600 | 25.24 |
| B | 2 – 5 | 3 098 150 | 5.38 |
| BC | 2 – 8 | 7 351 900 | 12.76 |
| C | 5 – 8 | 759 200 | 1.32 |
| BCD | 2 – 16 | 1 707 300 | 2.96 |
| CD | 5 – 16 | 1 557 450 | 2.70 |
| D | 8 – 16 | 1 616 200 | 2.81 |
| DE | 8 – 30 | 885 850 | 1.54 |
| E, EF, F | > 16 | 6 093 400 | 10.58 |
| Lakes | 117 600 | 0.20 | |
| Towns | 10 700 | 0.02 | |
| Total extent | 57 607 200 | 100.00 |
TABLE 8.4
Associated slope classes
| Slope class symbol | % | Associated slope classes | ||
| A | 0 – 2 | 100% A | ||
| AB | 0 – 5 | 100% AB | ||
| B | 2 – 5 | 100% B | ||
| BC | 2 – 8 | 90% BC | 5% A | 5% D |
| C | 5 – 8 | 90% C | 5% AB | 5% D |
| BCD | 2 – 16 | 90% BCD | 5% A | 5% E |
| CD | 5 – 16 | 90% CD | 5% AB | 5% E |
| D | 8 – 16 | 90% D | 5% BC | 5% E |
| DE | 8 – 30 | 90% DE | 5% BC | 5% F |
| E | 16 – 30 | 90% E | 5% BCD | 5% F |
| EF | 16 – 56 | 95% EF | 5% BCD | |
| F | 30 – 56 | 95% F | 5% DE |
TABLE 8.5
Quartiles of slope classes
| Slope class symbol | % | Gentlest Q1 | Lower Q2 | Upper Q3 | Steepest Q4 |
| A | 0 – 2 | 0 | 1 | 1 | 2 |
| AB | 0 – 5 | 0 | 2 | 4 | 5 |
| B | 2 – 5 | 2 | 3 | 4 | 5 |
| BC | 2 – 8 | 2 | 4 | 6 | 8 |
| C | 5 – 8 | 5 | 6 | 7 | 8 |
| BCD | 2 – 16 | 2 | 6 | 11 | 16 |
| CD | 5 – 16 | 5 | 9 | 12 | 16 |
| D | 8 – 16 | 8 | 11 | 13 | 16 |
| DE | 8 – 30 | 8 | 16 | 22 | 30 |
| E | 16 – 30 | 16 | 21 | 25 | 30 |
| EF | 16 – 56 | 16 | 30 | 42 | 56 |
| F | 30 – 56 | 30 | 39 | 47 | 56 |
FIGURE 8.3
Generalized map of geology/parent material
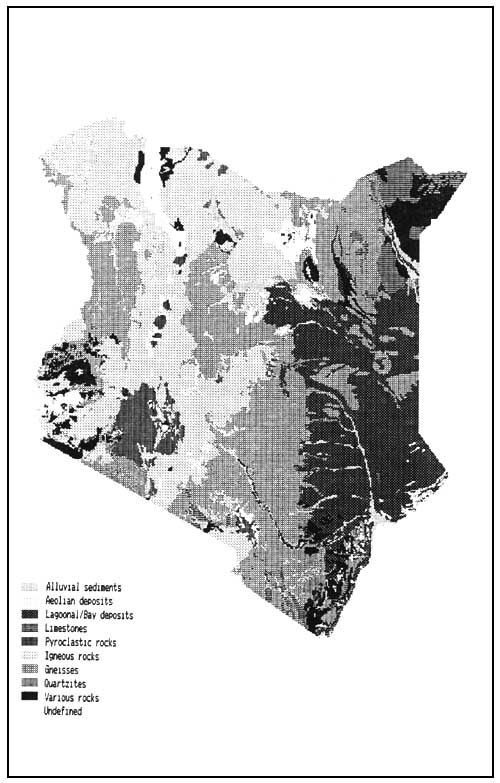
TABLE 8.6
Geology/parent material
| Geology symbol | Geology description |
| A | (Alluvial) Sediments from various sources1 |
| B | Basic and ultra-basic igneous rocks (basalts etc.) |
| B+ | As in B, but with volcanic ash admixture |
| BP | As in B, but volcanic ash predominant |
| D | Mudstones, claystones |
| E | Aeolian sediments (cover sands) |
| F | Gneisses rich in ferromagnesian minerals, hornblende gneises |
| G | Granites, granodiorites |
| G+ | As in G, but with volcanic ash admixture |
| GF | Biotite-hornblende granites |
| GF+ | As in GF, but with volcanic ash admixture |
| GP | As in G, but volcanic ash predominant |
| GR | Complex of G and R |
| I | Intermediate igneous rocks (syenites etc.) |
| I+ | As in I, but with volcanic ash admixture |
| J | Lagoonal deposits |
| K | Siltstones |
| KT | Complex K and T |
| L | Limestones, calcitic mudstones |
| N | Biotite gneisses |
| N+ | As in N, but with volcanic ash admixture |
| O | Plio-pleistocene bay sediments |
| P | Pyroclastic rocks |
| Q | Quartzites |
| R | Quartz-feldspar gneisses |
| S | Feldspar, grits, arkoses |
| T | Shales |
| U | Undifferentiated basement system rocks (predominantly gneisses) |
| U+ | As in U, but with volcanic ash admixture |
| UP | As in U, but volcanic ash predminant |
| V | Undifferentiated or various igneous (volcanic) rocks |
| W | Marls |
| X | Undifferentiated or various rocks |
| X+ | As in X, but with volcanic ash admixture |
| Y | Acid igneous rocks (rhyolite, aplite) |
| Y+ | As in Y, but with volcanic ash admixture |
| - | Not defined |
Geology is the second entry in the legend of the Exploratory Soil Map. The geological subdivisions reflect mainly resistance to weathering and richness of parent material in order to provide linkage with soil formation. The first level subdivision comprises three types of rocks:
- Igneous rocks
- Metamorphic rocks
- Sedimentary rocks.
TABLE 8.7
Extents of geological units
| Geology symbol | Extent (ha) | Percentage total area |
| A | 2 241 600 | 3.89 |
| B | 6 786 800 | 11.78 |
| B+ | 233 300 | 0.39 |
| BP | 52 200 | 0.09 |
| D | 102 900 | 0.18 |
| E | 235 400 | 0.41 |
| F | 1 680 600 | 2.92 |
| G | 477 900 | 0.83 |
| G+ | 14 400 | 0.02 |
| GF | 38 500 | 0.07 |
| GF+ | 70 700 | 0.12 |
| GP | 19 300 | 0.03 |
| GR | 50 700 | 0.09 |
| I | 499 900 | 0.87 |
| I+ | 90 900 | 0.16 |
| J | 1 154 600 | 2.00 |
| K | 1 466 600 | 2.55 |
| KT | 94 100 | 0.16 |
| L | 2 056 400 | 3.57 |
| N | 400 600 | 0.70 |
| N+ | 160 300 | 0.28 |
| O | 9 606 600 | 16.68 |
| P | 1 897 400 | 3.29 |
| Q | 405 900 | 0.70 |
| R | 58 900 | 0.10 |
| S | 647 400 | 1.12 |
| T | 164 000 | 0.28 |
| U | 14 007 000 | 24.31 |
| U+ | 1 172 400 | 2.04 |
| UP | 36 700 | 0.06 |
| V | 8 536 300 | 14.82 |
| W | 168 500 | 0.29 |
| X | 1 350 200 | 2.34 |
| X+ | 11 700 | 0.02 |
| Y | 155 800 | 0.27 |
| Y+ | 79 000 | 0.14 |
| - | 1 263 400 | 2.19 |
| Lakes | 117 600 | 0.20 |
| Towns | 10 700 | 0.02 |
| Total extent | 57 607 200 | 100.00 |
Igneous rocks and metamorphic rocks are futher subdivided from basic to acid. The sedimentary rocks are futher subdivided from fine to coarse textured.
Each soil mapping unit is accordingly characterized for its geological setting/parent material.
A generalized map of geology/parent material is presented in Figure 8.3, and the descriptions and extents of geological units are presented in Table 8.6 and Table 8.7 respectively.
The individual soil units of the soil associations or soil complexes (soil mapping units of the Exploratory Soil Map) have been defined in accordance with the FAO-Unesco system. The soil units adopted were selected on the basis of present knowledge on the formation, characteristics and distribution of the soils, their importance as resources for agricultural production and their significance as a factor of the environment.
In the legend of the Exploratory Soil Map some adaptations of the FAO-Unesco legend have been introduced. At the first level (great group) the terminology for Lithosols and Nitosols has been modified. At the second level (unit level) new subgroups have been introduced (cambic and orthic Rendzinas) and others modified (vertic Gleysols, mollic Nitisols, chromic Acrisols, chromic Luvisols and chromic Cambisols). In order to reflect thegreater amount of detail of the Exploratory Soil Map of Kenya, a third level of terminology (subunit level) has been introduced for subdivision of soil units into subunits. The prefixes used to distinguish subunits are ando, calcaro, chromo, ferralo, luvo, nito, ortho and verto.
In the Exploratory Soil Map 123 different soil units and five miscellaneous units occur. Table 8.8 presents the soil units and miscellaneous units and their extents.
The soil units have been defined in terms of measurable and observable properties of the soil itself, and specific clusters of such properties are combined into ‘diagnostic horizons’ and ‘diagnostic properties’.
The diagnostic horizons have been used as defined in the FAO-Unesco legend. Diagnostic properties however have been narrowed down in case of ferric properties and widened in case of vertic properties. In Appendix 8.2 for each soil unit diagnostic horizons and properties of the soil units are summarized. For the ease of interpretation of Appendix 8.2, these characteristics are summarized below.
The complete definitions of the soil units are given in Volume 1 (Legend) of FAO-Unesco Soil Map of the World (FAO 1974) and Exploratory Soil Survey Report (KSS 1982).
| Histic H horizon: | Surface layer of organic material more than 20 cm thick. |
| Mollic A horizon: | Surface horizon with dark colour, medium to high humus content, high base saturation. |
| Umbric A horizon: | Surface horizon with dark colour, medium to high humus content, low base saturation. |
| Ochric A horizon: | Surface horizon with light colour, low humus content |
| Argillic B horizon: | Subsoil horizon with accumulation of illuvial clay. |
| Natric B horizon: | Subsoil horizon with accumulation of illuvial clay and high exchangeable sodium. |
| Cambic B horizon: | Subsoil horizon with a structure and/or colour different from overlying and underlying horizons. |
| Spodic B horizon: | Subsoil horizon with accumulation of iron and/or humus. |
| Oxic B horizon: | Subsoil with residual accumulation of sesquioxides and low CEC. |
| Calcic horizon: | Horizon of accumulation of calcium carbonate. |
| Gypsic horizon: | Horizon of accumulation of calcium sulphate. |
| Sulphuric horizon: | Horizon with strong acidity and prominent mottling. |
TABLE 8.8
Extents of soil units
| Soil unit symbol | Soil unit name | Extent (ha) | Percentage total area |
| A | Acrisols | 45 080 | 0.08 |
| Ac | Chromic Acrisols | 82 830 | 0.14 |
| Ag | Gleyic Acrisols | 49 950 | 0.09 |
| Ah | Humic Acrisols | 151 345 | 0.26 |
| Aic | Ferralo-chromic Acrisols | 772 685 | 1.34 |
| Aif | Ferralo-ferric Acrisols | 127 760 | 0.22 |
| Aio | Ferralo-orthic Acrisols | 325 475 | 0.56 |
| Ao | Orthic Acrisols | 167 920 | 0.29 |
| Ap | Plinthic Acrisols | 14 880 | 0.03 |
| Ath | Ando-humic Acrisols | 14 600 | 0.03 |
| B | Cambisols | 8 800 | 0.02 |
| Bc | Chromic Cambisols | 1 000 700 | 1.74 |
| Bd | Dystric Cambisols | 70 350 | 0.12 |
| Be | Eutric Cambisols | 630 140 | 1.09 |
| Bf | Ferralic Cambisols | 53 840 | 0.09 |
| Bg | Gleyic Cambisols | 31 150 | 0.05 |
| Bh | Humic Cambisols | 513 185 | 0.89 |
| Bk | Calcic Cambisols | 1 890 630 | 3.28 |
| Bnc | Nito-chromic Cambisols | 296 195 | 0.51 |
| Btc | Ando-chromic Cambisols | 436 600 | 0.76 |
| Bte | Ando-eutric Cambisols | 181 750 | 0.32 |
| Bv | Vertic Cambisols | 20 825 | 0.04 |
| Ch | Haplic Chernozems | 39 800 | 0.07 |
| Ck | Calcic Chernozems | 56 800 | 0.10 |
| Ec | Cambic Rendzinas | 14 700 | 0.03 |
| Eo | Orthic Rendzinas | 184 790 | 0.32 |
| F | Ferralsols | 128 080 | 0.22 |
| Fa | Acric Ferralsols | 59 400 | 0.10 |
| Fh | Humic Acrisols | 6 100 | 0.01 |
| Fnh | Nito-humic Ferralsols | 13 600 | 0.02 |
| Fnr | Nito-rodic Ferralsols | 225 900 | 0.39 |
| Fo | Orthic Ferralsols | 855 490 | 1.49 |
| Fr | Rodic Ferralsols | 2 695 015 | 4.68 |
| Fx | Xanthic Ferralsols | 73 860 | 0.13 |
| G/Ge | Gleysols/Eutric Gleysols | 9 270 | 0.02 |
| Gc | Calcaric Gleysols | 95 100 | 0.17 |
| Gd | Dystric Gleysols | 22 610 | 0.04 |
| Gh | Humic Gleysols | 52 830 | 0.09 |
| Gm | Mollic Gleysols | 124 840 | 0.22 |
| Gv | Vertic Gleysols | 820 070 | 1.42 |
| Hg | Gleyic Phaeozems | 147 180 | 0.26 |
| Hh | Haplic Phaeozems | 96 355 | 0.17 |
| Hnl | Nito-luvic Phaeozems | 21 900 | 0.04 |
| Hol | Orthic-luvic Phaeozems | 319 120 | 0.55 |
| Hrl | Chromo-luvic Phaeozems | 523 270 | 0.91 |
| Hth | Ando-haplic Phaeozems | 36 190 | 0.06 |
| Htl | Ando-luvic Phaeozems | 263 980 | 0.46 |
| Hvl | Verto-luvic Phaeozems | 642 225 | 1.11 |
| I | Lithosols | 2 344 045 | 4.07 |
| Ir | Ironstone soils | 216 285 | 0.38 |
| J | Fluvisols | 34 800 | 0.06 |
| Jc | Calcaric Fluvisols | 1 434 600 | 2.49 |
| Je | Eutric Fluvisols | 299 400 | 0.52 |
| Jt | Thionic Fluvisols | 79 650 | 0.14 |
| Kh | Haplic Kastanozems | 57 640 | 0.10 |
| L | Luvisols | 194 750 | 0.34 |
| La | Albic Luvisols | 124 625 | 0.22 |
| Lc | Chromic Luvisols | 2 321 880 | 4.03 |
| Lf | Ferric Luvisols | 582 150 | 1.01 |
| Lg | Gleyic Luvisols | 167 395 | 0.29 |
| Lic | Ferralo-chromic Luvisols | 784 840 | 1.37 |
| Lif | Ferralo-ferric Luvisols | 44 955 | 0.08 |
| Lio | Ferralo-orthic Luvisols | 50 325 | 0.09 |
| Lk | Calcic Luvisols | 981 995 | 1.70 |
| Lnc | Nito-chromic Luvisols | 34 120 | 0.06 |
| Lnf | Nito-ferric Luvisols | 36 260 | 1.81 |
| Lo | Orthic Luvisols | 1 039 855 | 0.29 |
| Lv | Vertic Luvisols | 169 710 | 0.12 |
| Mo | Orthic Greyzems | 70 700 | 0.07 |
| Mvo | Verto-orthic Greyzems | 38 100 | 0.05 |
| Nd | Dystric Nitisols | 31 195 | 0.05 |
| Ne | Eutric Nitisols | 600 610 | 1.04 |
| Nh | Humic Nitisols | 635 860 | 1.10 |
| Nm | Mollic Nitisols | 190 610 | 0.33 |
| Nth | Ando-humic Nitisols | 212 530 | 0.37 |
| Nve | Verto-eutric Nitisols | 33 365 | 0.06 |
| Nvm | Verto-mollic Nitisols | 3 240 | 0.01 |
| Od | Distric Histosols | 79 800 | 0.14 |
| Q | Arenosols | 15 750 | 0.03 |
| Qa | Albic Arenosols | 63 880 | 0.11 |
| Qc | Cambic Arenosols | 702 790 | 1.22 |
| Qf | Ferralic Arenosols | 2 200 890 | 3.82 |
| Qkc | Calcaro-cambic Arenosols | 446 780 | 0.78 |
| Ql | Luvic Arenosols | 187 860 | 0.33 |
| R | Regosols | 13 250 | 0.02 |
| Rc | Calcaric Regosols | 1 256 110 | 2.18 |
| Rd | Dystric Regosols | 138 640 | 0.24 |
| Re | Eutric Regosols | 696 390 | 1.21 |
| Rtc | Ando-calcaric Regosols | 301 440 | 0.52 |
| S | Solonetz | 634 580 | 1.10 |
| Sg | Gleyic Solonetz | 434 030 | 0.75 |
| Slo | Luvo-orthic Solonetz | 4 664 100 | 8.10 |
| Sm | Mollic Solonetz | 43 820 | 0.08 |
| So | Orthic Solonetz | 2 536 730 | 4.40 |
| Th | Humic Andosols | 455 520 | 0.79 |
| Tm | Mollic Andosols | 528 950 | 0.92 |
| Tv | Vitric Andosols | 81 600 | 0.14 |
| U | Rankers | 154 670 | 0.27 |
| V | Vertisols | 149 580 | 0.26 |
| Vc | Chromic Vertisols | 763 920 | 1.33 |
| Vp | Pellic Vertisols | 1 514 390 | 2.63 |
| W | Planosols | 4 380 | 0.01 |
| Wd | Dystric Planosols | 114 205 | 0.20 |
| Wh | Eutric Planosols | 323 710 | 0.56 |
| We | Humic Planosols | 195 800 | 0.34 |
| Ws | Solodic Planosols | 2 472 405 | 4.29 |
| Wve | Verto-eutric Planosols | 251 205 | 0.44 |
| X | Xerosols/Yermosols | 102 920 | 0.18 |
| Xh | Haplic Xerosols/Yermosols | 650 620 | 1.13 |
| Xk | Calcic Xerosols/Yermosols | 3 620 670 | 6.29 |
| Xy | Gypsic Xerosols/Yermosols | 168 500 | 0.29 |
| Z | Solonchaks | 577 750 | 1.00 |
| zg | Gleyic Solonchaks | 187 000 | 0.32 |
| Zo | Orthic Solonchaks | 1 601 410 | 2.78 |
| Zt | Takyric Solonchaks | 147 800 | 0.26 |
| Lava | 1 015 960 | 1.76 | |
| Lava flows | 128 990 | 0.22 | |
| Lava fields | 56 460 | 0.10 | |
| Ice cap | 557 885 | 0.97 | |
| 5 335 | 0.01 | ||
| Lakes | 117 600 | 0.20 | |
| Towns | 10 700 | 0.02 | |
| Total extent | 57 607 200 | 100.00 |
| Albic E horizon: | Eluvial horizon from which clay and free iron oxide have been removed, light colour. |
| Calcareous material: | Calcium carbonate present at least between 20 and SO cm from the surface. |
| CEC high or very high: | Exchange complex dominated by allophane or montmorillonite. |
| CEC low: | Exchange complex dominated by kaolinite (CEC less than 24 meq/100 g clay). |
| CEC very low: | Less than 1.5 meq/100 g clay. |
| Cracking clays: | Formation of deep and wide cracks upon drying. |
| Plinthite: | Mottled subsoil layer which irreversibly hardens upon exposure to repeated wetting and drying. |
| High salinity: | Electrical conductivity (EC) higher than 15 mmhos/cm. |
| Moderate salinity: | Electrical conductivity (EC) between 4 and 15 mmhos/cm. |
| High alkalinity: | Saturation with exchangeable sodium of more than 15 percent. |
| Moderate alkalinity: | Saturation with exchangeable sodium of to 15 percent. |
| Indurated subsoil: | Subsoil layer with firm or hard consistence, but can still be penetrated by spade or auger. |
| Cemented hardpan: | Extremely hard continuous subsoil layer which cannot be penetrated by spade or auger. |
| Coarse texture: | Less than 18 percent clay and more than 65 percent sand. |
| Heavy texture: | More than 35 percent clay. |
| Abrupt textural change: | Considerable increase in clay content within a very short vertical distance. |
| Tonguing: | Deep and irregular penetration of an albic E horizon into an argillic B horizon. |
Soil textures may vary within the range of textures defined for a particular soil unit. In the legend of the Exploratory Soil Map textural classes for individual soil units by soil mapping unit are presented. The three major textural divisions are subdived into 17 classes. The three major textural divisions are shown in the texture diagram. Textural classes by major division are also listed below.
Percentage occurrence of textural classes is presented in Table 8.9.
The presence of coarse material (stoniness) in the soil profile has been inventoried separately from soil textures. The presence of coarse material is subdivided into six types:
| Gravely | (G) |
| Very gravely | (VG) |
| Stony | (S) |
| Bouldery | (B) |
| Stony/bouldery | (SB) |
| Bouldery/stony | (BS) |
 | |||
| Coarse textures | - Sand | Fine textures | - Sandy clay |
| - Loamy coarse sand | - Silty clay | ||
| - Fine sand | - Peaty clay | ||
| - Loamy fine sand | |||
| - Loamy sand | |||
| Medium textures | - Fine sandy loam | ||
| - Sandy loam | |||
| - Loam | |||
| - Sandy clay loam | |||
| - Silt loam | |||
| - Clay loam | |||
| - Silty clay loam | |||
| - Silt | |||
| Textural classes by major division | |||
TABLE 8.9
Percentage occurrence of textural classes
| Texture class | Texture symbol | Percentage1 |
| Sandy | S | 0.2 |
| Loamy coarse sand | LCS | 0.5 |
| Fine sand | FS | 0.2 |
| Loamy fine sand | LFS | 0.8 |
| Loamy sand | LS | 3.8 |
| Coarse textures | 5.5 | |
| Fine sandy loam | FSL | 1.3 |
| Sandy loam | SL | 3.1 |
| Loam | L | 6.4 |
| Sandy clay loam | SCL | 15.4 |
| Silt loam | SL | 0.6 |
| Clay loam | CL | 28.5 |
| Silty clay loam | SICL | 0.4 |
| Silt | SI | < 0.1 |
| Medium textures | 55.8 | |
| Sandy clay | SC | 10.2 |
| Silty clay | SIC | 0.3 |
| Peaty clay | PC | < 0.1 |
| Clay | C | 28.2 |
| Fine textures | 38.7 |
1 Total extent where texture is applicable is 55,714,270 ha (96.9% of total area).
Soil phases indicate land characteristics which are not considered in the definition of the soil units but are significant to the use and management of land. The soil phases recognized on the Exploratory Soil Map of Kenya can be grouped into phases indicating a mechanical hindrance or limitation (rocky, bouldery, boulder-mantle, stony, stone-mantle, gravel-mantle); phases indicating an effective soil depth limitation (lithic, paralithic, petro-calcic, piso-calcic, petro-ferric, piso-ferric); and phases indicating a physico-chemical limitation (saline, sodic and saline-sodic). Some of these phases have been defined in the FAO-Unesco Legend, while others have been introduced in the Exploratory Soil Map. The soil phases are briefly outlined below.
Rocky phase (R)1
The rocky phase marks areas where the presence of rock outcrops makes the use of mechanized agricultural equipment impracticable.
Bouldery phase (S)1
The bouldery phase marks areas where the presence of boulders in the surface layers makes the use of mechanized agricultural equipment impracticable.
Boulder-mantle phase (BM)1
The boulder-mantle phase marks areas where an excessive amount of boulders at the surface makes any arable use impossible and renders extensive range very difficult.
Stony phase(S)1
The stony phase as for the bouldery phase, but with stones.
Stone-mantle phase (SM)1
The stone-mantle phase as for the boulder-mantle phase, but with stones.
Gravely phase (G)
The gravely phase marks areas, where the presence of gravel in the surface layers makes the use of mechanized agricultural equipement impractable.
Gravel-mantle phase (GM)1
The gravel-mantle phase as for the boulder-mantle phase, but with gravel.
Lithic and Paralithic phases (P) and (PP)1
The lithic phase reflects continuous coherent and hard rock occurs within SO cm of the surface (P). The paralithic reflects occurrence of soft rock (PP).
Petrocalcic phase (K) and (KK)
The petrocalcic phase marks areas in which the upperpart of a petrocalcic horizon occurs within 100 cm of the surface. In the Exploratory Soil Map a differentiation has been made between occurrence of petrocalcic horizons within 100 cm (K), and within SO cm from the surface (KK).
Pisocalcic phase (C) and (CC)1
The pisocalcic phase marks soils having a layer, at least 25 cm thick and starting within 100 cm of the surface, with 40 % or more, by volume, of loose fragments of secondary calcium carbonate, usually concretions. The symbols C and CC are applied as described for the petrocalcic phase.
Petroferric phase (M)
The petroferric phase marks soils in which the upper part of the petroferric horizon occurs within 100 cm of the surface. In areas where the petro ferric horizon usually starts within SO cm of the surface are termed ironstone soils (see soil units).
Pisoferric phase (N)1
The pisoferric phase marks soils having a layer consisting of 40 % or more by volume of oxidic concretions or of hardened plinthite, or ironstone with a thickness of at least 25 cm, the upper part of which occurs within 100 cm of the surface.
Saline phase (A)
The saline phase marks soils that show electric conductivity values of the saturation extract higher than 4 mmhos/cm at 25 °C in some horizons within 100 cm of the surface.
Sodic phase (O)
The sodic phase marks soils having more than 6 % exchangeble sodium in some horizons within 100 cm of the surface.
Saline-sodic phase (AO)
The saline-sodic phase marks soils with a combination of the saline and sodic phases as defined above.
Fragipan phase (F)
The fragipan phase marks soils which have a loamy subsurface horizon which has a high bulk density relative to the horizons above it. The fragipan is occurring within 100 cm of the surface.
Percentage occurrence of soil phases are presented in Table 8.10.
1 Defined in the Exploratory Soil Map of Kenya.
At the exploratory level a soil mapping unit only rarely comprises a single soil; usually it consist of one main soil with minor associates. When the various soils of a soil mapping unit occur in a recognizable geographical pattern in defined proportions, they constitute a soil association; if such a pattern is absent, they form a soil complex.
The productivity potential of different soil units within a soil mapping unit consequently may vary widely. The suitability of soil association (soil complex) for specific use cannot be assessed without taking account of each individual soil unit within the association.
TABLE 8.10
Extents (%) of soil phases in Kenya
| Soil phase | Symbol | Percentage1 |
| Rocky | R | 6.7 |
| Bouldery | B | 1.6 |
| Boulder-mantle | BM | 1.1 |
| Stony | S | 4.6 |
| Stone-mantle | SM | 5.1 |
| Gravely | G | 0.2 |
| Gravel-mantle | GM | 0.9 |
| Lithic | P | 3.7 |
| Paralithic | PP | 0.7 |
| Petrocalcic | K | 0.2 |
| Petrocalcic | KK | 3.1 |
| Pisocalcic | C | 0 |
| Pisocalcic | CC | 0.4 |
| Petroferric | M | 1.2 |
| Saline | N | 0.1 |
| Sodic | A | 12.8 |
| Saline-sodic | 0 | 9.7 |
| Fragipan | AO | 10.6 |
| F | 0.1 | |
| One soil phase | 62.8 | |
| Rocky and bouldery | R and B | 3.7 |
| Rocky and stony | R and S | 2.9 |
| Bouldery and stony | B and s | 3.6 |
| Boulder-mantle and saline-sodic | BM and AO | 1.1 |
| Stony and rocky | S and R | 0.3 |
| Stony and bouldery | S and B | <0.1 |
| Stony and petrocalcic | S and K | <0.1 |
| Stony and saline-sodic | S and AO | 1.0 |
| Stone-mantle and sodic | Sm and O | 1.0 |
| Stone-mantle and saline-sodic | P and R | 0.1 |
| Lithic and rocky | P and B | 1.8 |
| Lithic and bouldery | P and BM | 1.1 |
| Lithic and boulder-mantle | P and S | 1.3 |
| Lithic and stony | P and O | 2.6 |
| Lithic and sodic | P and AO | <0.1 |
| Lithic and saline-sodic | PP and R | 0.1 |
| Paralithic and rocky | PP and S | <0.1 |
| Paralithic and stony | K and S | 0.7 |
| Petrocalcic and stony | K and AO | 1.6 |
| Petrocalcic and saline-sodic | KK and A | <0.1 |
| Petrocalcic and saline | KK and O | 0.1 |
| Petrocalcic and sodic | N and R | 0.1 |
| Pisoferric and rocky | N and M | 0.1 |
| Pisoferric and pisoferric | A and F | 0.2 |
| Pisoferric and fragipan | O and F | 0.1 |
| Sodic and fragipan | 0.1 | |
| Two soil phases | 23.7 | |
| Rocky and bouldery and saline-sodic | R and B and AO | 1.1 |
| Rocky and lithic and stony | R and P and S | 0.1 |
| Bouldery and stony and saline | B and S and A | 0.2 |
| Bouldery and stony and saline-sodic | BM and S and AO | 0.8 |
| Lithic and rocky and bouldery | P and R and B | 0.2 |
| Lithic and rocky and stony | P and R and S | 2.8 |
| Lithic and bouldery and saline | P and B and S | 0.2 |
| Lithic and boulder-mantle and saline-sodic | P and B and A | 1.0 |
| Lithic and stony and rocky | P and BM and AO | 1.1 |
| Lithic and stony and saline | P and S and R | 0.8 |
| Lithic and stony and saline-sodic | P and S and A | 0.6 |
| Lithic and stone-mantle and saline-sodic | P and S and AO | 0.1 |
| Lithic and gravel-mantle and saline | P and SM and AO | 3.2 |
| P and GM and S | 1.3 | |
| Three soil phases | 13.5 |
1 Total extent where soil phases occur is 28 096 674 ha (48.9% of total area).
The legend of the Exploratory Soil Map does not provide explicit information in a quantified manner on the composition of the soil mapping units. This however has been provided to FAO by Stiboka in Wageningen in close cooperation with Kenya Soil Survey in Nairobi and the International Soil Reference and Information Centre in Wageningen (van der Pouw 1983).
The complete mapping unit composition table is presented in Appendix 8.3. This table consist of the percentage allocation of soil units by slope class, soil texture and soil phases for each soil mapping unit, and of information on landform and geology/parent material.
The composition of an example soil association (Ps3) is illustrated and explained in Figure 8.4.
FIGURE 8.4
Example of soil mapping unit composition of soil mapping unit Ps3
![]()
![]()
![]()