![]()
![]()
![]()
FIGURE 9.1
Make-up of land resources data base
The land resources inventory brings together several layers of physical environmental resources and allows the creation of unique ecological land units (agro-ecological cells) within which soil, landform and climatic conditions are quantified. This information, compiled at the national level by province and district, constitutes the inventory of the physical land resources.
To create a computerized inventory of land resources, the individual inventories have been compiled in map form at 1:1 million scale.
The climatic resources inventory consists of three seperate layers, thermal zones, growing period zones and pattern of length of growing period zones. The Exploratory Soil Map of Kenya, includes information of soils, landform and geology/parent material.
Additional layers (1:1 million scale) have also been digitized and overlayed on to the land resources inventory. These layers contain information on cash crop zones, forest zones, parkland areas, irrigated areas, tse-tse infestation areas, and province and district boundaries.
The individual map-layers have been digitized by the Comprehensive Resource Inventory and Evaluation System (CRIES 1983) of Michigan State University. The digitized information derived from the individual map layers has been converted to a data base of 576,072 grid cells. Each cell (one millimeter square) corresponds to 100 ha.
Subsequent to digitizing the individual layers of the land resources inventory, the soil mapping unit composition of each mapping unit and the associated ecological conditions have been incorporated.
The make-up of the national land resources data base is schematically presented in Figure 9.1.
The land use and tse-tse infestation overlays have been integrated into the physical resources inventories. Consequently each agro-ecological cell is further characterized by the information contained in these overlays.
Tables 9.1, 9.2,9.3,9.4 and 9.5 present descriptions, map symbols, computer coding and extents of map units respectively of cash crop zones, forest zones, parkland areas, irrigation schemes and tse-tse infestation areas. Figures 9.2, 9.3, 9.4, 9.5, and 9.6 present generalized maps of the above information and the details are presented in Technical Annex 3. The District map of Kenya is presented in Figure 7.1 and their extents are presented in Table 7.1.
TABLE 9.1
Extents of cash crop zones
| Crop | Crop description | Extent (ha) | Percentage area | |
| symbol | code | |||
| 01 | 2 | Tea (secondary) | 422 600 | 8.37 |
| 02 | 3 | Coffee (secondary) | 441 700 | 8.75 |
| 03 | 4 | Sugarcane (secondary) | 848 500 | 16.81 |
| 04 | 5 | Cotton (secondary) | 923 800 | 18.30 |
| 05 | 6 | Pyrethrum | 464 900 | 9.21 |
| 06 | 7 | Sisal (secondary) | 584 600 | 11.58 |
| 10 | 8 | Tea (primary) | 67 500 | 1.34 |
| 12 | 9 | Tea/Coffee | 144 000 | 2.85 |
| 13 | 10 | Tea/Sugarcane | 55 800 | 1.11 |
| 15 | 11 | Tea/Pyretrum | 53 300 | 1.06 |
| 20 | 12 | Coffee (primary) | 50 800 | 1.01 |
| 23 | 13 | Coffee/Sugarcane | 103 600 | 2.05 |
| 30 | 14 | Sugarcane (primary) | 69 200 | 1.37 |
| 34 | 15 | Sugarcane/Cotton | 289 400 | 5.73 |
| 40 | 17 | Cotton (primary) | 341 000 | 6.76 |
| 60 | 18 | Sisal (primary) | 170 900 | 3.39 |
| 70 | 19 | Pineapple (primary) | 16 000 | 0.32 |
| Total extent | 5 047 600 | 100.00 | ||
TABLE 9.2
Extents of forest zones
| Forest | Forest description | Extent (ha) | Percentage area | |
| symbol | code | |||
| F1 | 2 | Registered Forest | 1 522 000 | 77.09 |
| F2 | 3 | Unregistered Forest | 60 000 | 3.04 |
| F3 | 4 | Proposed Forest | 392 300 | 19.87 |
| Total extent | 1 974 300 | 100.00 | ||
TABLE 9.3
Extents of parkland areas
| Parkland | Parkland description | Extent (ha) | Percentage area | |
| symbol | code | |||
| P1 | 2 | National park | 2 820 300 | 67.18 |
| P2 | 3 | Game reserve | 890 500 | 21.21 |
| P3 | 4 | National reserve | 487 300 | 11.61 |
| Total extent | 4 198 100 | 100.00 | ||
TABLE 9.4
Extents of Irrigation schemes
| Irrigation area | Name | Extent (ha) | Percentage area | |
| symbol | code | |||
| 01 | 2 | Turkwell | 400 | 0.98 |
| 02 | 3 | Katilu | 700 | 1.72 |
| 03 | 4 | Amolem | 400 | 0.98 |
| 04 | 5 | Kaputir | 500 | 1.23 |
| 05 | 6 | Bunyala | 500 | 1.23 |
| 06 | 7 | Ahero I | 2 000 | 4.91 |
| 07 | 8 | Ahero II | 2 500 | 6.14 |
| 08 | 9 | Marigat | 1 200 | 2.95 |
| 09 | 10 | Mwea | 13 200 | 32.43 |
| 10 | 11 | Malka daka | 400 | 0.98 |
| 11 | 12 | Merti | 400 | 0.98 |
| 12 | 13 | Mbalambala | 500 | 1.23 |
| 13 | 14 | Garisa | 1 000 | 2.46 |
| 14 | 15 | Hola | 2 700 | 6.63 |
| 15 | 17 | Garsen | 2 400 | 5.90 |
| 17 | 18 | Tavete | 600 | 1.47 |
| 18 | 19 | Mandera | 100 | 0.25 |
| 19 | 20 | Bura (proposed) | 10 900 | 26.78 |
| 16 | 21 | Wema | 300 | 0.74 |
| Total extent | 40 700 | 100.00 | ||
TABLE 9.5
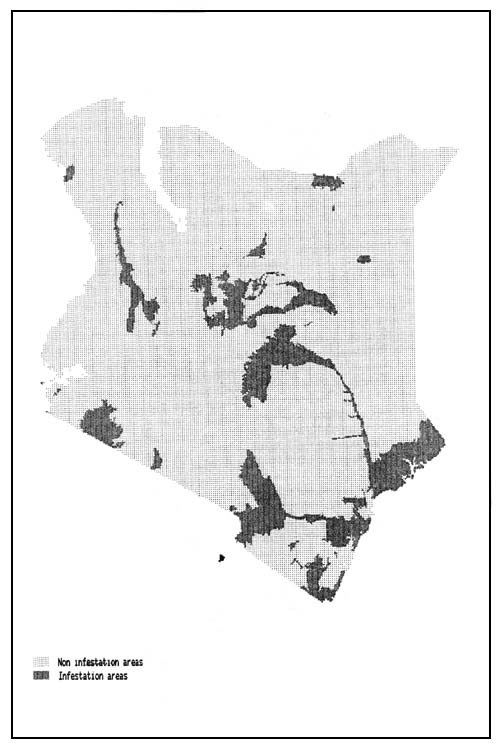
Extent of tse-tse infestation areas
| Tse-tse infestaton areas | Extent (ha) | Percentage total area | |
| symbol | code | ||
| T | 2 | 7 561 000 | 13.15 |
The computerized land resources inventory for Kenya records total extents of agro-ecological cells. Each cell contains information on the following:
- Sequence number (NUM)
- Province (PRV)
- District (DIST)
- Thermal Zone (TZ)
- Length of Growing Period Zone (LGP)
- Pattern of Length of Growing Period Zone (PAT)
- Soil Mapping Unit (MPU)
- Landform (LNDFM)
- Geology/Parent Material (GEO)
- Soil Unit (SOIL)
- Soil Texture (TXT)
- Soil Phases 1st, 2nd and 3rd (PHASES)
- Cash Crop Zone (CROP)
- Forest Zone (FOR)
- Irrigation Scheme (IRR)
- Tse-tse Infestation Areas (TSE)
- Parkland Area (PARK)
- Extent in hectares (EXTENT).
The land resources inventory of Kenya comprises about 91,000 unique agro-ecological cells. For Kiambo District (code: 1) in Central Province (code: 1), the complete land resources inventory is presented in Appendix 9.1. The coding used in Appendix 9.1 corresponds with the coding as presented in Tables and Appendixes in this technical annex.
The computerized land resources inventory is available on diskettes (ASCII), in the form of a grid based geographic information system (GIS). For details on formats of the land resources inventory and the use of the geographic information system, reference should be made to Technical Annex 7.
FIGURE 9.2
Generalized map of cash crop zones
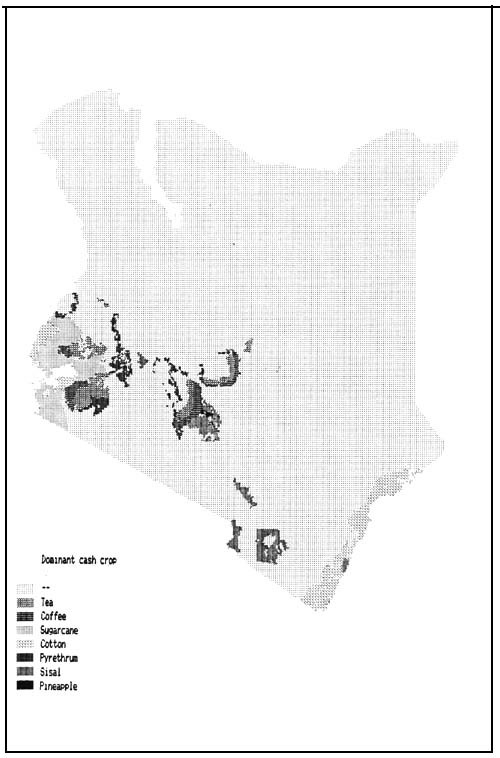
FIGURE 9.3
Generalized map of forest zones
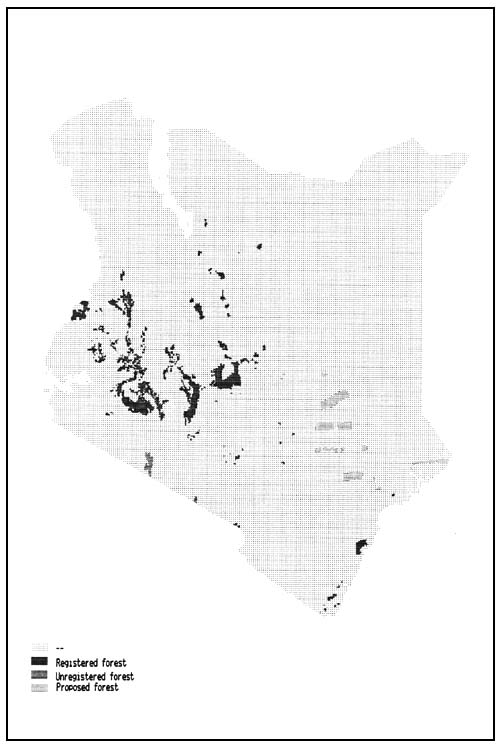
FIGURE 9.4
Generalized map of parkland areas
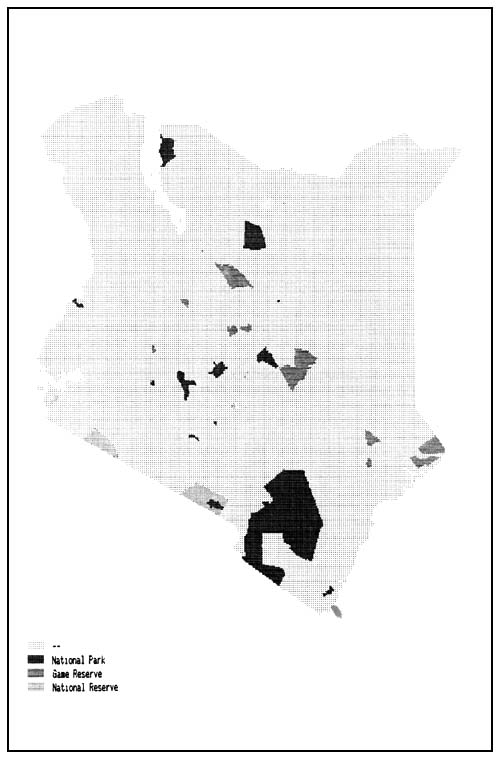
FIGURE 9.5
Generalized map of irrigation schemes
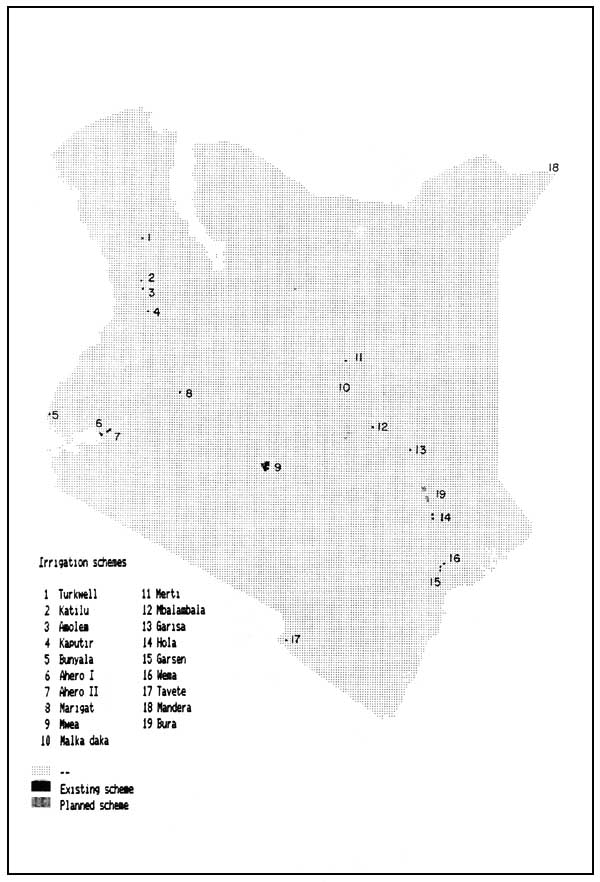
FIGURE 9.6
Generalized map of tse-tse infestation areas
![]()
![]()
![]()