![]()
![]()
![]()
TABLE 3.16
Extents of soil units
| Symbol | Soil unit name | Extent (ha) | % total area |
| A | Acrisols | 45 080 | 0.08 |
| Ac | Chromic Acrisols | 82 830 | 0.14 |
| Ag | Gleyic Acrisols | 49 950 | 0.09 |
| Ah | Humic Acrisols | 151 345 | 0.26 |
| Aic | Ferralo-chromic Acrisols | 772 685 | 1.34 |
| Aif | Ferralo-ferric Acrisols | 127 760 | 0.22 |
| Aio | Ferralo-orthic Acrisols | 325 475 | 0.56 |
| Ao | Orthic Acrisols | 167 920 | 0.29 |
| Ap | Plinthic Acrisols | 14 880 | 0.03 |
| Ath | Ando-humic Acrisols | 14 600 | 0.03 |
| B | Cambisols | 8 800 | 0.02 |
| Bc | Chromic Cambisols | 1 000 700 | 1.74 |
| Bd | Dystric Cambisols | 70 350 | 0.12 |
| Be | Eutric Cambisols | 630 140 | 1.09 |
| Bf | Ferralic Cambisols | 53 840 | 0.09 |
| Bg | Gleyic Cambisols | 31 150 | 0.05 |
| Bh | Humic Cambisols | 513 185 | 0.89 |
| Bk | Calcic Cambisols | 1 890 630 | 3.28 |
| Bnc | Nito-chromic Cambisols | 296 195 | 0.51 |
| Btc | Ando-chromic Cambisols | 436 600 | 0.76 |
| Bte | Ando-eutric Cambisols | 181 750 | 0.32 |
| Bv | Vertic Cambisols | 20 825 | 0.04 |
| Ch | Haplic Chernozems | 39 800 | 0.07 |
| Ck | Calcic Chernozems | 56 800 | 0.10 |
| Ec | Cambic Renzinas | 14 700 | 0.03 |
| Eo | Orthic Renzinas | 184 790 | 0.32 |
| F | Ferralsols | 128 080 | 0.22 |
| Fa | Acric Ferralsols | 59 400 | 0.10 |
| Fh | Humic Acrisols | 6 100 | 0.01 |
| Fnh | Nito-humic Ferralsols | 13 600 | 0.02 |
| Fnr | Nito-rodic Ferralsols | 225 900 | 0.39 |
| Fo | Orthic Ferralsols | 855 490 | 1.49 |
| Fr | Rodic Ferralsols | 2 695 015 | 4.68 |
| Fx | Xanthic Ferralsols | 73 860 | 0.13 |
| G/Ge | Gleysols/Eutric Gleysols | 9 270 | 0.02 |
| Gc | Calcaric Gleysols | 95 100 | 0.17 |
| Gd | Dystric Gleysols | 22 610 | 0.04 |
| Gh | Humic Gleysols | 52 830 | 0.09 |
| Gm | Mollic Gleysols | 124 840 | 0.22 |
| Gv | Vertic Gleysols | 820 070 | 1.42 |
| Hg | Gleyic Phaeozems | 147 180 | 0.26 |
| Hh | Haplic Phaeozems | 96 355 | 0.17 |
| Hnl | Nito-luvic Phaeozems | 21 900 | 0.04 |
| Hol | Orthic-luvic Phaeozems | 319 120 | 0.55 |
| Hrl | Chromo-luvic Phaeozems | 523 270 | 0.91 |
| Hth | Ando-haplic Phaeozems | 36 190 | 0.06 |
| Htl | Ando-luvic Phaeozems | 263 980 | 0.46 |
| Hvl | Verto-luvic Phaeozems | 642 225 | 1.11 |
| I | Lithosols | 2 344 045 | 4.07 |
| Ir | Ironstone soils | 216 285 | 0.38 |
| J | Fluvisols | 34 800 | 0.06 |
| Jc | Calcaric Fluvisols | 1 434 600 | 2.49 |
| Je | Eutric Fluvisols | 299 400 | 0.52 |
| Jt | Thionic Fluvisols | 79 650 | 0.14 |
| Kh | Haplic Kastanozems | 57 640 | 0.10 |
| L | Luvisols | 194 750 | 0.34 |
| La | Albic Luvisols | 124 625 | 0.22 |
| Lc | Chromic Luvisols | 2 321 880 | 4.03 |
| Lf | Ferric Luvisols | 582 150 | 1.01 |
| Lg | Gleyic Luvisols | 167 395 | 0.29 |
| Lic | Ferralo-chromic Luvisols | 784 840 | 1.37 |
| Lif | Ferralo-ferric Luvisols | 44 955 | 0.08 |
| Lio | Ferralo-orthic Luvisols | 50 325 | 0.09 |
| Lk | Calcic Luvisols | 981 995 | 1.70 |
| Lnc | Nito-chromic Luvisols | 34 120 | 0.06 |
| Lnf | Nito-ferric Luvisols | 36 260 | 1.81 |
| Lo | Orthic Luvisols | 1 039 855 | 0.29 |
| Lv | Vertic Luvisols | 169 710 | 0.12 |
| Mo | Orthic Greyzems | 70 700 | 0.07 |
| Mvo | Verto-orthic Greyzems | 38 100 | 0.05 |
| Nd | Dystric Nitisols | 31 195 | 0.05 |
| Ne | Eutric Nitisols | 600 610 | 1.04 |
| Nh | Humic Nitisols | 635 860 | 1.10 |
| Nm | Mollic Nitisols | 190 610 | 0.33 |
| Nth | Ando-humic Nitisols | 212 530 | 0.37 |
| Nve | Verto-eutric Nitisols | 33 365 | 0.06 |
| Nvm | Verto-mollic Nitisols | 3 240 | 0.01 |
| Od | Distric Histosols | 79 800 | 0.14 |
| Q | Arenosols | 15 750 | 0.03 |
| Qa | Albic Arenosols | 63 880 | 0.11 |
| Qc | Cambic Arenosols | 702 790 | 1.22 |
| Qf | Ferralic Arenosols | 2 200 890 | 3.82 |
| Qkc | Calcaro-cambic Arenosols | 446 780 | 0.78 |
| Ql | Luvic Arenosols | 187 860 | 0.33 |
| R | Regosols | 13 250 | 0.02 |
| Rc | Calcaric Regosols | 1 256 110 | 2.18 |
| Rd | Dystric Regosols | 138 640 | 0.24 |
| Re | Eutric Regosols | 696 390 | 1.21 |
| Rtc | Ando-calcaric Regosols | 301 440 | 0.52 |
| S | Solonetz | 634 580 | 1.10 |
| Sg | Gleyic Solonetz | 434 030 | 0.75 |
| Slo | Luvo-orthic Solonetz | 4 664 100 | 8.10 |
| Sm | Mollic Solonetz | 43 820 | 0.08 |
| So | Orthic Solonetz | 2 536 730 | 4,40 |
| Th | Humic Andosols | 455 520 | 0.79 |
| Tm | Mollic Andosols | 528 950 | 0.92 |
| Tv | Vitric Andosols | 81 600 | 0.14 |
| U | Rankers | 154 670 | 0.27 |
| V | Vertisols | 149 580 | 0.26 |
| Vc | Chromic Vertisols | 763 920 | 1.33 |
| Vp | Pellic Vertisols | 1 514 390 | 2.63 |
| W | Planosols | 4 380 | 0.01 |
| Wd | Dystric Planosols | 114 205 | 0.20 |
| Wh | Eutric Planosols | 323 710 | 0.56 |
| We | Humic Planosols | 195 800 | 0.34 |
| Ws | Solodic Planosols | 2 472 405 | 4.29 |
| Wve | Verto-eutric Planosols | 251 205 | 0.44 |
| X | Xerosols/Yermosols | 102 920 | 0.18 |
| Xh | Haplic Xerosols/Yermosols | 650 620 | 1.13 |
| Xk | Calcic Xerosols/Yermosols | 3 620 670 | 6.29 |
| Xy | Gypsic Xerosols/Yermosols | 168 500 | 0.29 |
| Z | Solonchaks | 577 750 | 1.00 |
| zg | Gleyic Solonchaks | 187 000 | 0.32 |
| Zo | Orthic Solonchaks | 1 601 410 | 2.78 |
| Zt | Takyric Solonchaks | 147 800 | 0.26 |
| Lava | 1 015 960 | 1.76 | |
| Lava flows | 128 990 | 0.22 | |
| Lava fields | 56 460 | 0.10 | |
| Rock outcrops | 557 885 | 0.97 | |
| Ice cap | 5 335 | 0.01 | |
| Lakes | 117 600 | 0.20 | |
| Towns | 10 700 | 0.02 | |
| Total extent | 57 607 200 | 100.00 |
Soil textures may vary within the range of textures defined for a particular soil unit. In the legend of the Exploratory Soil Map textural classes for individual soil units by soil mapping unit are presented. The three major textural divisions are subdived into 17 classes. The three major textural divisions are shown in the texture diagram.
Textural classes by major division are also listed below; percentage occurrence is presented in Table 3.17.
TABLE 3.17
Percentage occurrence of textural classes Texture class Texture Percentage
| Texture class | Texture symbol | Percentage 1 |
| Sand | S | 0.2 |
| Loamy coarse sand | LCS | 0.5 |
| Fine sand | FS | 0.2 |
| Loamy fine sand | LFS | 0.8 |
| Loamy sand | LS | 3.8 |
| I Coarse textures | 5.5 | |
| Fine sandy loam | FSL | 1.3 |
| Sandy loam | SL | 3.1 |
| Loam | L | 6.4 |
| Sandy clay loam | SCL | 15.4 |
| Silt loam | SL | 0.6 |
| Clay loam | CL | 28.5 |
| Silty clay loam | SICL | 0.4 |
| Silt | SI | <0.1 |
| I Medium textures | 55.8 | |
| Sandy clay | SC | 10.2 |
| Silty clay | SIC | 0.3 |
| Peaty clay | PC | <0.1 |
| Clay | C | 28.2 |
| I Fine textures | 38.7 |
1 Total extent where texture is applicable is 55 714 270 ha (96.9% of total area).
| Coarse textures | - Sand |
| - Loamy coarse sand | |
| - Fine sand | |
| - Loamy fine sand | |
| - Loamy sand | |
| Medium textures | - Fine sandy loam |
| - Sandy loam | |
| - Loam | |
| - Sandy clay loam | |
| - Silt loam | |
| - Clay loam | |
| - Silty clay loam | |
| - Silt | |
| Fine textures | - Sandy clay |
| - Silty clay | |
| - Peaty clay |
The presence of coarse material (stoniness) in the soil profile has been inventoried separately from soil textures. The presence of coarse material is subdivided into six types:
Gravely (G)
Very gravely (VG)
Stony (S)
Bouldery (SB)
Stony/bouldery (SB)
Bouldery/stony (BS)
Soil phases indicate land characteristics which are not considered in the definition of the soil units but are significant to the use and management of land. The soil phases recognized on the Exploratory Soil Map of Kenya can be grouped into phases indicating a mechanical hindrance or limitation (rocky, bouldery, boulder-mantle, stony, stone-mantle, gravel-mantle); phases indicating an effective soil depth limitation (lithic, paralithic, petro-calcic, piso-calcic, petro-ferric, piso-ferric); and phases indicating a physico-chemical limitation (saline, sodic and saline-sodic). Soil phases can occur alone (one soil phase or in combination (two or three phases). Some of these phases have been defined in the FAO-Unesco Legend, while others have been introduced in the Exploratory Soil Map. The soil phases and their extents are presented in Table 3.18.
At the exploratory level a soil mapping unit only rarely comprises a single soil; usually it consist of one main soil with minor associates. When the various soils of a soil mapping unit occur in a recognizable geographical pattern in defined proportions, they constitute a soil association; if such a pattern is absent, they form a soil complex.
The productivity potential of different soil units within a soil mapping unit consequently may vary widely. The suitability of soil association (soil complex) for specific use cannot be assessed without taking account of each individual soil unit within the association.
The legend of the Exploratory Soil Map does not provide explicit information in a quantified manner on the composition of the soil mapping units. This however has been provided to FAO by Stiboka in Wageningen in close cooperation with Kenya Soil Survey in Nairobi and the International Soil Reference and Information Centre in Wageningen (van der Pouw 1983).
The complete mapping unit composition table is presented in Technical Annex 1. This table consists of the percentage allocation of soil units by slope class, soil texture and soil phases for each soil mapping unit, and of information on landform and geology/parent material.
The composition of a example soil association (Ps3) is illustrated and explained in Figure 3.11.
The land use and tse-tse infestation overlays have been integrated into the physical resources inventories. Consequently each agro-ecological cell is further characterized by the information contained in these overlays.
TABLE 3.18
Extents (%) of soil phases
| Soil phase | Symbol | Percentage1 |
| Rocky | R | 6.7 |
| Bouldery | B | 1.6 |
| Boulder-mantle | BM | 1.1 |
| Stony | S | 4.6 |
| Stone-mantle | SM | 5.1 |
| Gravely | G | 0.2 |
| Gravel-mantle | GM | 0.9 |
| Lithic | P | 3.7 |
| Paralithic | PP | 0.7 |
| Petrocalcic | K | 0.2 |
| Petrocalcic | KK | 3.1 |
| Pisocalcic | C | 0 |
| Pisocalcic | CC | 0.4 |
| Petroferric | M | 1.2 |
| Pisoferric | N | 0.1 |
| Saline | A | 12.8 |
| Sodic | 0 | 9.7 |
| Saline-sodic | AO | 10.6 |
| Fragipan | F | 0.1 |
| One soil phase | 62.8 | |
| Rocky and bouldery | R and B | 3.7 |
| Rocky and stony | R and S | 2.9 |
| Bouldery and stony | B and S | 3.6 |
| Boulder-mantle and saline-sodic | BM and AO | 1.1 |
| Stony and rocky | S and R | 0.3 |
| Stony and bouldery | S and B | <0.1 |
| Stony and petrocalcic | S and K | <0.1 |
| Stony and saline-sodic | S and AO | 1.0 |
| Stone-mantle and sodic | SM and 0 | 1.0 |
| Stone-mantle and saline-sodic | SM and AO | 0.1 |
| Lithic and rocky | P nd R | 1.8 |
| Lithic and bouldery | P and B | 1.1 |
| Lithic and boulder-mantle | P and BM | 1.3 |
| Lithic and stony | P and S | 2.6 |
| Lithic and sodic | P and O | <0.1 |
| Lithic and saline-sodic | P and AO | 0.1 |
| Paralithic and rocky | PP and R | <0.1 |
| Paralithic and stony | PP and S | 0.7 |
| Petrocalcic and stony | K and S | 1.6 |
| Petrocalcic and saline-sodic | K and AO | <0.1 |
| Petrocalcic and saline | KK and A | 0.1 |
| Petrocalcic and sodic | KK and O | 0.1 |
| Pisoferric and rocky | N and R | 0.1 |
| Pisoferric and petroferric | N and M | 0.2 |
| Pisoferric and fragipan | A and F | 0.1 |
| Sodic and fragipan | O and F | 0.1 |
| Two soil phases | 23.7 | |
| Rocky and bouldery and saline-sodic | R and B and AO | 1.1 |
| Rocky end lithic and stony | R and P and S | 0.1 |
| Bouldery and stony and saline | B and S and A | 0.2 |
| Bouldery and stony and saline-sodic | BM and S and AO | 0.8 |
| Lithic and rocky and bouldery | P and R and B | 0.2 |
| Lithic and rocky and stony | P and R and S | 2.8 |
| Lithic and bouldery end stony | P and B and S | 0.2 |
| Lithic and bouldery and saline | P and B and A | 1.0 |
| Lithic and boulder-mantle and saline-sodic | P and BM and AO | 1.1 |
| Lithic and stony and rocky | P and S and R | 0.8 |
| Lithic and stony and saline | P and S and A | 0.6 |
| Lithic and stony and saline-sodic | P and S and AO | 0.1 |
| Lithic and stone-mantle and saline-sodic | P and SM and AO | 3.2 |
| Lithic and gravel-mantle and saline | P and GM and S | 1.3 |
| Three soil phases | 13.5 |
1 Total extent where soil phases occur is 28,096,674 ha (48.9 % of total area)
FIGURE 3.11
Example of soil mapping unit composition of soil mapping unit Ps3
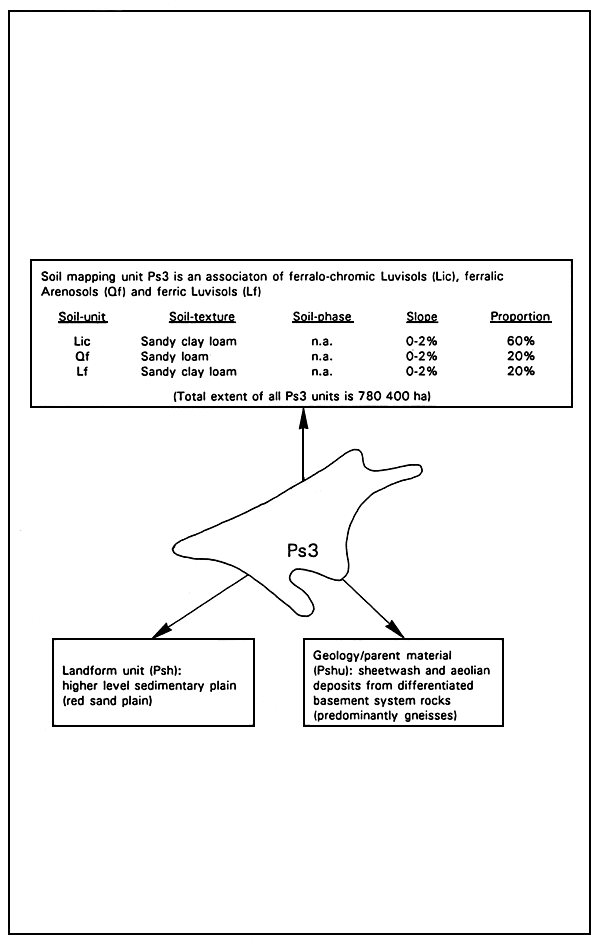
TABLE 3.19
Extents of cash crop zones
| Crop | Crop description | Extent (ha) | Percentage area | |
| symbol | code | |||
| 01 | 2 | Tea (secondary) | 422 600 | 8.37 |
| 02 | 3 | Coffee (secondary) | 441 700 | 8.75 |
| 03 | 4 | Sugarcane (secondary) | 848 500 | 16.81 |
| 04 | 5 | Cotton (secondary) | 923 800 | 18.30 |
| 05 | 6 | Pyrethrum | 464 900 | 9.21 |
| 06 | 7 | Sisal (secondary) | 584 600 | 11.58 |
| 10 | 8 | Tea (primary) | 67 500 | 1.34 |
| 12 | 9 | Tea/Coffee | 144 000 | 2.85 |
| 13 | 10 | Tea/Sugarcane | 55 800 | 1.11 |
| 15 | 11 | Tea/Pyretrum | 53 300 | 1.06 |
| 20 | 12 | Coffee (primary) | 50 800 | 1.01 |
| 23 | 13 | Coffee/Sugarcane | 103 600 | 2.05 |
| 30 | 14 | Sugarcane (primary) | 69 200 | 1.37 |
| 34 | 15 | Sugarcane/Cotton | 289 400 | 5.73 |
| 40 | 17 | Cotton (primary) | 341 000 | 6.76 |
| 60 | 18 | Sisal (primary) | 170 900 | 3.39 |
| 70 | 19 | Pineapple (primary) | 16 000 | 0.32 |
| Total extent | 5 047 600 | 100.00 | ||
TABLE 3.20
Extents of forest zones
| Forest | Forest description | Extent (ha) | Percentage area | |
| symbol | code | |||
| F1 | 2 | Registered Forest | 1 522 000 | 77.09 |
| F2 | 3 | Unregistered Forest | 60 000 | 3.04 |
| F3 | 4 | Proposed Forest | 392 300 | 19.87 |
| Total extent | 1 974 300 | 100.00 | ||
TABLE 3.21
Extents of parkland areas
| Parkland | Parkland description | Extent (ha) | Percentage area | |
| symbol | code | |||
| P1 | 2 | National park | 2 820 300 | 67.18 |
| P2 | 3 | Game reserve | 890 500 | 21.21 |
| P3 | 4 | National reserve | 487 300 | 11.61 |
| Total extent | 4 198 100 | 100.00 | ||
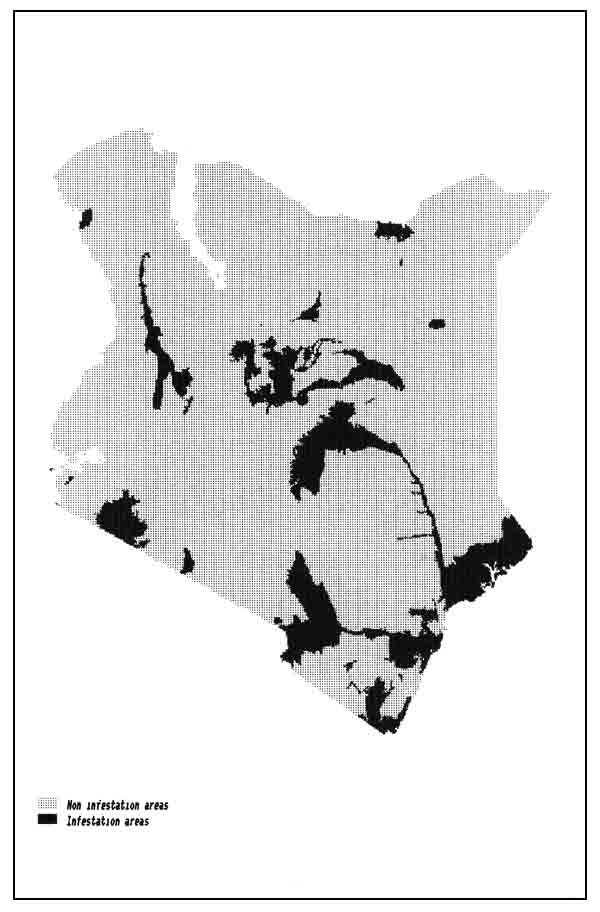
Tables 3.19, 3.20, 3,21, 3.22 and 3.23 present descriptions, map symbols, computer coding and extents of map units respectively of cash crop zones, forest zones, parkland areas, irrigation schemes and tse-tse infestation areas. Figures 3.12, 3.13, 3.14, 3. 15 and 3.16 present generalized maps of the above information and the details are presented in Technical Annex 3.
TABLE 3.22
Extents of initiation schemes
| Irrigation area | Name | Extent (ha) | Percentage area | |
| symbol | code | |||
| 01 | 2 | Turkwell | 400 | 0.98 |
| 02 | 3 | Katilu | 700 | 1.72 |
| 03 | 4 | Amolem | 400 | 0.98 |
| 04 | 5 | Kaputir | 500 | 1.23 |
| 05 | 6 | Bunyala | 500 | 1.23 |
| 06 | 7 | Ahero I | 2 000 | 4.91 |
| 07 | 8 | Ahero II | 2 500 | 6.14 |
| 08 | 9 | Marigat | 1 200 | 2.95 |
| 09 | 10 | Mwea | 13 200 | 32.43 |
| 10 | 11 | Malka daka | 400 | 0.98 |
| 11 | 12 | Merti | 400 | 0.98 |
| 12 | 13 | Mbalambala | 500 | 1.23 |
| 13 | 14 | Garisa | 1 000 | 2.46 |
| 14 | 15 | Hola | 2 700 | 6.63 |
| 15 | 17 | Garsen | 2 400 | 5.90 |
| 16 | 18 | Tavete | 600 | 1.47 |
| 17 | 19 | Mandera | 100 | 0.25 |
| 19 | 20 | Bura (proposed) | 10 900 | 26.78 |
| 16 | 21 | Wemba | 300 | 0.74 |
| Total extent | 40 700 | 100.00 | ||
TABLE 3.23
Extent of tse-tse infestation areas
| Tse-tse infestation areas | Extent (ha) | Percentage total area | ||
| symbol | code | |||
| T | 2 | 7 561 000 | 13.15 | |
The computerized land resources inventory for Kenya records total extents of agro-ecological cells. Each cell contains information on the following:
- Sequence number (NUM)
- Province (PRV)
- District (DIST)
- Thermal Zone (TZ)
- Length of Growing Period Zone (LGP)
- Pattern of Length of Growing Period Zone (PAT)
- Soil Mapping Unit (MPU)
- Landform (LNDFM)
- Geology/Parent Material (GEO)
- Soil Unit (SOIL)
- Soil Texture (TXT)
- Soil Phases 1st, 2nd and 3rd (PHASES)
- Cash Crop Zone (CROP)
- Forest Zone (FOR)
- Irrigation Scheme (IRR)
- Tse-tse Infestation Areas (TSE)
- Parkland Area (PARK)
- Extent in hectares (EXTENT).
The land resources inventory of Kenya consists of about 91 000 unique agro-ecological cells. For Kiambo District (code: 1) in Central Province (code: 1), the complete land resources inventory (651 cells) is presented in Technical Annex 1.
The computerized land resources inventory is available on diskettes (ASCII), in the form of a grid based geographic information system (GIS). For details on formats of the land resources inventory and the use of the geographic information system, reference should be made to Technical Annex 7.
FIGURE 3.12
Generalized map of cash crop zones
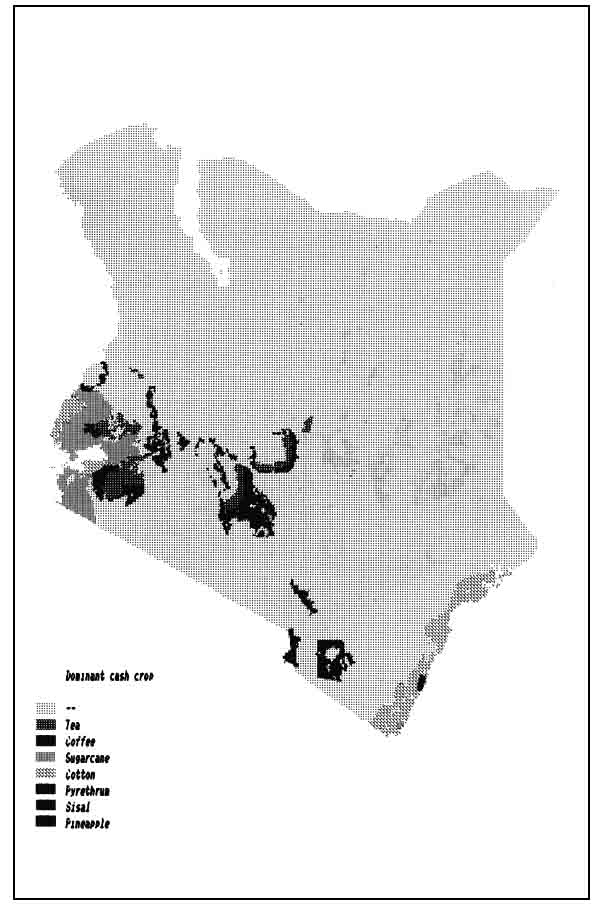
FIGURE 3.13
Generalized map of forest zones
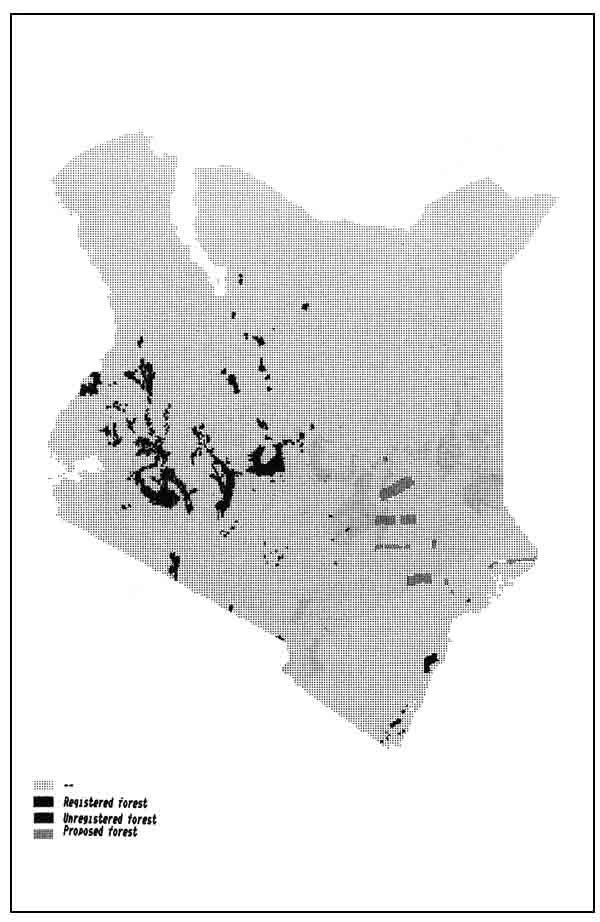
FIGURE 3.14
Generalized map of parkland areas
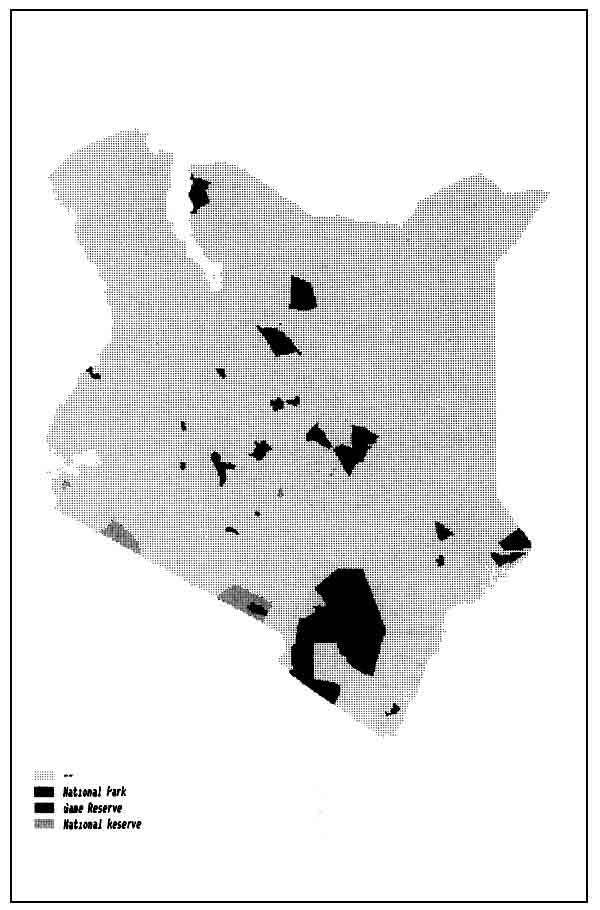
FIGURE 3.15
Generalized map of irrigation schemes
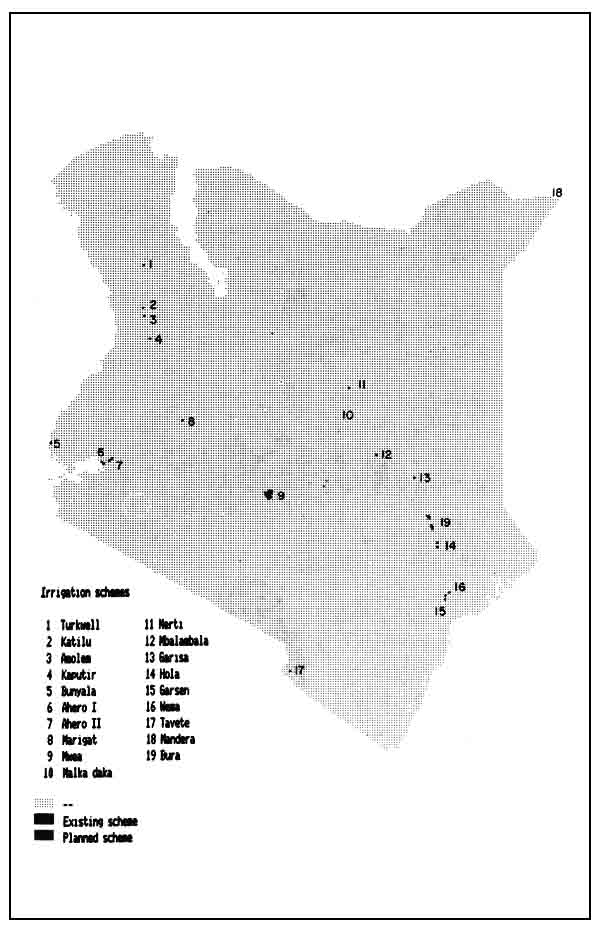
FIGURE 3.16
Generalized map of tse-tse infestation areas
![]()
![]()
![]()