![]()
![]()
![]()
This chapter describes the crop productivity model (Technical Annex 4). The model is schematically shown in Figure 5.1, and comprises five parts:
The model operates on the climate and soil resources inventories described in Chapter 3 and Technical Annex 1. The model explicitly formulates options in respect of annual cropping patterns and crop rotations and quantifies their production potentials at three levels of inputs. The model formulates optimum cropping patterns and quantifies their productivities to meet a given food demand, taking into account desired levels of production ‘stability’ at the micro level. The crop productivity model is interphased with livestock and fuelwood productivity models (Chapters 6 and 7).
The five parts of the crop productivity model are described in the following sections.
Land suitability assessments of single crops (Part I, Figure 5.1) is made according to the FAO-AEZ method (FAO 1978–81), and involves:
selection and definition of land utilization types (e.g. crop, cropping type, produce, production system, inputs level);
matching the thermal zones of the climatic inventory with the temperature requirements of the crops, and where these requirements are met, computation of agronomically attainable crop yields by length and pattern of growing period zones;
matching the soil requirements of crops with the soil type, texture classes, stoniness, phases and slope classes of the soil inventory, by rating their limitations.
FIGURE 5.1
Schematic representation of crop productivity model
A total of 25 crop spiecies are considered in the assessment. The full list of crops and crop types is presented in Table 5.1. Coffee, cotton, pineapple, pyrethrum, sisal and tea are considered in the model to take account of the reported production and land area occupied by these crops as quantified by the land use inventory (Technical Annex 3). The remaining 19 crops are differentiated into 58 crop types to account of differences in ecotype adaptation, crop phenology and growth cycles within each crop species.
Each of the 58 crop types are considered at three levels of inputs circumstances (low, intermediate and high). The attributes of the three input level circumstances are listed in Table 5.2, and form the basis of the definition of the land utilization types in the assessment.
The following conditions apply to the crops considered:
cereal and legume crops are grown for dry grain production;
only sorghum varieties with white and yellow grain types are considered;
only maize varieties with white or yellow endosperm types are considered;
barley, oat and wheat cultivars comprise the daylength-neutral types;
groundnut is grown for dry kernel production from either sequentially branched cultivars (the Spanish and Valencia types) or alternately branched cultivars (the Virginia and Castle Cary types);
sugarcane is grown for sugar production using the ‘noble’ cane cultivars;
banana is grown for fruit (pulp) production using cultivars from the genome group AAA and AAB;
oil palm is grown for oil production from the fruit mesocarp using the African oil palm stock. It is assumed that the rotation length is 30 years and time to reach first harvest is 6 years.
To enable crops to be matched to climatic conditions, the climatic inventory of Kenya was compiled to permit the interpretation of the climatic resources in terms of their suitability for production of crops. The appropriate climatic adaptability attributes of the crop dictate what parameters need to be taken into account in the compilation of the climatic inventory. The climatic adaptability attributes of crops form the basis of defining the crop climatic requirements, and are outlined in the next section.
5.1.2.1 Crop Climatic Adaptability and Requirements
Crops have climatic requirements for photosynthesis and phenology both of which bear a relationship to yield. The rate of crop photosynthesis and growth are related to the assimilation pathway and its response to temperature and radiation. However, the phenological climatic requirements, which must be met, are not specific to a photosynthetic pathway.
TABLE 5.1
List of crops included In the assessment
| Crop | Scientific name | Growth cycle (days) |
| Barley | Hordeum vulgare | 90–120 |
| 120–150 | ||
| 150–180 | ||
| Maize, lowland | Tea mays | 70–90 |
| 90–110 | ||
| 110–130 | ||
| Maize, highland | Zea mays | 120–140 |
| 140–180 | ||
| 180–200 | ||
| 200–220 | ||
| 220–280 | ||
| 280–300 | ||
| Oat | Avena sativa | 90–120 |
| 120–150 | ||
| 150–180 | ||
| Pearl millet | Pennisetum americanum | 60–80 |
| 80–100 | ||
| Rice, dryland | Oryza sativa | 90–110 |
| 110–130 | ||
| Rice, wetland | Oryza sativa | 80–100 |
| 100–120 | ||
| 120–140 | ||
| Sorghum, lowland | Sorghum bicolor | 70–90 |
| 90–110 | ||
| 110–130 | ||
| Sorghum, highland | Sorghum bicolor | 120–140 |
| 140–180 | ||
| 180–200 | ||
| 200–220 | ||
| 220–280 | ||
| 280–300 | ||
| Wheat | Triticum aestivum | 100–130 |
| 130–160 | ||
| 160–180 | ||
| Cowpea | Vigna unguiculata | 80–100 |
| 100–140 | ||
| 160–190 | ||
| Green gram | Vigna radiata | 60–80 |
| 80–100 | ||
| Groundnut | Arachis hypogaea | 80–100 |
| 100–140 | ||
| Phaseolus bean | Phaseolus spp.1 | 90–120 |
| 120–150 | ||
| 150–180 | ||
| Pigeon pea | Cajanus cajan | 130–150 |
| 150–170 | ||
| 170–190 | ||
| Soybean | Glycin max | 80–100 |
| 100–140 | ||
| Cassava | Manihot esculenta | 150–300 |
| Sweet potato | Ipomoea batatas | 115–125 |
| 125–145 | ||
| 145–155 | ||
| White potato | Solanum tuberosum | 90–110 |
| 110–130 | ||
| 130–170 | ||
| Banana | Musa spp. | 300–365 |
| Oil palm | Elais quineensis | 270–365 |
| Sugarcane | Saccharum officinarum | 210–365 |
| Coffee, arabica | Coffea arabica | 240–330 |
| Cotton | Gossypium hirsutum | 160–180 |
| Pineapple | Ananas comosus | 330–365 |
| Pyrethrum | Chrysanthemum cinerariaefolium | 210–330 |
| Sisal | Agave sisalana | 150–270 |
| Tea | Cornelia sinensis | 240–365 |
TABLE 5.2
Attributes of land utilization types
| Attribute | Low inputs | Intermediate inputs | High inputs |
| Produce and production | Rainfed cultivation of barley, maize, oat, pearl millet, dryland rice, wetland rice, sorghum, wheat, cowpea, green gram, groundnut, Phaseolus bean , pigeon pea, soybean, cassava, sweet potato, white potato, banana, oil palm and sugarcane. Sole and multiple cropping of crops only in appropriate cropping patterns and rotations. | ||
| Market orientation | Subsistence production | Subsistence production plus commercial sale of surplus | Commercial production |
| Capital intensity | Low | Intermediate with credit on accessible terms | High |
| Labour intensity | High, including uncosted family labour | Medium, including uncosted family labour | Low, family labour costed if used |
| Power source | Manual labour with hand tools | Manual labour with hand tools and/or animal traction with improved implements; some mechanization | Complete mechanization including harvesting |
| Technology | Traditional cultivars. No fertilizer or chemical pest, disease and weed control. Fallow periods. Minimum conservation measures | Improved cultivars as available. Appropriate extension packages including some fertilizer application and some chemical pest, disease and weedcontrol. Some fallow periods and some conservation measures | High yielding cultivars including hybrids. Optimum fertilizer application. Chemical pest, disease and weed control. Full conservation measures |
| Infrastructure | Market accessibility not necessary. Inadequate advisory services | Some market accessibility necessary with access to demonstration plots and services | Market accessibility essential. High level of advisory services and application of research findings |
| Land holding | Small, fragmented | Small, sometimes fragmented | Large, consolidated |
| Income level | Low | Moderate | High |
Note. No production involving irrigation or other techniques using additional water. No flood control measures.
| Characteristics | Crop stability group1 | |||
| I | II | III | IV | |
| Photosynthesis pathway | C3 | C3 | C4 | C4 |
| Rate of photosynthesis at light saturation at optimum temperature (mg CO2dm-2h-1) | 20–30 | 40–50 | > 70 | > 70 |
| Optimum temperature (°C) for maximum photosynthesis | 15–20 | 25–30 | 30–35 | 20–30 |
| Radiation intensity of maximum photosynthesis (cal cm-2min-1) | 0.2–0.6 | 0.3–0.8 | > 1.0 | > 1.0 |
| Crops included in the Kenya assessment | Barley | Cowpea | Pearl millet | Sorghum |
| Oat | Green gram | Sorghum | Maize | |
| Wheat | Pigeonpea | Maize | ||
| Phaseolus bean | Phaseolus bean | Sugarcane | ||
| White potato | Rice | |||
| Soybean | ||||
| Groundnut | ||||
| Sweet potato | ||||
| Cassava | ||||
| Banana | ||||
| Oil palm | ||||
1 For further information on crop adapatability groups see Tables 3.1 to 3.5 in FAO (1978).
In the FAO Agro-ecological Zones methodology (Kassam, Kowal and Sarraf, 1977), crops are classified into climatic adaptability groups according to their fairly distinct photosynthesis characteristics. Each group comprises crops of ‘similar ability’ in relation to potential photosynthesis, and the differences between land within groups in the response of photosynthesis to temperature and radiation determine crop-specific biomass productivity when climatic phenological requirements are met.
Crop adaptability groups and their characteristic average photosynthesis response to temperature and radiation are presented in Table 5.3. Barley, oat, wheat, phaseolus bean and white potato have a C3 photosynthesis pathway. They belong to group I and are adapted to operate under cool conditions (<20°C mean daily temperature). Cowpea, green gram, pigeonpea, rice, soybean, groundnut, sweet potato, cassava, banana and oil palm have a C3 photosynthesis pathway. They belong to group II and are adapted to operate under warm conditions (>20°C) with a potential rate of photosynthesis that is greater than in group I crops. Crops in group III (pearl millet, lowland sorghum, lowland maize and sugarcane) have a C4 photosynthesis pathway. They are adapted to operate under warm conditions (>20°C) but with a potential rate of photosynthesis that is greater than in group II crops. Crops in group IV (highland sorghum and highland maize) have a C4 photosynthesis pathway. They are adapted to operate under cool conditions (<20°C) with a potential rate of photosynthesis that is similar to that in group III crops.
TABLE 5.4
Climatic adaptability attributes of crops
| Attributes | Barley | Oat | Cowpea | Green gram | Pigeonpea |
| Species | Hordevum vulgare | Avena sativa | Vigna unguiculata | Vigna radiata | Cajanus Cajan |
| Photosynthesis pathway | C3 | C3 | C3 | C3 | C3 |
| Crop adaptability group | I | I | II | II | II |
| Days of maturity | 90–1201 | 90–1201 | 80–1004 | 60–804 | 130–1504 |
| 120–1502 | 120–1502 | 100–1404 | 80–1004 | 150–1704 | |
| 150–1803 | 150–1803 | 170–1904 | |||
| Harvested part | Seed | Seed | Seed | Seed | Seed |
| Main product | Grain (C) | Grain (C) | Grain (L) | Grain (L) | Grain (L) |
| Growth habit | Determinate | Determinate | Indeterminate | Indeterminate | Indeterminate |
| Life-span Natural | Annual | Annual | Annual | Annual | Short-term perennial |
| Cultivated | Annual | Annual | Annual | Annual | Annual/Biennial |
| Yield: Location | TI | TI | LI | LI | LI |
| Formation period | LT | LT | ME | ME | ME |
| Thermal zone for consideration | 3,4,5,6,7 | 3,4,5,6,7 | 1,2,3 | 1,2,3 | 1,2,3 |
C - Cereal
L - Legume
Tl - Terminal Inflorescence
LI - Lateral inflorescence
LT - Last one third of growth cycle
ME - Middle to end period of growth cycle
Thermal zones: 1 - >26.0 °C
2 - 22.5–25.0
3 - 20.0–22.5
4 - 17.6–20.0
5 - 15.0–17.5
6 - 12.5–15.0
7 - 10.0–12.5
1 thermal zone 3 and 4
2 thermal zone 5
3 thermal zone 6 and 7
4 thermal zone 1. 2 and 3
The time required to form yield depends on the phenological constraints on the use of time available in the growing period, and the location of yield in the plant (e.g. seed, leaf, stem, root) has an important influence. Temperature has a rate controlling/limiting effect on growth, and it may influence the growth of a specific part and the accumulation of yield if located therein. For example, in wheat, barley and oat, cool night temperatures are required for tillering but the optimum temperatures at the time of flowering and subsequent yield formation are higher. Similarly, optimum temperatures for growth in sugarcane are greater than 20°C but during the ripening period, and because the yield is located in the stem, a lower temperature in the range 10–20°C is required for concentration in the cane of sugar of the right kind. On the other hand, optimum temperatures for growth, development and yield formation in cowpea, green gram and pigeonpea are greater than 20°C and most of the specific temperature requirements are also met when temperatures are optimum for photosynthesis and growth.
The attributes that are helpful in assessing the climatic adaptability of the crops in the matching exercise are given in Table 5.4, for five example crops for adaptability groups I and II. Such information regarding the other crops is given in FAO (1978) and Kassam (1980).
Barley and oat (C3-species, group I) are annuals with a botanically determinate growth habit. Their yield is located in terminal inflorescences in seeds, and the crop yield formation period is the last one-third of their growth cycle. Their climatic adaptability attributes qualify them to be considered for matching in areas with mean daily temperatures less than 22.5 °C and more than 10°C (i.e. thermal zones 3, 4, 5, 6 and 7).
Cowpea (C3-species, group II) is an annual with botanically indeterminate growth habit, offering cultivars that may be morphologically determinate (bunch types) or indeterminate (spreading types). Its yield is located in the lateral inflorescences in seeds, and the crop yield formation period is from the middle to the end of its growth cycle. Its climatic adaptability attributes qualify it to be considered for matching in areas with mean daily temperatures greater than 20°C (i.e. thermal zones 1, 2 and 3).
Green gram (C3-species, group II) is an annual with botanically indeterminate growth habit, offering cultivars that may be morphologically determinate in growth and stature. Its yield is located in the lateral inflorescences in seeds, and the crop yield formation period is from the middle to the end of its growth cycle. Its climatic adaptability attributes qualify it to be considered for matching in areas with mean daily temperatures greater than 20°C (i.e. thermal zones 1, 2 and 3).
Pigeonpea (C3-species, group II) is a short-term perennial with botanically indeterminate but morphologically determinate growth habit. Its yield is located in the lateral inflorescences in seeds, and the crop yield formation period is from the middle to the end of its annual cultivated life-span. Its climatic adaptability attributes qualify it to be considered for matching in areas with mean daily temperatures greater than 20°C (i.e. thermal zones 1, 2 and 3).
5.1.2.2 Thermal Zone Suitability
The association between crop growth cycles and thermal zones in Kenya for the 64 crop types is presented in Table 5.5. In general, growth cycle length (number of days to maturity) of wheat, barley, oat, phaseolus bean and white potato increases by some 5 to 6 days for each 100 m increase in altitude above 1500 m, or for each 0.5 °C decrease in mean temperature from 20.0 °C. In maize and sorghum, there is generally about 20 days extention in maturation for each 100 m increase in altitude above 1500 m or for each 0.5 °C decrease in mean temperature from 20 °C. The 20 days extension in maturity is made up of some 5 to 6 days delay in flowering (silking/anthesis) and some 14 to 15 days extention in the grain filling phase or time taken to reach black layer physiological maturity. For example, 110 and 130 days to maturity correspond respectively to 63 and 69 days to tasseling or heading, 73 and 79 days to silking or anthesis, 110 and 130 days to physiological maturity.
For wheat, barley, oat, phaseolus bean and white potato, mean temperatures of 10 to 12.5 °C or below have been taken to correspond to a risk of frost damage too great for successful cultivation of these crops. Mean temperature range of 10 to 12.5 °C corresponds to 2700 – 3100 m altitude range (Section 3.1.3)
For maize and sorghum, mean temperatures below 15 °C have been considered too low for normal production because of the very severe problems with seed set and maturation. Mean temperatures below 15 °C are reached at altitudes of 2350 m and above (Section 3.1.3).
TABLE 5.5
Crop growth cycle and thermal regime associations
| Crop | Growth cycle (days | Thermal regime | |
| Range (°C)1 | Thermal zone | ||
| Barley | 90–120 | 17.5–22.5 | 3, 4 |
| 120–150 | 15.0–17.5 | 5 | |
| 150–180 | 10.0–15.0 | 6, 7 | |
| Maize (lowland) | 70–90 | > 20.0 | 1, 2, 3 |
| 90–110 | > 20.0 | 1, 2, 3 | |
| 110–130 | > 20.0 | 1, 2, 3 | |
| Maize (highland) | 120–140 | 17.5–20.0 | 4 |
| 140–180 | 17.5–20.0 | 4 | |
| 180–200 | 17.5–20.0 | 4 | |
| 200–220 | 15.0–17.5 | 5 | |
| 220–280 | 15.0–17.5 | 5 | |
| 280–300 | 15.0–17.5 | 5 | |
| Oat | 90–120 | 17.5–22.5 | 3, 4 |
| 120–150 | 15.0–17.5 | 5 | |
| 150–180 | 10.0–15.0 | 6, 7 | |
| Pearl millet | 60–80 | > 20.0 | 1, 2, 3 |
| 80–100 | > 20.0 | 1, 2, 3 | |
| Rice (dryland) | 90–110 | > 20.0 | 1, 2, 3 |
| 110–130 | > 20.0 | 1, 2, 3 | |
| Rice (wetland) | 80–100 | > 20.0 | 1, 2, 3 |
| 100–120 | > 20.0 | 1, 2, 3 | |
| 120–140 | > 20.0 | 1, 2, 3 | |
| Sorghum (highland) | 120–140 | 17.5–20.0 | 4 |
| 140–180 | 17.5–20.0 | 4 | |
| 180–200 | 17.5–20.0 | 4 | |
| 200–220 | 15.0–17.5 | 5 | |
| 220–280 | 15.0–17.5 | 5 | |
| 280–300 | 15.0–17.5 | 5 | |
| Sorghum (lowland) | 70–90 | > 20.0 | 1, 2, 3 |
| 90–110 | > 20.0 | 1, 2, 3 | |
| 110–130 | > 20.0 | 1, 2, 3 | |
| Wheat | 100–130 | 17.5–22.5 | 3, 4 |
| 130–160 | 15.0–17.5 | 5 | |
| 160–190 | 10.0–15.0 | 6, 7 | |
| Cowpea | 80–100 | > 20.0 | 1, 2, 3 |
| 100–140 | > 20.0 | 1, 2, 3 | |
| Green gram | 60–80 | > 20.0 | 1, 2, 3 |
| 80–100 | > 20.0 | 1, 2, 3 | |
| Groundnut | 80–100 | > 20.0 | 1, 2, 3 |
| 100–140 | > 20.0 | 1, 2, 3 | |
| Phaseolus bean | 90–120 | 17.5–25.0 | 2, 3, 4 |
| 120–150 | 15.0–17.5 | 5 | |
| 150–180 | 12.5–15.0 | 6 | |
| Pigeon pea | 130–150 | > 20.0 | 1,2, 3 |
| 150–170 | > 20.0 | 1,2, 3 | |
| 170–190 | > 20.0 | 1,2, 3 | |
| Soybean | 80–100 | > 17.5 | 1,2, 3, 4 |
| 100–140 | > 17.5 | 1,2, 3, 4 | |
| Cassava | 150–330 | > 17.5 | 1, 2, 3, 4 |
| Sweet potato | 115–125 | > 20.0 | 1,2, 3 |
| 125–145 | > 20.0 | 1,2, 3 | |
| 145–155 | > 20.0 | 1,2, 3 | |
| White potato | 90–110 | 15.0–22.5 | 3,4, 5 |
| 110–130 | 12.5–22.5 | 3,4, 5, 6 | |
| 130–170 | 10.0–22.5 | 3,4, 5, 6, 7 | |
| Banana | 300–365 | > 17.5 | 1,2, 3, 4 |
| Oil palm | 270–365 | > 22.5 | 1,2 |
| Sugarcane | 210–365 | > 17.5 | 1,2, 3, 4 |
| Coffee (Arabica) | 240–330 | 15.0–22.5 | 3,4, 5 |
| Cotton | 160–180 | > 20.0 | 1,2, 3 |
| Pineapple | 330–365 | > 17.5 | 1,2, 3, 4 |
| Pyrethrum | 210–330 | 10.0–20.0 | 4, 5,6, 7 |
| Sisal | 150–270 | > 17.5 | 1,2, 3, 4 |
| Tea | 240–365 | 12.5–22.5 | 3, 4, 5, 6 |
The crop thermal zone suitability ratings for each crop type are presented in Table 5.6. Five suitability classes are employed (i.e. SI, S2, S3, S4 and N), and the ratings apply to all three levels of inputs: where requirements are fully met, the zone is adjudged S1; where requirements are sub-optimal the zone is adjudged S2, S3 or S4; where requirements are not met, the zone is adjudged as N (not suitable).
A rating of S1 indicates that the temperature conditions for growth and yield physiology, and phenological development are optimal and that it is possible to achieve the maximum attainable agronomic yield potential if there are no additional climatic and/or edaphic (including landform) limitations. Ratings of S2, S3 and S4 indicate that temperature conditions for growth and development are sub-optimal and that there would be a suppression of yield potential in the order of 25, 50, and 75 percent respectively. A rating of N indicates that temperatures are not suitable for production of the crop.
TABLE 5.6
Thermal zones suitability ratings
| Crop code | Crop | Growth cycle (days) | Thermal zone | ||||||||
| T1 | T2 | T3 | T4 | T5 | T6 | T7 | T8 | T9 | |||
| 011 | Barley | 90–120 | N | N | S3 | S1 | na | na | na | N | N |
| 012 | 120–150 | N | N | na | na | S1 | na | na | N | N | |
| 013 | 150–180 | N | N | na | na | na | S2 | S4 | N | N | |
| 021 | Maize (lowland) | 70–90 | S1 | S1 | S1 | N | N | N | N | N | N |
| 022 | 90–110 | S1 | S1 | S1 | N | N | N | N | N | N | |
| 023 | 110–130 | S1 | S1 | S1 | N | N | N | N | N | N | |
| 031 | Maize (highland) | 120–140 | N | N | N | S1 | na | na | N | N | N |
| 032 | 140–180 | N | N | N | S1 | na | na | N | N | N | |
| 033 | 180–200 | N | N | N | S1 | na | na | N | N | N | |
| 034 | 200220 | N | N | N | na | na | na | N | N | N | |
| 035 | 220–280 | N | N | N | na | S2 | na | N | N | N | |
| 036 | 280–300 | N | N | N | na | S2 | S4 | N | N | N | |
| 041 | Oat | 90–120 | N | N | S4 | S2 | na | na | na | N | N |
| 042 | 120–150 | N | N | na | na | S1 | na | na | N | N | |
| 043 | 150–180 | N | N | na | na | na | na | na | N | N | |
| 051 | Pearl millet | 60–80 | S1 | S1 | S3 | N | N | N | N | N | N |
| 052 | 80–100 | S1 | S1 | S3 | N | N | N | N | N | N | |
| 061 | Rice (dryland) | 90–110 | S1 | S1 | S3 | N | N | N | N | N | N |
| 062 | 110–130 | S1 | S1 | S3 | N | N | N | N | N | N | |
| 071 | Rice (wetland) | 80–100 | S1 | S1 | S3 | N | N | N | N | N | N |
| 072 | 100–120 | S1 | S1 | S3 | N | N | N | N | N | N | |
| 073 | 120–140 | S1 | S1 | S3 | N | N | N | N | N | N | |
| 081 | Sorghum (lowland) | 70–90 | S1 | S1 | S1 | N | N | N | N | N | N |
| 082 | 90–110 | S1 | S1 | S1 | N | N | N | N | N | N | |
| 083 | 110–130 | S1 | S1 | S1 | N | N | N | N | N | N | |
| 091 | Sorghum (highland) | 120–140 | N | N | N | S1 | na | N | N | N | N |
| 092 | 140–180 | N | N | N | S1 | na | N | N | N | N | |
| 093 | 180–200 | N | N | N | S1 | na | N | N | N | N | |
| 094 | 200–220 | N | N | N | na | S3 | N | N | N | N | |
| 095 | 220–280 | N | N | N | na | S3 | N | N | N | N | |
| 096 | 280–300 | N | N | N | na | S3 | N | N | N | N | |
| 111 | Wheat | 100–130 | N | N | S4 | S1 | na | na | na | N | N |
| 112 | 130–160 | N | N | na | na | S1 | na | na | N | N | |
| 113 | 160–190 | N | N | na | na | na | S2 | S4 | N | N | |
| 211 | Cowpea | 80–100 | S1 | S1 | S3 | N | N | N | N | N | N |
| 212 | 100–140 | S1 | S1 | S3 | N | N | N | N | N | N | |
| 221 | Green gram | 60–80 | S1 | S2 | S4 | N | N | N | N | N | N |
| 222 | 80–100 | S1 | S2 | S4 | N | N | N | N | N | N | |
| 231 | Groundnut | 80–100 | S1 | S1 | S3 | N | N | N | N | N | N |
| 232 | 100–140 | S1 | S1 | S3 | N | N | N | N | N | N | |
| 241 | Phaseolus bean | 90–120 | N | S4 | S1 | S1 | na | na | N | N | N |
| 242 | 120–150 | N | na | na | na | S1 | na | N | N | N | |
| 243 | 150–180 | N | na | na | na | na | S3 | S4 | N | N | |
| 251 | Pigeon pea | 130–150 | S1 | S1 | S3 | N | N | N | N | N | N |
| 252 | 150–170 | S1 | S1 | S3 | N | N | N | N | N | N | |
| 253 | 170–190 | S1 | S1 | S3 | N | N | N | N | N | N | |
| 261 | Soybean | 80–100 | S2 | S1 | S1 | S3 | N | N | N | N | N |
| 262 | 100–140 | S2 | S1 | S1 | S3 | N | N | N | N | N | |
| 311 | Cassava | 150–130 | S1 | S1 | S2 | S4 | N | N | N | N | N |
| 321 | Sweet potato | 115–125 | S1 | S1 | S2 | S4 | N | N | N | N | N |
| 322 | 125–145 | S1 | S1 | S2 | S4 | N | N | N | N | N | |
| 323 | 145–155 | S1 | S1 | S2 | S4 | N | N | N | N | N | |
| 331 | White potato | 90–110 | N | N | S4 | S1 | S1 | na | na | N | N |
| 332 | 110–130 | N | N | S4 | S1 | S1 | S2 | na | N | N | |
| 333 | 130–170 | N | N | S4 | S1 | S1 | S2 | S4 | N | N | |
| 411 | Banana | 300–365 | S1 | S1 | S1 | S3 | N | N | N | N | N |
| 421 | Oil palm | 270–365 | S1 | S2 | N | N | N | N | N | N | N |
| 431 | Sugarcane | 210–365 | S1 | S1 | S2 | S4 | N | N | N | N | N |
| 511 | Coffee (Arabica) | 240–365 | N | N | S3 | S1 | S4 | N | N | N | N |
| 521 | Cotton | 160–180 | S1 | S1 | S3 | N | N | N | N | N | N |
| 531 | Pineapple | 330–365 | S1 | S1 | S1 | S3 | N | N | N | N | N |
| 541 | Pyrethrum | 210–330 | N | N | N | S3 | S1 | S2 | S4 | N | N |
| 551 | Sisal | 150–270 | S1 | S1 | S2 | S4 | N | N | N | N | N |
| 561 | Tea | 240–265 | N | N | S3 | S1 | S2 | S4 | N | N | N |
5.1.2.3 Length of Growing Period (LGP) Zone Suitability
(a) Individual component LGP suitability:
Potential yields with constraints for individual LGPs were derived according to the method developed by the FAO-AEZ project (Kassam 1977; FAO 1978–81) for all crops except coffee, cotton, pineapple, pyrethrum, sisal and tea. The background details for maize, pearl millet, wetland rice, sorghum, phaseolus bean, soybean, cassava, sweet potato and white potato are given in (FAO 1978); the details for groundnut, dryland rice, sugarcane, banana and oil palm are given in (FAO 1980); the details for barley, oat, cowpea, green gram and pigeonpea are given in Technical Annex 3.
Agronomically attainable yield potentials from the agro-climatic viewpoint (i.e. on suitable soils and terrain) for suitable thermal zones (i.e. thermal zones with S1 rating) are presented in the Appendix in Table A5.1 for high level of inputs, in Table AS.2 for intermediate level of inputs and in Table A5.3 for low level of inputs.
Yields in Tables A5.1, AS.2, and A5.3 refer to single crops which act as building blocks in the formulation of annual cropping patterns and crop rotations, taking into account LGP-Patterns and soil-landform constraints. Single crop yields attainable with low inputs are set at 25 percent of those attainable with high inputs. Single crop yields at the intermediate level of inputs are set half-way between the high and low inputs yields.
| Crop | LGP | ||||||||
| 150–179 | 180–209 | 210–239 | 240–269 | 270–299 | 300–329 | 330–364 | 365- | 365 + | |
| Cassava | S2 | S2 | S1 | S1 | S1 | S1 | S1 | S1 | S1 |
| Banana | N | N | N | N | SI | S1 | S1 | S1 | S1 |
| Oil palm | N | N | N | S1 | S1 | S1 | S1 | S1 | S1 |
| Sugarcane | N | N | S3 | S2 | S1 | S1 | SI | S1 | S1 |
Yields in Table A5.1, A5.2 and A5.3 apply to normal lengths of growing periods, i.e. growing period with a humid period during which precipitation is greater than full potential evapotranspiration. For intermediate growing periods, i.e. growing period with no humid period, full crop water requirements cannot be met and yield reductions are assumed to be of the order of 50% on all soils except Fluvisols and Gleysols. The percentage of occurrence of intermediate lengths of growing periods in all LGP-Pattern zones is 100% in LGP zone 1–29 days, 65% in LGP zone 30–59 days, 25% in LGP zone 60–89 days, 10% in LGP zone 90–119 days and 5% in LGP zone 120–149 days (Chapter 3).
(b) LGP-Pattern suitability:
All annual crops are matched to individual component length of growing periods, i.e. L1, L21, L22, L31, L32, L33, L41, L42, L43 and L44. The LGP-Pattern evaluation for each annual crop is achieved by taking into account all the constituent component lengths in each LGP-Pattern, thus providing a profile of variability in potential yields over time (e.g. average yield. maximum yield, minimum yield). From such information, it is then possible to set the desired level of yield stability (e.g. in terms of percentage difference between maximum yield and minimum yield or in terms of percentage difference between average yield and minimum yield) in the selection of optimum crops and crop rotations.
Perennial crops (cassava, banana, oil palm, sugarcane) are matched to total lengths of H, L1, L2, L3 and L4, with yield potential downgraded as shown in Table 5.7 for LGP-Patterns comprising L2, L3 and L4. Reduction ratings S1, S2 and S3 in Table 5.7 correspond to zero, 25% and 50% yield reduction respectively due to moisture stress. Rating of N represents unsuitable moisture conditions for crop production.
(c) Cash crops LGP and LGP-Pattern allocation ratings:
For coffee, cotton, pineapple, pyrethrum, sisal and tea allocation ratings by LGP and LGP-Patterns were formulated to enable these crops to be allocated to their suitable climatic zones on suitable soils. The LGP allocation rules at high, intermediate and low levels of inputs are given in Technical Annex 4.
(d) Fluvisols suitability:
Cultivation of Fluvisols is governed by the depth, intensity and duration of flooding which occurs in the low-lying areas of these soils. These flooding attributes are generally controlled, not by the amount of ‘on site’ rainfall but by external factors such as river flood regime, hydrological features of catchment area and catchment-site relationship.
Additionally, cultivation of these soils is normally confined to post-flood periods, the crops being grown on moisture remaining in the soil profile.
As a result of these factors Fluvisols were rated separately for all crops at high, intermediate and low levels of inputs, and the ratings are presented in Technical Annex 4.
The edaphic suitability assessment is input-specific and based on:
matching the soil requirements of crop with the soil conditions of the soil units described in the soil inventory (soil unit evaluation); and
modification of the soil unit evaluation by limitation imposed by texture, stoniness and phase.
As a medium in which roots grow and as a reservoir for water and nutrients on which plants continuously draw during their life cycle, soils are natural resource and valuable economic asset requiring protection, conservation and improvement through good husbandry.
The adequate agricultural silvicultural exploitation of the climatic potential and sustained maintenance of productivity largely depends on soil fertility and management of soil on an ecologically sound basis. Soil fertility is concerned with the ability of the soil to supply nutrients and water to enable crops to maximize the climatic resources of a given location. The fertility of a soil is determined by its both physical and chemical properties whose understanding is essential to the effective utilization of climate and crop resources for optimum production.
In order to assess suitability of soils for crop production, soil requirements of crops must be known. Further, these requirements must be understood within the context of limitations imposed by landform and other features which do not form a part of soil but may have a significant influence on the use that can be made of the soil.
5.1.3.1 Crop Edaphic Requirements and Adaptability
The basic soil requirements of crop plants may be summarized under the following headings, related to internal and external soil properties:
(a) Internal requirements:
- the soil temperature regime, as a function of the heat balance of soils as related to annual or seasonal and/or daily temperature fluctuations;
- the soil moisture regime, as a function of the water balance of soils as related to the soil's capacity to store, retain, transport and release moisture for crop growth, and/or to the soil's permeability and drainage characteristics;
- the soil aeration regime, as a function of the soil air balance as related to its capacity to supply and transport oxygen to the root zone and to remove carbon dioxide;
- the natural soil fertility regime, as related to the soil's capacity to store, retain and release plant nutrients in such kinds and proportions as required by crops during growth;
- the effective soil depth available for root development and foothold of the crop;
- soil texture at the surface and within the whole depth of soil required for normal crop development;
- the absence of soil salinity and of specific toxic substance or ions deleterious to crop growth;
- other specific properties, e.g. soil tilth as required for germination and early growth.
(b) External requirements: in addition to the above internal soil requirements of crops, a number of external soil requirements are of importance, e.g.:
- soil slope, topography and characteristics determined by micro and macrorelief of the soil;
- occurrence of flooding as related to crop susceptibility to flooding during the growing period;
- soil accessibility and trafficability under certain management systems.
From the basic soil requirements of crops, a number of crop response related soil characteristics can be derived. One of these characteristics is, for instance, soil pH. For most crops and cultivars, optimal soil pH is known and can be quantified by a range within which it is not limiting to growth. Outside the optimal range, there is a critical range within which the crop can be grown successfully but with diminished yield. Beyond the critical range, the crop cannot be expected to yield satisfactorily unless special precautionary management measures are taken.
The same holds for other soil requirements of plants related to soil characteristics. Many soil characteristics can be defined in a range that is optimal for a given crop, a range that is critical or marginal, and a range that is unsuitable under present technology.
Table 5.8 presents for five example crops of barley, oat, cowpea, green gram and pigeonpea, optimal and critical ranges of the following soil characteristics: soil slope, soil depth, soil drainage, flooding, texture and clay type, natural fertility (including cation exchange capacity, percent base saturation and organic matter), salinity, pH, free calcium carbonate content and gypsum content. Such information for other crops is given in FAO (1978–81, 1980).
TABLE 5.8
Crop edaphic adaptability inventory
| CROP | SLOPE (PERCENT) | DRAINAGE | ||||
| High inputs | Low & Int. inputs | All inputs | ||||
| Optimum | Marginal | Optimum | Marginal | Optimum | Range | |
| Barley | 0–8 | 8–16 | 0–8 | 8–24 | MW-W | I-SE |
| Oat | 0–8 | 8–16 | 0–8 | 8–24 | MW-W | I-SE |
| Cowpea | 0–8 | 8–16 | 0–8 | 8–20 | MW-W | I-SE |
| Green gram | 0–8 | 8–16 | 0–8 | 8–20 | MW-W | I-SE |
| Pigeon pea | 0–8 | 8–16 | 0–8 | 8–20 | MW-W | I-SE |
Drainage classes - I = imperfectly drained;
MW = moderately well drained;
W = well drained;
SE = somewhat excessively drained;
E = excessively drained.
| CROP | FLOODING | TEXTURE | ||||
| All inputs | High inputs | Low & Int. inputs | ||||
| Optimum | Marginal | Optimum | Range | Optimum | Range | |
| Barley | F0 | F1 | L-MCs | SL-MCs | L-SC | SL-KC |
| Oat | F0 | F1 | L-C | SL-MCs | L-SC | SL-KC |
| Cowpea | F0 | F1 | SL-SCL | LS-KC | SL-SCL | LS-KC |
| Green gram | F0 | F1 | L-CL | SL-KC | L-CL | LS-KC |
| Pigeon pea | F0 | F1 | SL-SCL | LS-KC | SL-SCL | LS-KC |
Flooding classes - F0 = no floods;
F1 = occasional flooding.
Texture classes- MCs = montmorillonitic clay, structured;
C = clay (mixed unspecified);
KC = kaolinitic clay;
SC = sandy clay;
SiCL = silty clay loam;
CL = clay loam;
SCL = sandy clay loam;
L = loam;
SL = sandy loam;
LS = loamy sand.
| CROP | DEPTH (cm) | CaCO3(%) | GYPSUM (%) | |||
| All inputs | All inputs | All inputs | ||||
| Optimum | Marginal | Optimum | Marginal | Optimum | Marginal | |
| Barley | > 50 | 25–50 | 0–30 | 30–60 | 0–5 | 5–20 |
| Oat | > 50 | 25–50 | 0–30 | 30–60 | 0–5 | 5–20 |
| Cowpea | > 75 | 50–75 | 0–20 | 20–35 | 0–3 | 3–15 |
| Green gram | > 75 | 50–75 | 0–25 | 20–35 | 0–3 | 3–15 |
| Pigeon pea | > 100 | 50–100 | 0–25 | 20–50 | 0–3 | 3–15 |
| CROP | pH | FERTILITY REQUIREMENTS | SALINITY (mmhos/cm) | ||
| All inputs | All inputs | All inputs | |||
| Optimum | Range | Range | Optimum | Range | |
| Barley | 6.0–7.5 | 5.2–8.5 | moderate | 0–8 | 8–12 |
| Oat | 6.0–7.5 | 5.2–8.2 | low/moderate | 0–5 | 5–10 |
| Cowpea | 5.2–7.5 | 5.0–8.2 | low/moderate | 0–3 | 3–6 |
| Green gram | 5.5–7.5 | 5.2–8.2 | moderate | 0–3 | 3–6 |
| Pigeon pea | 5.2–7.5 | 5.0–8.2 | low/moderate | 0–3 | 3–6 |
| CROP | ALKALINITY (ESP) | |
| All inputs | ||
| Optimum | Marginal | |
| Barley | 0–35 | 35–50 |
| Oat | 0–30 | 30–45 |
| Cowpea | 0–5 | 8–12 |
| Green gram | 0–5 | 8–12 |
| Pigeon pea | 0–5 | 8–12 |
TABLE 5.9
Relations between basic soil requirements for crops and son characteristics
| Basic soil requirements | Soil characteristics (soil factors) |
| Moisture availability1 | - Effective soil depth |
| - Available soil moisture holding capacity | |
| - Drainage | |
| Nutrient availability | - Nutrient availability |
| - Soil reaction | |
| Oxygen availability2 | - Soil permeability |
| - Drainage | |
| Foothold for roots | - Effective soil depth |
| Salinity | - Soil salinity |
| Toxicity | - Soil reaction3 |
| Accessibility and Trafficability (workability) | - Topsoil consistency and bearing capacity |
| Soil tilth for species establishment | - Topsoil consistency and bearing capacity |
1 Moisture availability is influenced by climatic factors.
2 Oxygen availability is influenced by inundation and flooding characteristics.
3 Chemical properties of soil parent material may also be involved in some cases.
Many of the soil characteristics listed above and in Table 5.9 are at least partly intrinsically related to the soil. This relationship has guided the definition of optimal and marginal ranges of the various soil characteristics and so simplified the subsequent matching of the different soil units with the inventoried soil requirements of crops.
From the basic soil requirements of crops, a number of responses related to soil characteristics have been derived. The correlation between the basic soil requirements listed above and soil characteristics that can be used as soil factors to rate crop performance is given in Table 5.9.
As explained earlier (Section 3.2.5), the soil units (Table 3.16) have been defined in terms of measurable and observable properties of the soil itself, and specific clusters of such properties are combined into ‘diagnostic horizons’ and ‘diagnostic properties’. They are also used to rate soil suitability.
5.1.3.2 Soil Unit Evaluation
The soil unit evaluation is expressed in terms of suitability ratings based on how far the soil conditions of a soil unit meet the crop requirements under a specified level of inputs. The appraisal is effected in five basic classes for each crop and level of inputs, i.e. very suitable (S1), suitable (S2), moderately suitable (S3), marginally suitable (S4), and not suitable (N).
A rating of S1 indicates that the soil conditions are optimal, and that suppression of potential yields (if any) are assumed to be slight. Ratings of S2, S3 and S4 indicate that soil conditions are sub-optimal for crop production and that potential yields would be suppressed by 25%, 50% and 75% respectively. A rating of N indicates that soil conditions are so severe that the soil unit is not suitable for crop production.
The soil unit ratings for all 25 crops are presented in Technical Annex 4.
5.1.3.3 Texture Evaluation
Soil unit ratings apply as given in Technical Annex 4 if there are no additional limitations imposed by texture. Modifications are required where limitations are imposed by texture.
Soil unit ratings remain unchanged for Arenosols (Q), Albic Arenosols (Qa), Cambic Arenosols (Qc), Ferralic Arenosols (Qf), Calcaro-cambic Arenosols (Qkc), Luvic Arenosols (Ql) and Vitric Andosols (Tv), since coarse texture limitations have been already applied in the soil unit ratings.
Soil unit ratings remain unchanged where textures are medium: fine sandy loam (FSL), sandy loam (SL), loam (L), sandy clay loam (SCL), silt loam (SL), clay loam (CL), silty clay loam (SICL) and silt (SI); or fine: sandy clay (SC), silty clay (SIC), peaty clay (PC) and clay (C).
In all other cases, i.e. soil units with coarse textures: sand (S), loamy coarse sand (LCS), fine sand (FS), loamy fine sand (LFS), and loamy sand (LS), the soil unit rating is lower by 25% for all crops except for groundnut and white potato.
5.1.3.4 Stoniness and Phase Evaluation
Soil unit ratings apply as given in Technical Annex 4 if there are no additional limitations imposed by stoniness or phase.
Limitations imposed by stoniness and phase are rated using the five basic suitability classes described above. The stoniness and phase modification ratings are presented in Technical Annex 4.
Limitations imposed by slope are taken into account in three steps. Step one defines those slopes which are permissible for cultivation by crop/land use and input level (Table 4.1).
FIGURE 5.2
Schematic presentation of the land suitability assessment programme for crop production
Step two involves the computation of potential topsoil loss, and step three relates topsoil loss to productivity loss according to the method described Chapter 4. Topsoil loss is estimated for each crop and input level using a modified Universal Soil Loss Equation (USLE: Wischmeier and Smith 1978).
The estimated topsoil losses are related to yield losses through a set of equations given in Table 4.4, taking into account the susceptibility of the individual soil units (Table 4.3), level of inputs, and regeneration capacity of topsoil (Table 4.2).
The land suitability assessment part of the productivity model (Part I, Figure S.1) when applied to the land resources inventory (Chapter 3) allows the assessment, by agro-ecological cell, of potential crop performance and consequently crop options to be selected for further processing in Part II of the model. At the same time, land that is reserved for other uses, such as cash crops zones, irrigation schemes, forest zones, reservation and conservation areas, is taken into account as appropriate.
All three assessments: the climatic suitability, the edaphic suitability and the soil erosion hazard, are required to determine the ecological land suitability for crop production of each climate-soil unit of the land resources inventory. In essence the land suitability assessment takes account of all the inventoried attributes of land and compares them with the requirements of the crops, to give an easy to understand picture of the suitability of land for crop production.
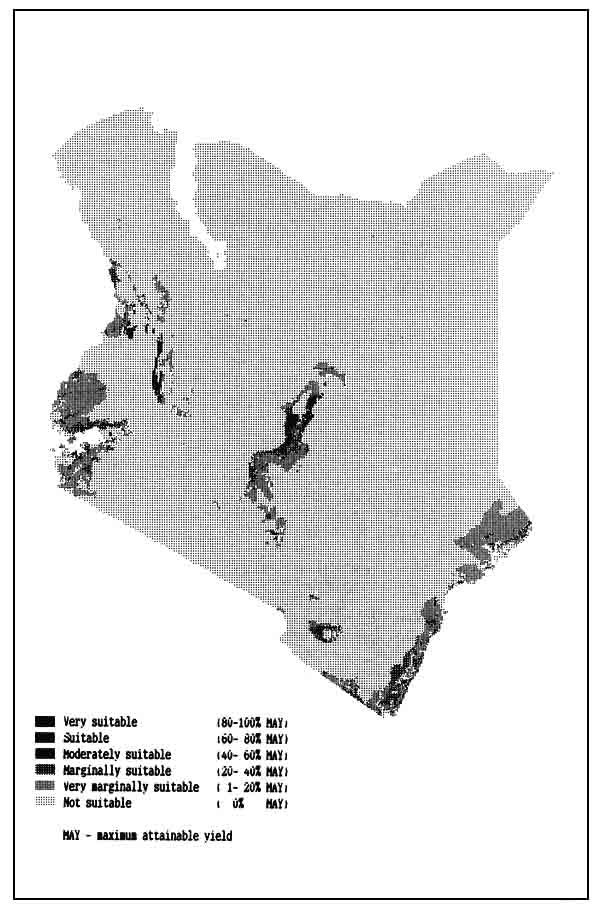
The results of the land suitability assessment are presented in five basic suitability classes, each linked to attainable yields for the three levels of inputs considered. For each level of inputs, the land suitability classes are: very suitable (VS) - 80% or more of the maximum attainable yield; suitable (S) - 60% to less than 80% of the maximum attainable yield; moderately suitable (MS) - 40% to less than 60% of the maximum attainable yields; marginally suitable (mS) - 20% to less than 40%; and not suitable (NS) - less than 20%.
Land suitability assessment is achieved by applying the programme illustrated in Figure 5.2. The assessment is carried out separately for each crop and level of inputs.
First, the temperature requirements of the crops with regard to photosynthesis and phenology are compared with the prevailing temperature conditions of each thermal zone. If they do not match, all the growing period zones in that thermal zone are classified as not suitable. If the temperature conditions of a thermal zone partially or fully match with the crop thermal requirements, all growing period zones in that thermal zone are considered for further suitability assessment according to the thermal zone rating.
This further asessment comprises application of length of growing period suitability to the computed areas of the various growing period zones by LGP-Pattern zone. Thus if the thermal zone rating of a particular growing period zone is S1, then potential yield biomass value for the growing period zone is not modified. If the thermal zone rating of the growing period zone is S3, then the potential yield biomass value for the computed extents of the period zone is decreased by 50%. The thermal and moisture suitability assessments are described in Sections 5.1.2 and 5.1.3.
The length of growing period suitability is applied according to the LGP-Pattern make-up. All annual crops are matched to the individual component length of growing period, i.e. L1, L21, L22, L31, L32, L33, L41, L42, L43 and L44. The LGP-Pattern evaluation for each crop is achieved by taking into account the constituent component lengths of each LGP-Pattern, thus providing a profile of variability in potential yields over time (e.g. average yield, maximum yield, minimum yield). Perennial crops are matched in a similar manner but to total length of growing period, i.e. L1, L2, L3 and L4 and as explained in Section 5.1.2.3.
The next step is an appraisal of the soil units present in each growing period zone. The rating of soil units, for the crops and level of inputs under consideration, is applied to the computed area of the growing period zone occupied by each soil unit. The appraisal, undertaken on the basis of the soil ratings as described in Section 5.1.3, leads to appropriate modifications of the climatic suitability assessment and the attainable yield. Subsequently, the ratings for the different soil textures, phases and stoniness are applied consecutively.
Finally, limitations imposed by slope are taken into account to arrive at the final land suitability appraisal for the crops, for the level of inputs under consideration.
The five classes of land suitabilities are related to attainable yield as a percentage of the maximum attainable under the optimum climatic, edaphic and landform conditions. Consequently the results provide for each land unit an assessment of crop production potentials which can be aggregated for any given area in Kenya.
The generalized results of land suitability assessment at intermediate level of inputs for cowpea are presented in Figure 5.3. and Technical Annex 8. It should be noted that the generalized results presented include a subdivision of the not suitable class (zero to less than 20% of maximum attainable yield) into two classes (1) very marginally suitable (more than zero to less than 20% of maximum attainable yield) and (2) not suitable (zero yield).
For a crop to qualify for selection to the list of crop options for a particular agro-ecological cell, its attainable yield in that cell must be more than the ‘threshold’ or 'critical' minimum percentage of the maximum attainable yield potential, after taking into account limitations due to climate, soil and erosion hazards.
The threshold minimum yield percentage parameter is a model variable and is set at 20%. Thus, land whose yield potential for any crop is less than 20% of its maximum attainable yield, is regarded as not suitable for production of that crop. Instead, the land would be set aside for subsequent consideration, in Part V of the model, for livestock and fuelwood production (Chapters 6 and 7).
The introduction of a threshold minimum yield potential allows the identification of a ‘gross“ list of crop options from which a further selection of crops can be made based on additional selection criteria or constraints. In the model, this additional criteria (a model variable) can be set as required, depending on the objective function driving the productivity model.
The land suitability assessment part of the crop productivity model (Part I, Figure 5.1) allows the selection of single crops to be made, for each agro-ecological cell, according to their yield potentials in the cell. The overall objective of the crop productivity model is to quantify productivity potential of each agro-ecological cell from the whole growing period, or all growing periods per year, and not just single crops from a part of the growing period.
TABLE 5.10
Definitions of the principle multiple cropping patterns
| Multiple cropping | The intensification of cropping in time and space dimensions. Growing two or more crops on the same field in a year. |
| 1. Sequential croppina: | Growing two or more crops in sequence on the same field per year. The succeeding crop is planted after the preceding crop has been harvested. Crop intensification is only in the time dimension. There is no intercrop competition. Farmers manage only one crop at a time in the field. |
| 2. Intercropping | Growing two or more crops simultaneously on the same field. Crop intensification is in both time and space dimensions. There is intercrop competition during all or part of crop growth. Farmers manage more than one crop at a time in the field. |
Source: Andrews and Kassam (1976).
TABLE 5.11
Related terminology used in multiple cropping systems
| 1. Sole Cropping: | One crop variety grown alone in pure stands at normal density. Synonymous with solid planting; opposite of intercropping. |
| 2. Sequential Monoculture: | The repetitive growing of the same sole crop on the same land in a year. |
| 3. Sequential Multiculture: | The repetitive growing of different sole crops on the same land in a year. |
| 4. Cropping Pattern: | The yearly sequence and spatial arrangement of crops or of crops and fallow on a given area. |
| 5. Cropping System: | The cropping patterns used on a farm and their interaction with farm resources, other farm enterprises, and available technology which determine their make-up. |
| 6. Land Equivalent Ratio: (LER) | The ratio of the area needed under sole cropping to one of inter-cropping at the same management level to give an equal amount of yield. LER is the sum of the fractions of the yields of the inter-crops relative to their sole crop yields. |
Source: Andrews and Kassam (1976).
The next step in the model (Part II) is therefore the formulation of cropping pattern options. This is achieved by incorporating the features of multiple cropping using the inputs specific information on land suitabilities and crop options generated through Part I of the model. Once annual cropping pattern options have been formulated, it is then possible to specify cropping pattern constraints and fallow requirements of each cropping pattern.
Multiple cropping is the intensification of cropping in the space and time dimensions, i.e. growing two or more crops on the same land in a year (Table 5.10). The various patterns of multiple cropping reflect essentially two underlying principles - that of growing individual crops in sequence, i.e. sequential cropping; or of growing crops simultaneously in mixtures, i.e. intercropping. Double (and triple, etc.), relay and ratoon cropping work on the former principle, while mixed, row, strip and alley cropping use the latter. There are several other forms of multiple cropping patterns, but these originate through synthesis of the sequential and simultaneous cropping practices. Some of the related terminology used in the multiple cropping systems is given in Table 5.11.
Crops are grown sequentially one after another so that time is used to obtain more production, or crops can be mixed and grown together simultaneously intercropped. With the latter, since the participating crops have different growth requirements, a mixture of crops of similar length to maturity can have higher productivity than a single crop. However, crops commonly used in mixtures usually differ in maturity, so their growth requirements are further separated in time, and competition between them is lower.
The principle of yield increases resulting from a better use of time with crops in sequence is complementary to increases arising from a more efficient use of space with crops in mixture. Theoretically, therefore, maximum cropping should be obtained with sequences of ‘high-yielding’ crops in compatible mixtures. In practice, this pattern has evolved in relation to the traditional resources at low and intermediate inputs circumstances where several crops are planted and harvested in mixtures at different times.
The practice of multiple cropping has been reviewed (Andrews and Kassam 1976; Kowal and Kassam 1978; Kassam 1980), and the important rainfed cropping patterns, generalized according to thermal zones and length of growing periods, are given in Table 5.12. Advantages from intercropping are numerous. These include better or fuller use of production resources of water, nutrients, heat, radiation, space and time; better distribution pattern of labour demands, better security of production, better control of pests, diseases and weeds in the absence or sub-optimal use of biocides, better control of soil erosion, and extra yield advantages (i.e. LER > 1.0). Any of these attributes, either singly or in combination, may make intercropping attractive to farmers; and even where there may be no extra yield advantages, intercropping may still be a normal practice because security of production is often a good enough reason for intercropping.
5.2.1.1 Sequential Cropping
Sequential cropping is possible in areas where conditions for crop growth exist beyond the duration of one crop, either due to longer growing period or due to more than one growing period.
In the frost-free areas in Kenya, the restriction to sequential cropping is one of availability of soil moisture. In the areas with a longer growing period, as in the moist sub-humid (growing period 210–270 days) and humid (>270 days) areas, crop growth is possible throughout much of the year. It is in such areas that a strong association with sequential cropping emerges, and sequential crops in both monoculture and multiculture are involved (Table 5.12). However, because of the cool temperatures in the thermal zones T6 and 17, sequential cropping is of minor importance because the annual crops that are adapted to the prevailing conditions are generally slow to reach maturity.
| LGP (days) | Thermal zone | ||
| T1.T2, T3 | T4, T5 | T6,T7 | |
| < 120 | SCas | SCas | SCas |
| (ls)1 | (ls) | ||
| 120–210 | SCas | SCas | SCas |
| ls + ld | ls + ld | ls | |
| (Smo + Smu) | |||
| 210–270 | SCa1 | SCa1 | SCa1 |
| ls + ld | ls + ld | ls + (ld) | |
| Smo + Smu | (Smo + Smu) | ||
| 270–365 | SCa1 + SCp | SCa1 + SCp | SCa1 + SCp |
| ld + ls | ld + ls | ls + ld | |
| Smo + Smu | (Smo + Smu) | (Smo + Smu) | |
1 Brackets indicate minor status
SCas Sole cropping of annual short-duration crops
SCa1 Sole cropping of annual long-duration crops
SCp Sole cropping of perennial crops
ls Intercropping with crops of similar lengths of maturity
ld Intercropping with crops of different lengths of maturity
Smo Sequential monoculture
Smu Sequential multiculture
5.2.1.2 Intercropping
In areas with growing periods of less than 120 days, sole cropping of short duration annual crops is dominant in all thermal zones. Some simultaneous cropping is practiced with crops of similar length to maturity, but its status in thermal zones Tl, T2, T3, T4 and T5 is a minor one. In the thermal zones T6 and. T7 growing conditions only permit a moderate to marginal production from sole cropping of single crops.
In areas with growing periods between 120 and 210 days crop mixtures, including those involving crops of different length to maturity, are common in the thermal zones Tl, T2, T3, T4 and T5. Because of the cool temperatures in T6 and T7, crop mixtures involving crops of similar length to maturity are common.
In areas with growing periods greater than 270 days, crop mixtures, especially those involving crops of different lengths of maturity, are common. In such areas, the slow growing and later maturing components generally tend to mature under better end-of-season moisture conditions. In these areas, multiple cropping both on the simultaneous and sequential principle is practised.
The cropping pattern options in Part II of the productivity model (Figure 5.1) are formulated by:
Firstly, fitting crop growth cycles into prevailing component lengths of growing periods for each agro-ecological cell. For all annual crops except wetland rice, cropping patterns are made up by fitting growth cycle lengths (full or partial) to total component length of growing period. Where crop growth cycle is curtailed due to inadequate length of growing period, it may still be considered acceptable provided the crop is able to offer a yield.
For wetland rice, growth cycle lengths are matched to the humid period of each component length. For areas with year-round humid lengths of growing periods, the humid period is also year-round. For normal lengths of growing periods, the humid period is approximately 45 days shorter than the total length. For intermediate lengths of growing periods, there is no humid period.
For cassava and the perennial crops of banana, sugarcane, oil palm, the length of crop growth cycle is taken to be equal to the length of the growing period, provided the minimum acceptable growth cycle length can be fitted.
The above matching process is applied, in each agro-ecological cell of the land resources inventory, to all component lengths of growing periods of each LGP-Pattern. This procedure allows the identification of cropping patterns for the complete range of annual cropping periods, including the worst and the best expected, in a given area; and within each year for the different expected lengths of growing periods, including the shortest and the longest.
Secondly, incorporating the ‘turn-around’ time between crops, within sequential cropping patterns, needed to harvest the first crop, prepare the land and sow the subsequent crop.
The turn-around parameter is a model variable and can be modified as required. For annuals a turn-around period of 10 days has been assumed. For banana and sugarcane a turn-around time of 15 days has been assumed in the year-round growing period zones.
Thirdly, deciding for which levels of inputs and for which crops intercropping is acceptable.
In the model this variable is formulated as follows. Intercropping is considered only at the low and intermediate level circumstance for all crops except wetland rice, sugarcane, banana and oil palm.
Once annual cropping patterns or crop combinations for each agro-ecological cell in each LGP-Pattern have been formulated, Part III of the crop productivity model (Figure 5.1) formulates crop rotation options. This is done by taking into account crop combination restrictions in space and time of cropping patterns, and fallow requirements of crop combinations that have been selected to participate in the annual cropping patterns.
These two model variables provide for sustainability of production in the longer term. Additionally, they contribute (together with yield limits imposed in the selection of single crops in Part I of the model, and the production stability parameter imposed on the selection of rotations in Part IV) to the overall stability of production system.
It is necessary to impose certain crop combination restrictions (as a model variable) for dryland cropping patterns to avoid continuous monocropping. It is also advisable to make a provision for biological nitrogen fixation in the cropping patterns at the low level of inputs circumstance.
At this stage of the model development, the reference crop combination restrictions are that no crop combination should occupy more than two-thirds share of the total cropping area during any year (i.e. total cropping hectare-days available in the agro-ecological cell). The remaining one-third of the annual cropping share of the total hectare-days be occupied by another crop combination according to the following formula.
Where the crop combination (i.e. cropping pattern) occupying the two-thirds of the cropping area is made up of non-legume crops, the remaining one-third of the cropping area should be occupied by a crop combination comprising of legume crops under the low inputs situations. Under intermediate and high inputs circumstances, the latter crop combinations should comprise of non-cereal crops if the former cropping pattern comprise of cereal crops; or non-legume crops if the former are legume crops; or non-tuber crops if the former are tuber crops.
For wetland rice, the above restrictions are not imposed and all of the annual cropping time of an area could be considered for occupation by monocultural cropping pattern, if required. Similarly, the restrictions are not applied to cassava and the perennial crops of banana, sugarcane and oil palm.
The above restrictions for annual and perennial crops may be modified if it is desired that certain proportion of the area of an agro-ecological cell or a group of agro-ecological cells be set aside for specific crops, or where the demand parameter in the objective function imposes a restriction on the types of products that are required.
In their natural state, many soils cannot be continuously cultivated without undergoing degradation. Such degradation is marked by a decrease in crop yields and a deterioration in soil structure, nutrient status and other physical, chemical and biological attributes.
Under traditional farming systems, this deterioration is controlled by alternating some years of cultivation with periods of fallow. The intensity of the necessary fallow is dependent on level of inputs, soil and climate conditions and crops. However the prime reason for incorporating fallows into crop rotations is to enhance sustainability of production through maintenance of soil nutrient fertility.
Nutrient fertility of soils (i.e. the ability of soils to supply nutrients to crops) under traditional subsistence farming (corresponding to LUTs with low inputs) depend mainly on the soil organic matter present in the humus form.
The amount of humus organic matter in soils depends on the relative rates of addition of organic residue and their subsequent breakdown. The relative rates are related to the type, extent and duration of growth of vegetation (natural or crop) and activity of soil organisms, all of which are influenced by soil and climatic conditions.
Maintenance of nutrient fertility of land, cultivated with subsistance low inputs LUTs, is achieved through natural bush or grass fallow as a means of soil fertility regeneration. With intermediate inputs LUTs, providing higher inputs to soils, means of maintaining soil fertility is through fallow which may include for a portion of the time a grass or grass-legume ley or a green manure crop.
Factors affecting changes in soil organic matter are reviewed in Nye and Greenland (1960) and in Kowal and Kassam (1978). They include temperature, rainfall, soil moisture and drainage, soil parent material, and cultivation practices.
The fallow requirements have been derived for the inventoried environmental conditions for four main groups of crops: cereals, legumes, roots and tubers, and banana and sugarcane (Technical Annex 4). The environmental frame used consists of individual soil units, thermal regime, represented by thermal zone T1 (Tmean > 25%), T2 and T3 (Tmean 20–25°C), T4 and T5 (Tmean 15–20°C) and T6, T7 and T8 (Tmean 5–15cC), and moisture regime, represented by length of growing period zones 60–89, 90–119,120–179, 180–269 and 270–365 days.
Basic values of fallow requirements (F), expressed as percentage of time during the cropping-fallow cycle (i.e. tf/(tc+tf)xlOO) the land must be put under fallow, for the low inputs LUTs were first calculated. These reference values were then modified depending on the particular crop, and Fertility Capability Classification (Fcc) of the soil (Sanchez, Couto and Buol 1982).
Reference fallow period for LGP > 270 days is 50% greater compared with those for LGP 120–269 days due to additional problems with weeds, pests and diseases, and leaching and erosion. For LGP 90–119 days fallow requirements are greater by 25% due to additional problems with fallow establishment from dry conditions and degradation hazards. For LGP 60–89 days, fallow requirements are greater by 50% due to problems with fallow establishment, degradation hazards and need to conserve moisture.
For moderately warm and moderately cool temperature regimes (T2, T3, T4, T4 and T5 zones) all reference values are decreased by 25% due to lower pest and disease problems and better fallow establishment conditions. For cool temperature regime (T6, T7, and T8 zones), reference values remain unchanged because temperature constraints on the rate of fallow establishment is considered to outweigh any advantage from lower pest and disease infestation.
Fallow requirements for Fluvisols and Gleysols are set lower because of their special moisture and fertility conditions.
Fallow requirements (F) for all suitable soil units are presented in Technical Annex 4 for the low level of inputs situations for cereals, legumes, roots and tubers, and banana and sugarcane.
Fallow requirements at the intermediate level of inputs are taken as one third of those at the low level. At the high level of inputs, fallow requirements are set at 10%.
For wetland rice on Fluvisols, fallow requirements are assumed to be 10% for all the three levels of inputs. For Gleysols, fallow requirements are 40% at the low and intermediate levels, and 10% at the high level.
For long-term perennials (i.e. oil palm, coffee, tea, sisal), fallow requirements are assumed to be nil. For short-term perennials (i.e. pineapple, pyrethrum) and cotton fallow requirements are similar to those for cereal crops.
The fallow factors have been verified against available published data and similar work done earlier by Young and Wright (1980) in the context of FAO's regional assessments.
In Part III of the productivity model (Figure 5.1), crop rotation options are formulated for each agro-ecological cell for each cropping pattern option generated in Part II of the productivity model. This is accomplished in two steps. Firstly the appropriate crop combination restrictions are applied to rule out risky or undesired crop combinations in space and time, and secondly to incorporate the appropriate fallow requirements for each suitable cropping pattern.
With cropping patterns comprising of more than one crop, average fallow requirements for the crops concerned are applied to define the rotations.
At the same time, Part III of the productivity model defines the extent of fallow land and therefore the portion of biomass that can be used for the livestock production part of the model (Chapter 6).
In Part IV of the crop productivity model (Figure 5.1), productivity potentials of land (agro-ecological cells) for each crop rotation option is quantified in three steps.
Step one quantifies the sequential crop yields of each of the crop rotation option. Step two incorporates the intercropping yield increments, and step three applies the production stability constraints (and any other constraints) as criteria for selecting optimum crop rotations and productivities.
Part IV also provides an estimate of potential crop residues, crop by-products and crop primary products that can be made available for livestock production.
Sequential cropping is possible in areas where there is either a long continuous growing period or where there are more than one growing period seperated in time due to a marked bimodel (or trimodel) nature of rainfall distribution.
A sequential cropping pattern could be a monoculture or it could be a multiculture. In the former case (e.g. two crops of rice, or white potato), participating crops are of the same adaptability group (Technical Annex 3). In the latter case, the second crop may be different but may belong to the same thermal adaptability group with a similar photosynthesis adaptability response to temperature and radiation (e.g. groundnut followed by cowpea, or pearl millet followed by lowland maize, or wheat followed by white potato) or a different thermal adaptability group (e.g. groundnut followed by lowland maize).
It is therefore an overriding condition that all crops participating in ecologically suitable and desired cropping patterns must first themselves be ecologically suitable. Accordingly, in Part I of the model, a crop type is only permitted to participate in the formulation of a reference crop rotation if its minimum yield (with climate, soil and landform constraints) for the chosen inputs level is more than 20% of its maximum attainable yield. Reference yields, including maximum yields, for situations with no thermal or soil constraints for all crops are given in Tables A5.1, A5.2 and A5.3 in the Appendix for high, intermediate and low level of inputs respectively.
The reference crop yields in Tables A5.1, A5.2 and A5.3 apply (after taking into account climate, soil and erosion constraints) when the crops are considered as single sole crops in the component growing period (i.e. no sequential cropping), or occupy the first position as sole crops in the annual sequential cropping patterns.
Two additional parameters are incorporated in the model (before single crop yields can be applied to quantify sequential crop yields) to take into account:
the increased agro-climatic constraints (e.g. increased pest and diseases, increased workability constraints) on crops when they are positioned second or third in the cropping sequence instead of being first; and
those situations when the yield formation period of the crop in the cropping sequence cannot be fully accommodated within the time available for cropping, with the consequence that there is a partial yield loss (as opposed to total crop loss).
To allow for the increased agro-climatic constraints for crops in cropping patterns with two or three crops, single sole crop yields of the second and the third crop are downgraded, as shown in Table 5.13 in comparison to the yield as the first crop. Of the 58 crop types considered in the model, cassava, sugarcane, banana and oil palm do not have the possibility of taking up a second crop position in an annual cropping pattern.
Where crops cannot complete there yield formation within the time available, yield reductions are made proportiontely to the decreases in the yield formation periods. The yield formation periods for cereal, legumes and roots and tuber crops are assumed as one-third, one-half and two-thirds respectively of their corresponding total length of normal growth cycle. This assumption is also made in defining the climatic adaptability of crops and in the calculation of net biomass and yields of crops (Technical Annex 3).
| Crop yield as first crop (% of maximum) | ||||
| Crop position | 20–40 | 40–60 | 60–80 | 80–100 |
| 2nd | 50 | 25 | 25 | 25 |
| 3rd | 75 | 50 | 25 | CM |
| LGP (days) | Inputs/Relative crop yield | |||||||||
| Low | Intermediate | |||||||||
| < 0.2 | 0.2–0.4 | 0.4–0.6 | 0.6–0.8 | 0.8–1.0 | < 0.2 | 0.2–0.4 | 0.4–0.6 | 0.6–0.8 | 0.8–1.0 | |
| < 120 | 1.0 | 1.0 | 1.0 | 1.0 | 1.0 | 1.0 | 1.0 | 1.0 | 1.0 | 1.0 |
| 120–170 | 1.0 | 1.1 | 1.2 | 1.2 | 1.3 | 1.0 | 1.05 | 1.1 | 1.1 | 1.15 |
| > 270 | 1.0 | 1.2 | 1.3 | 1.3 | 1.4 | 1.0 | 1.1 | 1.15 | 1.15 | 1.2 |
The extent of the extra contribution to production per unit area from intercropping has been described in Kassam (1980). In practice, farmers select compatible mixtures with LER values of greater than 1.0 except in situations where intercropping is still advantageous for reasons other than extra yields.
Reference LER values which have been applied in the model are given in Table 5.14. Based on evidence from surveys and experiment, it is assumed that intensifying crop production through intercropping would have its limits. At the high inputs level, the primary disadvantage of intercropping is the difficulty in mechanization, and in effectively conducting some of the cultural operations. This generally restricts the widespread use of intercropping in large farm systems, particularly when under such systems most of the advantages of intercropping no longer apply. It is, therefore, suggested that at high inputs level, there should be no extra yield advantages (LER=1.0) in production over and above that which is already reflected by sole crop yields.
At the low inputs level, the most complex patterns that are also potentially the more productive would eventually require so much labour and other resources that even the small farmer may only use them occasionally on a small part of his land. Further is is most likely that the extra yield advantages claimed under experimental conditions (e.g. LER= 1.3–1.5 in LGPs 120–270 days, LER=1.85 in LGPs >270 days) with their accompanying ‘high’ inputs would decrease by about 50% under field conditions at the low inputs level. However, it is postulated that the extra yield advantages from intercropping would increase with the increase in length of growing period; and that the maximum advantages should be with mixtures where the individual component crops are very suitably adapted to the prevailing climate and soil environment.
It is therefore suggested (as model variables in Table 5.14 that for LGP zones with less than 120 days, there would be no significant extra yield advantages (LER=1.0) from intercropping. The single sole crop yields are considered to adequately reflect the production potential.
For LGP zones with more than 120 days, the following has been applied in the model for all crops except wetland rice, sugarcane, banana and oil palm. For LGP zones 120 to 270 days under low inputs level, there is a 30% extra yield advantage (LER=1.3) from intercropping when attainable yields (from Part I of the model) of the individual participating crops are 80% or more of the maximum attainable yields. This yield advantage is reduced to nil (LER= 1.0) for participating crops with attainable yields that are less than 20% of the maximum attainable.
For LGP zones with more than 270 days, there is 40% extra yield advantage (LER= 1.4) from intercropping when the attainable yields of the individual participating crops are 80% or more of the maximum attainable yields. This yield advantage is reduced to nil (LER= 1.0) for participating crops with attainable yields that are less than 20% of the maximum attainable.
For intermediate inputs level, yield advantages from intercropping are taken as half of those at the low inputs level.
For wetland rice, sugarcane, banana and oil palm, LER of 1.0 has been applied.
It is necessary to state the level of production stability, e.g. the tolerable difference between minimum (worst year) and maximum (best year) production; the tolerable soil erosion rate, desired from the cropping patterns and rotations that are selected to meet food and other demands specified by the objective function. These constraints are introduced as model variables in the selection of cropping patterns and crop rotations and the quantification of production therefrom.
In the model, the desired level of production stability between minimum and maximum production is set at 75%. This means that the production variations from year-to-year from the selected cropping patterns would not exceed 25%.
When the crop productivity model is applied to the land resources inventory, crop productivity potentials of each agro-ecological cell are quantified taking into account the requirements and constraints imposed at the various stages in the model. Results of the crop productivity assessment at district level are presented in Technical Annex 8.
To be able to use the crop productivity potentials for planning, it is necessary to take into account the waste factor and the amount of production which is required as seed and therefore not available to enter the animal and human food chain.
The waste factor, covering post harvest losses during food processing and in the food delivery system, has been taken as 10% and can be varied as required.
The seed factors for crops are given in Technical Annex 4, and are part of the input technology matrix (Bruinsma et al. 1983; Technical Annex 7). They are applied after applying the waste factor, to arrive at the net production available.
The demand for food is expressed in terms of calorie and protein. The calorie and protein conversion factors for food products are given in Technical Annexes 4 and 7.
Once crop productivity potentials are quantified, it is possible to quantify crop residues, crop by-products (groundnut and soybean cake), and crop primary products (grain) which may be or need to be made available for livestock production (Chapter 6).
The last part of the crop productivity model (Figure 5.1) deals with the interphase with fuelwood and livestock productivity models The interphase in essence allows the possibility of considering:
fuelwood production on land assessed as not suitable for crops in Part I of the model;
fodder from fuelwood trees for livestock production;
fallow land, defined in Part III of the model, for livestock production because of the fodder potential of fallows; and
crop residue, crop by-products and crop primary products, quantified in Part IV of the model, for livestock production.
The fuelwood productivity model is described in Chapter 7. It is basically a land suitability assessment model (similar to Part I of the crop productivity model) in which land potentials for individual fuelwood tree species at three levels of inputs are quantified.
Additionally, any portion of crop land may be considered for fuelwood production depending on how much land is required for crops, livestock and other land uses.
Any land which is allocated to fuelwood production with species that offer palatable fodder would have the potential for contributing a portion of the fodder for livestock production.
Fuelwood species which offer palatable fodder to livestock are listed in Chapter 7. The amount of fodder which can be utilized by stock without affecting fuelwood yields would depend on the species and the ecological situation. However, at this stage of the model interphase development, it is assumed that about 10% of the foliage may be utilized by stock without affecting fuelwood yields. This nominal value may be modified as appropriate according to species and environment.
It is assumed that fallow land under the low level of inputs situation would be under bush or natural grass vegetation, whereas under the intermediate and high inputs situations, fallow land would be under sown pastures.
Biomass potentials for sown or natural permanent pastures is assessed in the livestock productivity model described in Chapter 6.
At this stage of the model developement, it is assumed, as a model variable, that the biomass potential from natural grass fallow under low inputs and the sown grass fallow under intermediate and high inputs, is one-third of that quantified for normal permanent or sown pastures. Also, it is assumed that only 50% of the biomass may be consumed by stock.
In areas with more than 120 days growing period, crop residues are an important source of fodder particularly for the low and intermediate technology livestock systems. Important residues are the haulms of the groundnut crop, cowpea and other legume crops, and the staves of sorghum, maize and millet and straw from rice, wheat, barley and oat.
Quantities of residues that may be available can be estimated by applying the residue factors and the corresponding utilization coefficients onto crop yields form Part IV of the crop productivity model. Residue factors and utilization coefficients for crops are given in Technical Annex 5.
By-products, defined as edible materials remaining after a crop has been processed, are bran, pollard and germ meal from cereal milling, molasses and bagasses from sugar milling, and cakes (cotton, soybean, groundnut) from oilseeds.
Quantities of crop by-products that may be available can be estimated by applying the by-product factors and the corresponding utilization coefficients onto crop yields. By-product factors and utilization coefficients for crops are given in Technical Annex 5.
Crop primary products apply to grain used for the purpose of feeding to animal either directly in an unprocessed form or in a processed form. Main cereals used in Kenya are maize, sorghum, wheat and barley.
Direct feeding of grain is used in cattle and goat dairy systems, and the intensive livestock industries of poultry and pig production tend to use processed feed. The amount of primary products in the livestock feed requirements for the different livestock production systems are given in Chapter 6.
![]()
![]()
![]()