![]()
![]()
![]()
T.H. Booth
Trevor H. Booth is with the Division of Forestry and Forest Products of the Commonwealth Scientific and Industrial Research Organization (CSIRO), Canberra, Australia.
Selecting the most suitable trees for initial trials can make the difference between a successful project and a failure, but the selection process can be a difficult task. This article briefly describes some of the methods used in the past and outlines new techniques that make use of recent developments in interpolation analysis. These developments allow climatic conditions to be estimated reliably for sites which may be some distance from recording stations. This information can be used to build up descriptions of species and provenance requirements, to map regions with suitable conditions, and to assess the suitability of specific sites.
Tree planting may be required for a wide variety of purposes, including products (fuelwood, timber, fruits and other edibles, latexes and resins, etc.) and services (shade, land stabilization, etc.). Species already found in the area under consideration can often fulfil these needs and should always be assessed. However, in forestry as in agriculture, introduced species may often be more productive.
If introduced species and provenances are to be considered, the choice is vast. Many lesser-known species are now being evaluated for multipurpose use (Turnbull, 1986; Boland, 1989), while provenance studies are being carried out for many well-known species (Eldridge et al., 1990). The CSIRO's Australian Tree Seed Centre alone can supply over 10000 genetically distinct samples of seed from over 500 species. For the past five years the Australian Centre for International Agricultural Research (ACIAR) has been supporting a programme of research to develop methods to assist the selection process.
More than 30 years ago, FAO (1958) published a review of methods used for tree species selection from around the world. It noted the important influences of climate, soil and topography on site suitability' as well as the value of natural vegetation as an indicator of environmental conditions. The publication also discussed the need to consider the objectives of tree planting, as well as pest and disease risks. However, most of the book described various methods of classifying the world's climate and vegetation. The authors concluded that "it is the combination of rainfall, especially its distribution and the length of the dry seasons, and the temperature regime that determines what species grow or can grow in an area, subject to modifications brought about by the soil, particularly its water holding capacity".
The importance of both climate and soils was also recognized by Golfari (1963) who reviewed the climatic requirements of tropical and subtropical conifers (mostly in Latin America) and described how the natural distribution of a species provided a first indication of its environmental requirements. Golfari tabulated ranges of temperature and rainfall conditions estimated from the natural distributions of 31 species. But he went on to discuss how many species could be grown successfully in environments somewhat different from those found in their natural locations. He suggested that it would be useful "to specify for each species and its ecotypes, if any, the optimum climates and also the limits within which their use as forest species is advisable". He presented ranges for five climatic factors (seasonal rainfall distribution, annual rainfall, mean maximum temperature, mean minimum temperature, absolute minimum temperature) defining ideal growing conditions for three pine species based on their natural distributions and results from trials.
Though Golfari recognized the value of individual descriptions of species requirements he found it was not convenient to provide dozens of individual maps indicating where different species might grow. So, Golfari et al. (1978) divided Brazil into 26 bioclimatic zones according to altitude, climate and vegetation types. On the basis of their knowledge of natural distributions and performance in trials they tentatively suggested which species should be suitable for each zone. Similar maps of bioclimatic zones and lists of species recommendations have been produced for several other countries and regions (e.g. Poynton, 1979).
Until computers became widely available, maps and lists of suitable species provided one of the most effective means of storing information about species suitability. With the rapid increase in microcomputer availability in the 1980s, new methods were devised to assist species selection. Webb et al. (1980) prepared a compendium of information on species suitable for tropical and subtropical plantations. In the revised second edition (1984) they provided information on taxonomy, natural occurrence, climate and soil requirements, silviculture, productive potential, role in land use, timber qualities, uses, seed characteristics and principal pests and diseases for 173 species. They also supplied a computer program called INSPIRE, which could search this data base and indicate species suitable for particular conditions and uses. Again, the importance of climatic factors was recognized, with climate-related information providing seven of the 21 factors which could be searched using the program (altitude was included in the climatic group of factors, so it could be used if temperature data were not available). The aim of the INSPIRE program was to assist foresters in selecting species for trials; the authors were careful to emphasize the need for in situ trials before large-scale planting programmes were begun.
The INSPIRE program was a remarkable achievement. It was one of the first applications of an expert system or decision support program in any natural resource study. Versions of the program were supplied first for mainframe computers and later for Apple II and IBM PC microcomputers.
However, the INSPIRE data base suffered the same limitations experienced by all previous methods of species selection. There was no clear link between observations at either natural or trial sites and the summary descriptions of species requirements. In the case of climate, meteorological stations were seldom situated near either natural or trial sites, so climatic conditions had to be guessed or estimated by crude interpolations.
The new methods of climatic analysis outlined in this article make use of recent developments in interpolation, which allow mean climatic conditions to be reliably estimated for locations some distance from meteorological stations (Hutchinson et al., 1984). For example, data from more than 1000 temperature and more than 7000 rainfall recording stations were analysed to provide "interpolation surfaces" for Australia. Given the latitude, longitude and elevation of any site, mean monthly values of maximum and minimum temperature can be estimated with an error usually well below 0.5°C. Rainfall is more variable, but mean monthly values with an error of less than 10 percent can be obtained over most of the country.
As Golfari and others have noted, a species' natural distribution can give a first impression of its climatic requirements, but many species can grow successfully in somewhat different environments. The new methods of climatic analysis use interpolation surfaces to analyse conditions at both natural and trial sites, to map regions with suitable environments, and to determine conditions at new trial sites. At each stage the climatic interpolation surfaces allow these conditions to be estimated with much greater accuracy than previously possible.
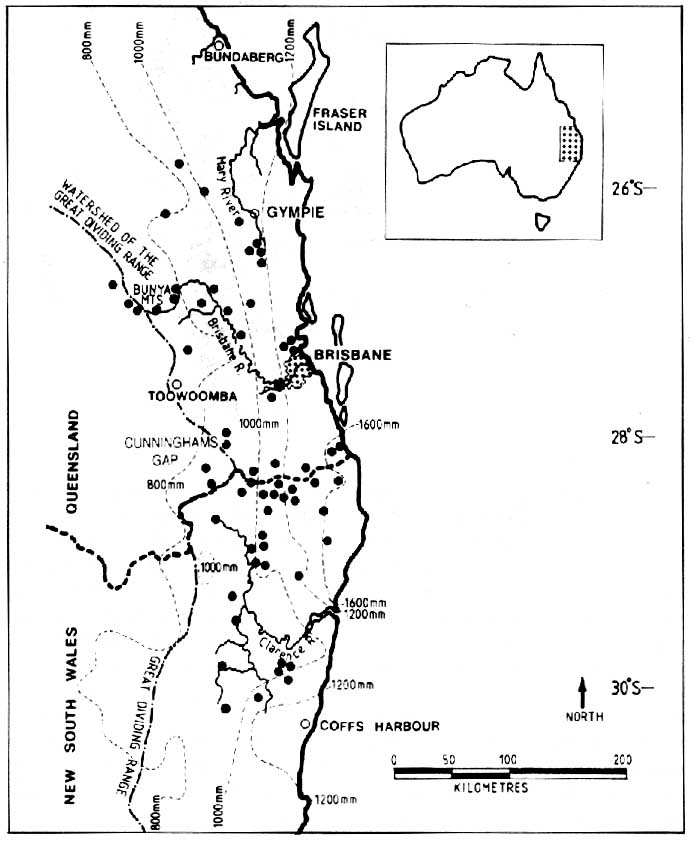
The first stage in the process is to analyse the natural distribution of a species. Let us consider Grevillea robusta as an example. This is a species which has considerable potential for use in Africa as an agroforestry species (Harwood, 1989). It has a quite limited natural distribution on the east coast of Australia (see Figure 1). Climatic conditions have been analysed for 25 natural locations where latitude, longitude and elevation were known (Booth and Jovanovic, 1988). This analysis was carried out using the BIOCLIM program devised by Nix, Busby and Hutchinson (Nix, 1986), which uses the Australian interpolation surfaces to estimate mean climatic conditions at each site. The range of some important climatic conditions was as follows:
|
Mean annual rainfall |
720-1720 mm |
|
Rainfall regime |
summer |
|
Mean max. temperature, hottest month |
25.0-30.5°C |
|
Mean min. temperature, coldest month |
2.0-8.0°C |
|
Mean annual temperature |
14.5-20.0°C |
The range of climatic conditions determined using the interpolation surfaces was much greater than had previously been estimated. For example, Boland et al. (1984) estimated the range of mean annual rainfall to be 1000-1500 mm and the mean minimum of the coldest month to be 5-6°C.
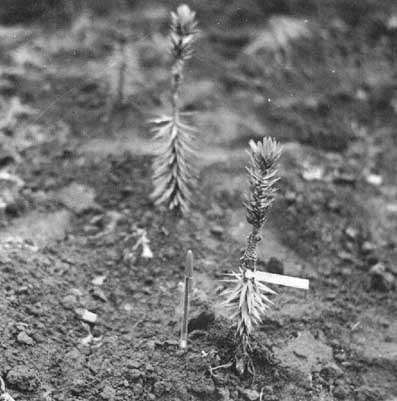
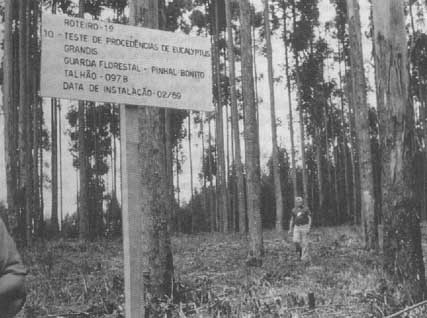
As Golfari and others have noted, estimating conditions within the natural distribution is only the first stage in analysing a species' climatic requirements. Results of trials can then be used to improve the description. For example, G. robusta is grown successfully at the International Council for Research in Agroforestry research station at Machakos, near Nairobi. The conditions there are somewhat drier and hotter than those found within G. robusta's natural distribution. To include this successful result, the mean annual rainfall range could be modified to 664-1720 mm and the mean minimum temperature of the coldest month raised to 11.5°C. Data from hundreds of trial locations can be used in this way to develop improved descriptions of climatic requirements. For example, Booth et al. (1988)analysed the climatic requirements of 12 important eucalypt species using over 1400 observations of natural occurrence and over 400 observations from trials in Africa. Climatic interpolation surfaces were developed for Africa, so that mean climatic conditions could be estimated for the many trial sites where data were not available.
Information from trials can be used to contract suitable climatic limits as well as expand them. For example, natural stands of Eucalyptus grandis, are found in areas where the mean minimum temperature of the coldest month is as low as -1°C. However, successful plantations are not generally found where this minimum falls below 3°C, so this is a more appropriate limit for identifying other locations suitable for plantations. For some species, so much information is available from trials that descriptions of climatic requirements can be based solely on results from successful trials.
As descriptions of climatic requirements evolve from analysis of natural and exotic locations, it would be useful to be able to produce maps indicating areas with suitable conditions. For Golfari and others it was difficult to produce large numbers of maps or to frequently modify them. With modern computer technology it is easy to generate maps on microcomputers. Descriptions of climatic requirements can be tailored to individual species, rather than being approximated by existing classifications. In this way, individual climatic limits can be clearly related to specific observations at natural or trial sites. Both descriptions and maps can, if necessary, be rapidly and easily modified when new information becomes available.
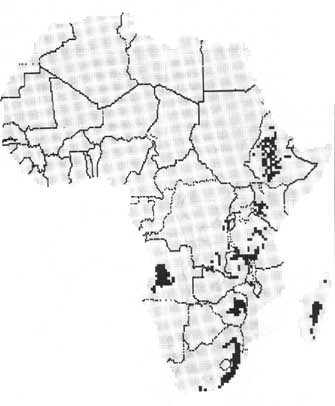
The mapping programs also use data developed from the interpolation programs. For example, a program has been written to evaluate climatic conditions at over 10000 locations in a regular half-degree grid across Africa (Booth et al., 1989a). The program uses climatic data developed from an analysis of data from over 1100 meteorological stations. Climatic descriptions can be entered for any or all of the six climatic factors used by Webb et al. (1980; 1984). Figure 2 shows the areas of Africa which satisfy the climatic requirements of G. robusta determined from an analysis of its natural distribution and the successful result at Machakos. The areas shown as climatically suitable in Figure 2 correspond well with the regions in Africa where G. robusta has actually become significant (Harwood, 1989). If one is only concerned with a particular country it would be desirable to have a more detailed map. Another microcomputer program has been written to enable mean climatic conditions to be examined at 5000 locations in a 10-km-spaced grid across Zimbabwe (Booth et al., 1989b). The program was developed using data from over 480 meteorological stations. Both generally suitable and optimum climates for Eucalyptus grandis can be mapped using the program. To provide more detailed information for specific locations another program was developed which allows monthly values of mean maximum temperature, mean minimum temperature, mean precipitation and mean evaporation to be estimated for any location in Zimbabwe. This enables climatic conditions to be assessed at any future planting site.
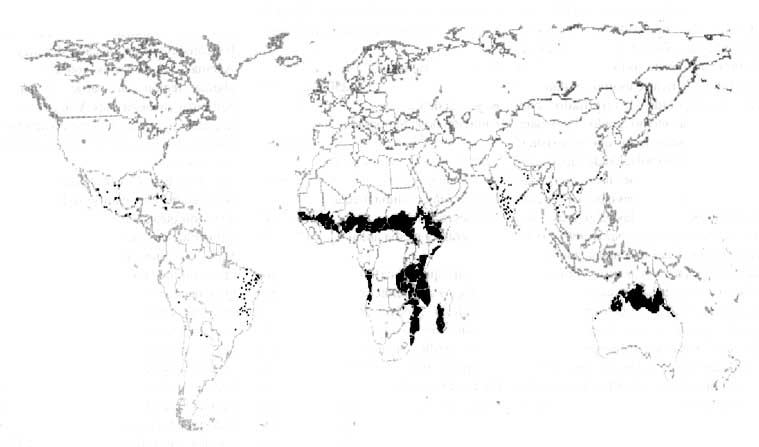
These mapping programs were found to be so useful that a similar worldwide program was written (Booth, 1990a). The program contains climatic data for over 15000 locations around the world. Data for half-degree interpolated grids were used for Australia and Africa. But data from actual meteorological stations had to be used for other continents, as interpolation relationships were not available. Descriptions of climatic requirements can be entered for any or all of the six climatic factors used by Webb et al. (1980; 1984). A world map is produced on the computer screen, with green dots indicating locations which satisfy all the requirements and red dots indicating those which fail. A cursor can be moved over any one of the locations, and detailed data can be examined for that location. This allows descriptions of climatic requirements to be quickly checked and improved without the need for the detailed analysis described above. For example, Webb et al. (1984) described the climatic requirements of northern provenances of Eucalyptus camaldulensis (e.g. Petford and Katherine) as follows:
|
Mean annual rainfall |
250-1250 mm |
|
Rainfall regime |
summer |
|
Dry-season length |
4-8 months |
|
Mean max. temperature, hottest month |
28-36°C |
|
Mean min. temperature, coldest month |
10-22°C |
|
Mean annual temperature |
19-26°C |
The map produced using this description was shown to Professor Lindsay Pryor, an expert on eucalypt introductions. He quickly recognized that the description should be modified to include more locations in India and Southeast Asia. As a first modification he suggested increasing the mean maximum temperature of the hottest month to 40°C and increasing the mean annual temperature limit to 28°C (see Figure 3). Producing maps like this helps to capture expert opinion rapidly and complements the detailed methods of analysis. The consequences of particular descriptions are clearly shown. Individuals with experience in particular regions can contribute to the task of improving descriptions. Most importantly, information can be shared to the mutual benefit of people in many countries.
The WORLD program (Booth, 1990a) also showed the need to add another factor to the set of six climatic factors chosen by Webb et al. (1980; 1984). Some regions which experience similar mean minimum temperatures of the coldest month have very different absolute (i.e. record) minimum temperatures. These occasionally severe frosts can have devastating effects on some tree species. For example, some eucalypt plantations in the southeastern United States, southern states of the USSR (Georgia, Azerbaijan) and several areas of central Italy have been seriously affected by frosts. For species such as these, defining an absolute temperature limit is important to identify suitable sites.
Though the methods described here are extremely useful they have a number of limitations and must be used with due caution. The seven climatic factors must be considered in a matrix rather than in isolation. For example, a theoretical taxon might be found growing at two stations, one with 500 mm of annual rainfall and 10°C mean annual temperature, and the other with 1500 mm annual rainfall and 20°C mean annual temperature. The amplitude of the range is 10-20°C and 500-1500 mm annual rainfall, but the plant will not grow at 20°C with only 500 mm of annual precipitation.
In addition to climatic conditions it is important to consider other factors, such as soils, pests/diseases and socioeconomic requirements (FAO, 1984). In the past the difficulty of collecting: data has been a problem in carrying out detailed analyses. However, this should lessen in the future, as several organizations are developing computerized data bases of trial results (e.g. Brown et al., 1989). Although the methods were developed using Australian species, this is not a limitations as the methods could be applied to any species. Where sufficient data are available from trials, the climatic requirements of particular provenances or clones can also be described. Moreover, the methods are not restricted to exotic species. Analyses of climatic conditions within species' natural distributions can assist in identifying which native species should be considered for trials.
Perhaps the greatest limitation of the existing methods is that they only suggest areas where a species may or may not be worth testing. At best they can suggest where the optimum climates exist. They do not predict how well a species will grow at a particular site. This is a much more difficult problem. In 1976 FAO began its agro-ecological zones project, which developed edaphic (soil) and climatic assessment methods for 12 important crop species. These methods were used to map very suitable, suitable, marginally suitable and unsuitable areas within five large regions, including 117 developing countries (FAO, 1978-81). A microcomputer program has recently been developed which combines the FAO soil evaluation system with a model designed by Hackett (1988) to assess the performance of lesser-known plant species (Booth, 1990b). The program can assess soil, climatic and overall limitations for over 10000 locations in Africa. Detailed simulations of monthly growth limitations can be examined for any location. Much remains to be done to develop and test appropriate descriptions for important tree species and provenances. However, we need models such as this to provide better predictions of not only where particular trees can be grown, but how well they will grow.
Boland, D.J. 1989. Trees for the tropics: growing Australian multipurpose trees and shrubs in developing countries. Canberra, ACIAR.
Boland, D.J. et al. 1984. Forest trees of Australia. 4th ed. Melbourne, Australia, Nelson & CSIRO.
Booth, T.H. 1990a. Mapping regions climatically suitable for particular species at the global scale. For. Ecol. Manage. (In press)
Booth, T.H. 1990b. A climatic/edaphic data base and plant growth modelling system for Africa. (Submitted to Ecol. Modelling)
Booth, T.H. & Jovanovic, T. 1988. Assaying natural climatic variability in some Australian species with fuelwood and agroforestry potential. Commonw. For. Rev., 67: 27-34.
Booth, T.H. et al. 1988. Niche analysis and tree species introduction. For. Ecol. Manage., 23: 47-59.
Booth, T.H. et al. 1989a. Mapping regions climatically suitable for particular species: an example using Africa. For. Ecol. Manage., 28: 19-31.
Booth, T.H. et al, 1989b. Identifying areas within a country climatically suitable for particular tree species: an example using Zimbabwe. Intern. Tree Crops J., 6: 1-16.
Brown, A.G. et al. 1989. TREDAT: a tree crop data base. Aust. For., 52: 23-29.
Eldridge K.G. et al, 1990. Eucalypt breeding. London, Oxford University Press. (In press)
FAO. 1958. Choice of tree species. Forestry Development Paper No. 13. Rome.
FAO. 1978-81. Reports of the agro-ecological zones project. World Soil Resources Report No. 48: Vol. 1 - Methodology and results for Africa; Vol. 2 - Southwest Asia; Vol. 3 - South and Central America; Vol. 4 - Southeast Asia. Rome.
FAO. 1984. Land evaluation for forestry. FAO Forestry Paper No. 48. Rome.
Golfari, L. 1963. Climatic requirements of tropical and subtropical conifers. Unasylva, (17)68: 33-42.
Golfari, L., Caser, R.L. & Moura, V.P.G. 1978. Zoneamento ecologico esquematico para reflorestamento no Brasil [Schematic ecological zoning for replanting in Brazil]. UNDP/FAO/IBDF/BRA-45. Serie Tecnica No. 11. Belo Horizonte, Brazil, Centro de Pesquisa Florestal da Regiao do Cerrado, FAO.
Hackett, C. 1988. Matching plants and land. Natural Resources series, No. 11. Canberra, CSIRO Division of Water and Land Resources.
Harwood, C.E. 1989. Grevillea robusta: an annotated bibliography. International Council for Research in Agroforestry. Nairobi, Kenya.
Hutchinson, M.F. et al. 1984. Estimating monthly mean values of daily total solar radiation for Australia. Solar Energy, 32: 277-290.
Nix, H.A. 1986. A biogeographic analysis of Australian Elapid snakes. In R. Longmore, ed. Atlas of Australian elapid snakes, pp. 415. Canberra. ACT, Australian Bureau of Flora and Fauna.
Poynton, R.J. 1979. Tree planting in southern Africa, Vol. 2. The eucalypts Johannesburg, South Africa, Dept. of Forestry.
Turnbull, J.W., ed. 1986. Multipurpose Australian trees and shrubs: lesser-known species for fuelwood and agroforestry. Canberra, ACIAR.
Webb, D.B., Wood, P.J. & Smith, J. 1980. A guide to species selection for tropical and subtropical plantations. Trop. For. Paper 15. Oxford, Commonwealth Forestry Institute.
Webb, D.B., Wood, P.J. & Smith, J. 1984. A guide to species selection for tropical and subtropical plantations. Trop. For. Paper 15 (2nd edition), Oxford, Commonwealth Forestry Institute.
![]()
![]()
![]()