![]()
![]()
![]()
K.D. Singh
An analysis of the methodology and results of the most recent FAO assessment of forest resources in developing countries.
Karn Deo Singh is Coordinator of FAO's 1990 Forest Resources Assessment Project.
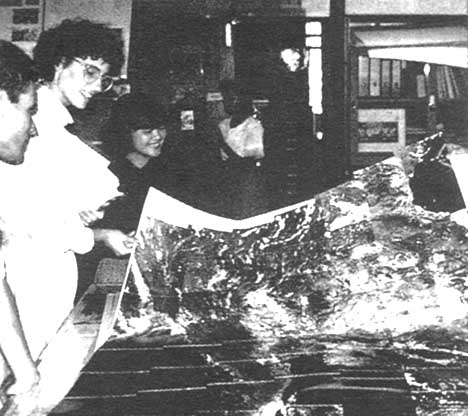
Staff of the Forest Resources Assessment 1990 Project examining remote sensing imagery
Since the United Nations Conference on the Human Environment, held in Stockholm in 1972, forests in general, and tropical forests in particular, have been drawing the increasing attention of the world community. The United Nations Conference on Environment and Development (UNCED), held in Rio de Janeiro in 1992, agreed on a set of "Principles for a global consensus on the management, conservation and sustainable development of all types of forests" and devoted a full chapter of its Agenda 21 to "Combating deforestation".
With growing insistence, policy-makers, the scientific community and the public at large have posed questions such as: What is the area of the remaining tropical forests? At what rate are they being depleted? Is the rate of deforestation accelerating or slowing down? What are the causes? What are the impacts?
The FAO/UNEP Tropical Forest Assessment of 1980 was a pioneering attempt to answer some of these questions. Completed in 1982, this assessment provided the first comprehensive and statistically consistent picture of forest resources in tropical countries and of the trends in deforestation and afforestation. The results of the project at global, regional and national levels have been widely used since then.
In the intervening years, there have been many indications that the reduction and degradation of the world's tropical forests have continued and even accelerated, while the main causes have remained largely unattended. New issues have also arisen, including questions about global climate change and loss of biodiversity, which demand updated data, increased precision of estimates and new types of information.
Against this background, it was decided to conduct a new assessment of tropical forest resources. The new assessment was expected to be implemented on a continuing basis, not only to provide results but also to build a database and contribute to the knowledge base needed to support an action programme aimed at combating deforestation. An important prerequisite for a continuous forest inventory on a global basis would be the development of an institutional base at the national and international levels for this purpose.
With specific regard to estimating the rate of deforestation, there were four main requirements for the technique to be developed and applied:
i) The database and technique used should be verifiable (and replicable).ii) The technique should have a statistical basis and provide not only an estimate of mean but also its confidence limits (e.g. mean deforestation rate and the standard error). Such an approach would permit the reduction of error limits by increasing the sampling intensity over time.
iii) As deforestation is a dynamic process, the need was for a procedure which could be used periodically to provide consistent and comparable estimates.
iv) The technique should permit conclusions to be drawn regarding the causes and impact of deforestation.
In order to cope satisfactorily with the above requirements in a cost-effective manner, a two-phase design was developed.
The first phase consisted of a statistical assessment based on existing information. A second phase was based on the assessment of remote sensing (multidate high-resolution satellite) data.
Phase 1: Forest resources assessment based on existing national data
In the past, only statistical data were collected and analysed as part of the global assessment but, in the 1990 assessment, both statistical and spatial data were collected and utilized from the existing records of national forest inventories.
Statistical data. The statistical data relate to forest cover area at subnational levels (in more than one time period, if available); to growing stock, utilization and forest management; and to protected area status at a country level. Such data collection is relatively economical but there are a number of limitations, including variations among countries in classification schemes, accuracy and survey dates. In order to permit the comparison of data in a common framework, Guidelines for assessment based on existing survey data was published by FAO in 1990.
The collected data, after being reviewed, were organized, stored and prepared for standard reporting in a combined database, using software specifically designed by the project for easy entry, retrieval and storage. Called the Forest Resources Information System (FORTS), it provides a facility for standard reporting of the data. Using dBASE IVTM software on personal computers, FORIS (1990) is a ready-made package requiring only minimum computer knowledge to enter, correct and print data. Therefore, it is particularly suited to use in developing countries where it can find its application as a national forest information system. FORIS is supported by BIBLIO, a database programme for easy handling of bibliographical references for forest resources information.
Spatial data. The spatial (cartographic) data serve as a source of location-specific information and support model studies on the deforestation process. From the outset it was realized that a geographic information system (GIS) was essential for handling data from a variety of sources and in a variety of formats, including statistical and spatial data, and in different projections as well. GIS databases for the tropical regions include: a vegetation map of the tropics; ecofloristic zones; ecological zones; Landsat 4 and 5; World Reference System 2 (WRS2) Grid; population density and annual population growth; potential global and forest biomass; administrative (political) boundaries; mean annual precipitation and biotemperature; topography; protected areas; a vegetation map (for some regions) from Advanced Very High Resolution Radiometer (AVHRR) satellite imagery of the [United States] National Oceanic and Atmospheric Administration (NOAA).
The deforestation model. The forest cover data contained in FORIS are based on country assessments which are prepared on different dates and which, for reporting purposes, need to be adapted to the standard reference years, namely 1980 and 1990. This was done with the help of an adjustment function, called the deforestation model, developed to permit the correlation of forest cover change over time with ancillary variables, including population change, initial forest cover and the ecological zone of the forest area under consideration, density and growth and socio-economic parameters. The model interprets the human/forest interaction as a biological growth process. Very much like other biological growth processes, deforestation is observed to increase relatively slowly at initial stages, much faster at intermediate stages and to slow down at final stages.
The multiple uses and values of trees and forests argue strongly for their sustainable management, a prerequisite for which is ongoing assessment
Figure 1. Illustration of model curves for different ecological zones
The adjustment function, expressed in the form of a differential equation, is as follows:
where:
Y is the percentage of non-forested area in a subnational unit computed asY = 100 * (total area - forest area)/(total area);
P = ln(1 + population density) with population density expressed in persons per km²;
dY/dP is the derivative of Y with respect to P, that is the rate at which Y changes in response to a unitary change in P;
b1, b2 and b3 are the model parameters.
The coefficient b1 relates to the influence of the ecological zone in the human/forest (or human/non-forest) interaction, b2 represents the as yet unidentified factor or combination of factors that cause the deceleration of deforestation between the intermediate and final stages, b3 is related to the land area that is theoretically not available for agricultural or forest use, nor subject to deforestation, e.g. deserts; very steep, highly elevated mountain slopes; urban, industrialized areas.
Figure 2. Forest proportions in relation to population density, by forest formations
The model was based on more than 100 multidate observations (often up to six observations) of deforestation in different ecological zones, and on population dynamics data for the same multidate periods. The model was validated using a set of 16 multidate observations that were not used to build the model. The mean difference between the observed and the predicted changes was 10.6 percent. The residual distribution, despite some large deviations in the case of some subnational units, was quite symmetrical, with no evidence of bias (see Figs 1 and 2 for a graphic representation of estimated and observed forest cover).
It was of major interest to examine cases where there were large deviations between the model and observed changes, as they provided insights into the impact of development programmes on forest cover changes. Efforts producing significant deviations included major human settlement projects and agricultural development efforts (e.g. in Sumatra), road building (e.g. the Trans-Amazonia highway), or major afforestation programmes (e.g. some areas in India). It has been proposed to expand the model in the future to incorporate such factors if they can be reliably quantified.
In using the model, the most recent reliable forest inventory data for each national or subnational unit are used as baseline and forest cover area, together with the corresponding population density, population growth and ecological zone area. In addition to adjusting forest cover area data of countries to the standard reference year 1990, the equation can also be used to produce estimates of the forest cover area change over the period 19811990, even in cases where only a single reference point is available. When historical data on demographic developments are available, the model can be used to simulate past trends in changes of forest cover associated with population growth. This may be useful in the context of global change studies in which researchers need to draw conclusions on historical trends.
Phase 2: Forest cover change assessment based on remote sensing
Phase 2 of the 1990 resources assessment project was designed to permit the continuous assessment of forest cover and changes on a pan-tropical basis, using an efficient sampling technique that covers all forest types. The main data source for this phase was multidate high-resolution satellite images [Ed note: see article by Malingreau]. An image from close to 1990 enables an assessment of the extent of forest cover whereas a comparison between the 1990 image and one from near 1980 permits an assessment of change over time.
The sample survey design. The World Reference System 2 (WRS2) for the Landsat satellites was used as the sampling frame (Landsat scenes cover approximately 3.4 million ha). The sampling design ensured coverage of all tropical countries.
The methodology is based on a two-stage, stratified random sample. In the first stage the survey area is divided into subregions on a geographic basis. In the second stage, the subregions are divided into forest cover strata. Within a subregion, sampling units are selected, with probability proportional to the land area of the sampling units.
A distinctive feature of the methodology lies in the fact that, in addition to annual estimates and standard error thereof, it also permits the generation of change maps and matrices for each sample location.
This enables the evaluation of class-to-class changes of land use and forest categories between the two dates of interpretation: information that is essential for understanding the process of deforestation and forest degradation.
A number of regional and national remote sensing institutions were involved in the interpretation work. With the dual objectives of strengthening national capacities for forest cover monitoring and improving the quality of image interpretation, the interpretation technique was disseminated by way of regional training workshops. The final results and quality of the output were centrally analysed and evaluated.
Differences between the 1990 and 1980 assessments
There were a number of important differences in the approach and implementation of the two assessments. The 1980 assessment, in estimating annual rate of deforestation, used an empirical approach to deriving change estimates for forest cover. The focus of the 1990 Forest Resources Assessment Project was not only on presenting the state of resources but also in estimating changes during the period 1981 to 1990. For this purpose historical forest cover data were compiled, in some cases dating back to the 1930s and 1940s. For some countries, data from up to six forest inventories were collected.
The 1980 assessment compiled and reported the data at the country level, while the Forest Resources Assessment 1990 collected forest cover information at a subnational level (province, state). As the 1990 Forest Resources Assessment Project intended to study causes and effects of deforestation and forest degradation, quantitative indicators had to be found that could be related to forest cover. These were the basis for the model approach in which forest cover data were related to factors such as population, population growth and socio-economic conditions.
A new activity of the 1990 assessment consisted in the application of a GIS as a tool to integrate and analyse spatial, statistical and remote sensing data.
In the 1980 assessment, satellite imagery was interpreted to generate or update the statistics of several countries for which little or inaccurate information on forest resources could be obtained. In 1990 the Forest Resources Assessment Project, remote sensing within a statistical sampling design and a consistent image interpretation procedure played a key role in estimating forest cover changes with a high degree of reliability and precision. The work carried out by the project could be seen as the development and implementation of a first round of continuous forest resources monitoring.
The clearing of forest land for agriculture is one of the major causes of deforestation in the tropics
|
Definitions Forests are defined as ecosystems with a minimum of 10 percent crown cover of trees and/or bamboos, generally associated with wild flora, fauna and natural soil conditions and not subject to agricultural practices. Deforestation refers to a change of land use with the depletion of tree crown cover to less than 10 percent. Changes within the forest class (from closed to open forest), which negatively affect the stand or site and, in particular, lower the production capacity, are termed degradation. Degradation is not reflected in the estimates. Plantations are defined as a class of forest that is established artificially, either on land that did not previously carry forest or involving the replacement of the previous forest cover by a new and essentially different species or mix of species. Ecological zones are derived from ecofloristic zone maps for South America, Africa and Asia, produced in the 1980s by FAO in cooperation with the Institute for the International Map of Vegetation, Toulouse, France. Both ecological parameters (climatic, physiographic and edaphic) and floristic parameters (dominant or characteristic forest species of indigenous flora) were used for the classification. For each continent, approximately 50 to 60 ecofloristic classes were delimited; these were aggregated into six broad tropical forest zones. |
Continuous forest inventory on a global, regional and national basis presupposes the existence of an institutional framework wherein assessments are made and the information flows from national to regional and regional to global levels on an ongoing basis. At the start of the 1990 assessment there was no institutional framework for tropical forest assessment that could harmonize national inventory efforts for global use. A mechanism was needed to coordinate and integrate global and national-level continuous monitoring of forest resource conditions. Such an infrastructure would be required to: strengthen international and national institutions and support networks; ensure technically sound and cost-effective methods for monitoring forest resources on a continuing basis; and reach agreement on standards for classifying global-level information about forest resource conditions and land uses.
TABLE 1. State of forest inventory in the tropics
|
Region |
Number of countries surveyed |
Number of countries with forest resources data at national level |
Forest harvesting and utilization |
||||||
|
Forest area information |
Forest conservation and management |
Forest plantations |
Volume and biomass |
||||||
|
No assessment |
One assessment |
More than assessment |
|||||||
|
Before 1980 |
1980-1990 |
||||||||
|
Africa |
40 |
3 |
17 |
18 |
2 |
7 |
5 |
2 |
4 |
|
Asia/Pacific |
17 |
0 |
1 |
5 |
11 |
9 |
8 |
8 |
7 |
|
Latin America/Caribbean |
33 |
0 |
11 |
16 |
6 |
12 |
4 |
4 |
4 |
|
Total |
90 |
3 |
29 |
39 |
19 |
28 |
17 |
14 |
15 |
Note: Evaluation from the Forest Resources Information System (FORTS).
TABLE 2. Estimates of forest cover area and deforestation by geographical subregions
|
Geographic regions and subregions |
Number of countries surveyed |
Total land area (million ha) |
Forest area |
Annually deforested area (million ha) |
Rate of change 1981-1990 (% per annum) |
|
|
1980 |
1990 |
|||||
|
(million ha) |
||||||
|
Africa |
40 |
2 236.1 |
568.6 |
527.6 |
4.1 |
- 0.7 |
|
West Sahelian Africa |
9 |
528.0 |
43.7 |
40.8 |
0.3 |
- 0.7 |
|
East Sahelian Africa |
6 |
489.7 |
71.4 |
65.3 |
0.6 |
- 0.8 |
|
West Africa |
8 |
203.8 |
61.5 |
55.6 |
0.6 |
- 0.8 |
|
Central Africa |
6 |
398.3 |
215.5 |
204.1 |
1.1 |
-0.5 |
|
Tropical southern Africa |
10 |
558.1 |
159.3 |
145.9 |
1.3 |
- 0.8 |
|
Insular Africa |
1 |
58.2 |
17.1 |
15.8 |
0.1 |
-0.8 |
|
Asia |
17 |
892.1 |
349.6 |
310.6 |
3.9 |
- 1.1 |
|
South Asia |
6 |
412.2 |
69.4 |
63.9 |
0.6 |
- 0.8 |
|
Continental Southeast Asia |
5 |
190.2 |
88.4 |
75.2 |
1.3 |
- 1.5 |
|
Insular Southeast Asia |
5 |
244.4 |
154.7 |
135.4 |
1.9 |
- 1.2 |
|
Pacific Islands |
1 |
45.3 |
37.1 |
36.0 |
0.1 |
- 0.3 |
|
Latin America |
33 |
1 650.1 |
992.2 |
918.1 |
7.4 |
- 0.7 |
|
Central America/Mexico |
7 |
239.6 |
79.2 |
68.1 |
1.1 |
- 1.4 |
|
Caribbean |
19 |
69.0 |
48.3 |
47.1 |
0.1 |
- 0.3 |
|
Tropical South America |
7 |
1 341.6 |
864.6 |
802.9 |
6.2 |
- 0.7 |
|
TOTAL TROPICS |
90 |
4 778.3 |
1 910.4 |
1 756.3 |
15.4 |
- 0.8 |
With this in mind, a system of country correspondents for tropical forest re source assessment was established. The governments of 60 tropical countries nominated national focal points for contact and information exchange. Regional and subregional centres where experienced inventory specialists are available were identified for the collection of existing data and remote sensing studies. These centres constitute a valuable resource for exchanging information and organizing training courses as well as other regional activities.
In cooperation with the coordinating centres, regional training workshops on tropical forest resource monitoring using remote sensing were implemented in Asia, Africa and Latin America. This was done using Technical Cooperation among Developing Countries (TCDC), thereby benefiting 27 countries and 55 participants.
Twinning arrangements were made with a number of universities and research institutions in developed countries to undertake cooperative research using the compiled database and results of remote sensing.
During the assessment period, close contacts were maintained with the scientific community concerned with global change issues, the International Union of Forestry Research Organization's working groups on forest inventory and biometrics.
The state of tropical forest inventories
From the data in FORIS, it is apparent that most of the tropical countries have very insufficient capacity to carry out and evaluate the results of forest inventories (see Table 1). There is a wide variation between countries with respect to completeness and quality of the information within the FORIS database; in Africa, for example, only single-date data and estimates are available for most countries and estimates of actual harvest and utilization are almost non-existent. No country has carried out a national forest inventory containing information that can be used for the reliable estimation of total woody biomass volume and change.
The current state of tropical forests
The forest cover area at end-1990 at a pan-tropical level (see Table 3) is estimated to be 1 756 million ha, or approximately 37 percent of the total land area. The largest extent of forest is in Latin America (918 million ha) followed by Africa (528 million ha) and Asia (311 million ha). About 1 544 million ha (88 percent) are in the lowlands while the remainder (204 million ha or 12 percent) are in the uplands (hill and montane zones). Among the lowland forest formations (see Table 3) the tropical rain forests constitute the biggest portion, 718 million ha (41 percent). The moist deciduous and the dry and very dry forests account for 587 million ha (33 percent) and 238 million ha (14 percent), respectively. The remainder, nearly 8 million ha, are scattered in the non-forest (desert and alpine) zones.
Deforestation between 1981 and 1990 at a pan-tropical level is estimated to have been 15.4 million ha annually: 7.4 million ha/year in Latin America, 3.9 million ha/year in Asia and 4.1 million ha/year in Africa. Expressed as a percentage of the baseline of 1980, the pan-tropical deforestation rate for the decade was 0.8 percent/year: 0.8 percent/year in Latin America, 0.7 percent/year in Africa and 1.1 percent/year in Asia.
Deforestation was 4.6 million ha/year in the tropical rain forest zone, 6.1 million ha/year in the moist forest zone, around 2.2 million ha/year in the dry and very dry zones and 2.5 million ha/year in the hill and montane zones. Therefore, the annual rate of change in the rain forest was -0.6 percent, -1.0 percent in the moist forest, -0.9 percent in the dry and very dry deciduous forests and -1.1 percent in the upland formations.
It is noteworthy that the estimated annual deforestation rate of 15.4 million ha is lower than the preliminary figure of 16.9 million ha/year presented at the 10th World Forestry Congress, held in Paris in September 1991. The current estimate is based on a significantly more complete and more recent database of country information (for many countries, particularly in the African region, data for the preliminary estimate had to be drawn from 1980 estimates).
Preliminary results of Phase 2 for Africa
By end-1992, about two-thirds of the 117 remote sensing samples had been interpreted (the remainder are expected to have been completed by the end of October 1993); therefore, conclusions at a global level cannot yet be drawn. The following discussion focuses on the African region to illustrate what can be expected when the remote sensing exercise has been completed.
As mentioned earlier, a key feature of the methodology is that it can be used to provide not only annual estimates but also change matrices for each sample location, as well as regional and global means. This permits the analysis of class-to-class changes of land-use and forest categories between the two dates of interpretation.
The mean values of the change matrix based on 31 samples in tropical Africa are presented in Table 4. As is to be expected from the analysis of such a large area, almost all possible class-to-class changes are present. However, most of the changes are located above the diagonal, meaning that most of the changes are concerned with loss of forest area or density, fragmentation, etc. From the table it is clear that thinking only in terms of deforestation is too simplistic; it is important to consider the process of change as a whole.
As an example, the fate of the closed forest area lost during the decade 1981 to 1990 is shown in Figure 3. Permanent conversion to non-forest uses accounted for some 16.1 percent of the total, while conversion to short-fallow agriculture made up 34 percent, an indication of spontaneous pressure of increasing populations, rather than planned land-use changes. A considerable part of the area loss is in the form of fragmentation (19 percent), where the progressive clearing of the original forest in small patches creates a mosaic of forest and non-forest areas. The fact that this fragmentation is an intermediate stage on the way to permanent agriculture could be inferred by observing the changes of the original "fragmented forest" class, from which most of the area change is to the "other land cover" class. A minor part (5.4 percent) is replaced by long-fallow agriculture ("traditional" shifting cultivation), which indicates that this practice is of little relevance in the region. One-quarter of the area change is to "open forest" which indicates degradation by loss of density of the forest canopy. This is probably the effect of grazing and related fire practices, selective logging, fuelwood exploitation, etc.
TABLE 3. Estimates of forest cover area and deforestation by main ecological zones
|
Forest formations |
Land area (million ha) |
Population density 1990 (inhabitants/km²) |
Population growth 1981-1990 (% per year) |
Forest area 1990 |
Annually deforested area 1981-1990 |
||
|
(million ha) |
(% of Iand area ) |
(million ha) |
(%) |
||||
|
Forest zone |
4 186.4 |
57 |
2.6 |
1 748.2 |
42 |
15.3 |
0.8 |
|
Lowland formations |
3 485.6 |
57 |
2.5 |
1 543.9 |
44 |
12.8 |
0.8 |
|
- Rain forest |
947.2 |
41 |
2.5 |
718.3 |
76 |
4.6 |
0.6 |
|
- Moist deciduous |
1 289.2 |
55 |
2.7 |
587.3 |
46 |
6.1 |
0.9 |
|
- Dry deciduous |
706.2 |
106 |
2.4 |
178.6 |
25 |
1.8 |
0.9 |
|
- Very dry zone |
543.0 |
24 |
3.2 |
59.7 |
11 |
0.3 |
0.5 |
|
Upland formations |
700.9 |
56 |
2.9 |
204.3 |
29 |
2.5 |
1.1 |
|
- Moist forests |
528.0 |
52 |
2.7 |
178.1 |
34 |
2.2 |
1.1 |
|
- Dry forests |
172.8 |
70 |
3.2 |
26.2 |
15 |
0.3 |
1.1 |
|
Non-forest zone (Hot and cold deserts) |
591.9 |
15 |
3.5 |
8.1 |
1 |
0.1 |
0.9 |
|
TOTAL TROPICS |
4 778.3 |
52 |
2.7 |
1 756.3 |
37 |
15.4 |
0.8 |
Note: Totals may not tally because of rounding.
TABLE 4. Forest cover change matrix for the tropical African region
|
Classes at year 1980 |
Area of classes at year 1990 |
Total at year 1980 |
|||||||||
|
Closed forest |
Open forest |
Forest + shifting |
Fragmented forest cultivation |
Shrub ('000 ha) |
Short fallow |
Other land cover |
Water |
Planted woody vegetation |
('000 ha) |
(%) |
|
|
Closed forest |
16 781 |
382.1 |
82.6 |
291.8 |
9.5 |
524.3 |
247.5 |
- |
- |
18 319.3 |
24 |
|
Open forest |
23.6 |
10 049 |
48.3 |
371.2 |
12.7 |
117.8 |
397.3 |
0.1 |
1.4 |
11 021.8 |
14 |
|
Forest + shifting cultivation |
7.7 |
14.6 |
556.8 |
1.6 |
4.4 |
51.7 |
28.5 |
- |
- |
665.40 |
0 |
|
Fragmented forest |
24.1 |
40.0 |
1.0 |
8 088.8 |
7.7 |
5.8 |
293.5 |
- |
- |
8 461.1 |
11 |
|
Shrubs |
0.8 |
10.8 |
- |
1.1 |
3 877.9 |
- |
164.3 |
0.1 |
- |
4 055.1 |
5 |
|
Short fallow |
7.6 |
10.9 |
9.6 |
2.1 |
- |
2 254.8 |
53.3 |
0.4 |
- |
2 338.6 |
3 |
|
Other land cover |
16.9 |
38.2 |
11.0 |
63.1 |
86.6 |
34.3 |
26 452 |
51.2 |
- |
26 752.8 |
35 |
|
Water |
0.5 |
- |
- |
0.5 |
0.1 |
3.2 |
81.5 |
2 960.1 |
- |
3 045.9 |
4 |
|
Plantations |
- |
- |
- |
- |
- |
0.4 |
0.4 |
- |
4.6 |
5.3 |
0 |
|
Total 1990 |
16 863 |
10 546 |
709.2 |
8 820.2 |
3 999.0 |
2 992.4 |
27 718 |
3 011.9 |
6.0 |
74 665.2 |
100 |
|
Percentage of total land area |
22.6 |
14.1 |
0.9 |
11.8 |
5.4 |
4.0 |
37.1 |
4.0 |
0.0 |
|
|
Figure 3. Changes in closed forest cover in Africa, 1981-1990
Figure 4. Land class changes in Africa - a preliminary analysis of 31 samples
The overall gain or loss of area by each cover type is presented in Figure 4. The general trend is clearly visible: the loss of closed forest area and the increase in cultivated areas.
Survey of forest plantations
Afforestation and reforestation have a major role to play in the overall strategy to control tropical deforestation. It is therefore essential to know the present state of forest plantation resources and their rate of establishment as well as the weaknesses in realizing their full potential in sustainable development. Consequently, the 1990 assessment examined forest plantations, as did its predecessor. The basic source of data was a systematic review of national progress reports, with an applied adjustment factor of 70 percent (standard deviation of 4 percent) to compensate for the widespread difference between reported and actual plantings. (This factor was determined by a field-level comparison of reported planting and actual establishment/survival of 56 plantation efforts (Panday, 1992)).
Based on the results of the survey and application of the correction factor, the estimated area of forest plantations in the tropics by end-1990 was 30.7 million ha (43.9 million ha reported: 8.6 million ha in Latin America, 32.3 million ha in Asia and 3 million ha in Africa). From 1981 to 1990, the reported forest plantation area increased annually by an average of 2.6 million ha; therefore, the FAO assessment estimates a real increase of about 1.8 million ha per year.
Barring a few exceptions, most of the plantations suffer from a lack of integrated planning. As a result, the actual yield obtained from plantations is generally very low, often less than 50 percent of initial estimates. There is a poor harmonization of species selection and site conditions and a poor match between what is required and what is produced. This is particularly unfortunate as the experiences of well-managed plantations demonstrate that they offer valuable opportunities for socio-economic development. For example, United Afforestation Industrial of the Congo (UAIC) is currently exporting 400 000 m³ of paper pulpwood to Europe per year from its 25 000 ha of highly productive clonal eucalyptus plantations. Bangladesh homestead plantations contribute more than 50 percent of total wood production.
|
Major objectives and elements of a continuous forest resources monitoring programme · Collecting and analysing forest resources data available at the national level and reporting to the world community on a regular and comparable basis. · Country capacity-building to conduct surveys and studies for the effective planning and control of national forest resource developments on a continuing basis. · Expanding the scope of national forest inventories and planning for the inclusion of parameters relevant to environmental change such as biomass, biodiversity and land degradation. · Assessing the state and change of forest resources using remote sensing and sampling on a global, regional and subregional basis and in cooperation with the member countries concerned. |
There is an urgent need to create national-level plantation data banks to bridge the existing knowledge gap about growth and yield and site-species relationships. Such information centres would not only help the country concerned but also other countries whose forestry research institutions are weak or who have less experience in plantation forestry. There is a great hope that, by organizing the existing knowledge and sharing it, there will be a major advancement in plantation forestry.
The results presented above have a number of implications for the future. Assessment and periodical evaluations of forest resources are essential components of long-term forest and natural resource planning at both national and wider levels. They are used for evaluating the effects of current policies and practices, quantitatively and qualitatively, and for rectifying inadequacies. The use of such mechanisms to achieve this, however, is evidently one of the most neglected aspects of forest resource management, conservation and development. In many cases, even the basic information related to the area and type of forests, their existing potential and volume of harvest, for example, is lacking.
The concepts and techniques developed by the 1990 Forest Resources Assessment Project provide the conceptual framework of criteria, norms and definitions for regular assessment, while also setting out the institutional mechanisms through networking with country correspondents and lead centres to promote the exchange of technology and information. This will assist developing countries in compiling, analysing and exchanging forest resources data and in following their evolution in the course of time.
Of particular importance is the need to organize national and global assessments into a form of continuous forest inventory and monitoring. Only such a technique can provide reliable data for studies and investigations regarding land-use changes (e.g. deforestation) and related processes (e.g. degradation, amelioration) as well as the effect of these processes on trees and forests and the influence of forests on carbon storage and climate change, etc.
It is important to understand that repeated but isolated periodic assessments cannot adequately serve this purpose. The state of country information in 1990 was better than in 1980 and, in all likelihood, the situation in another five or ten years' time will be further improved. The coverage, timeliness, reliability and comparability of country data are expected to improve significantly over time. This improvement, based on changing, albeit improved, techniques, makes a direct comparison of the aggregated results of successive global estimates misleading.
A more effective way to use the primary data, i.e. the key resource, is to re-evaluate it continually in the context of an ongoing forest resources monitoring programme. Given the current critical state of tropical forest resources as well as the depth of concern for the socio-economic and environmental consequences of deforestation and forest degradation, immediate and sustained efforts to develop and institutionalize such a continuous forest resources monitoring programme should be a top priority.
Panday, D. 1992. Assessment of tropical forest plantation resources. Uppsala, Sweden, Swedish University of Agricultural Sciences.
![]()
![]()
![]()