![]()
![]()
![]()
A. V. Korotkov and T.J. Peck
Alexandre V. Korotkov and Tim J. Peck are, respectively, Economic Affairs Officer and former Director of the United Nations' Joint ECE/FAO Agriculture and Timber Division, Geneva.
Today, forest inventories are expected to provide an increasingly wide range of information about forest resources for people in many different disciplines, including legislators, policy-makers, the media, special interest groups (especially those concerned with the environment) and the general public. These new demands are being placed on national and regional as well as global inventories. This article summarizes the results of the latest assessment of the forest resources in the industrialized countries, undertaken in 1990 by the Joint Economic Commission for Europe (ECE) and FAO Agriculture and Timber Division (for main data summaries, see Tables 3a, 3b and 4).
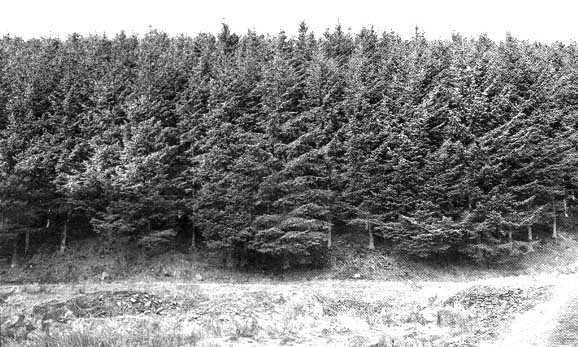
A plot of plantation spruce in Scotland prior to commercial thinning
The 1990 assessment of the industrialized countries' forest resources was implemented by means of a detailed enquiry (as were previous versions). The inquiry, including terms, definitions and a questionnaire covering the most important forestry inventory information, was circulated to all countries in Europe, the former USSR, Canada, the United States, Japan, Australia and New Zealand in the spring of 1990. Work on the assessment was coordinated by the ECE/FAO Agriculture and Timber Division in Geneva, supported by the Forestry Department of FAO in Rome. The main report, The forest resources of the temperate zones: the UN-ECE/FAO 1990 forest resource assessment, is published in two volumes (ECE/FAO, 1992; ECE/FAO, in press).
Compared with previous assessments, which date back to 1947, the new study contains more data of generally better quality and covering a wider range of aspects of the resource. It soon became clear, however, even before the report of the assessment was published, that the information it contained would still not fully satisfy present-day needs. By the time this issue of Unasylva appears, an ECE/FAO meeting of experts will have been held (during May 1993 in Kotka, Finland) to discuss information needs for the next global assessment, the extent to which countries may be able to develop their inventory systems to collect such data and the international agencies concerned to provide the structure for collating and analysing them.
|
Definitions · Forests are defined as land with a tree crown cover (stand density) of more than about 20 percent of the area. This includes both closed forest formations, where trees of various storeys and undergrowth cover a high proportion of the ground, and open forest formations with a continuous grass layer in which tree synusia cover at least 10 percent of the ground. · Other wooded land has some forestry characteristics but is not forest as defined above. It includes open woodland and scrub, shrub and brushland, whether or not it is used for pasture or range. It excludes land occupied by trees outside the forest (e.g. trees as permanent boundaries on arable land, land under permanent tree crops such as orchards and trees in urban areas). |
Forest area
For the industrialized countries in aggregate, the combined area of forest and other wooded land (see Box, Definitions) is 2.06 billion ha or 39 percent of the land area. However, the share of forest and other wooded land in total land varies widely at the country level, ranging from 68 percent in Japan and 77 percent in Finland down to 20 percent in Belgium and less than 10 percent in the United Kingdom.
The largest concentration of forests and other wooded land is in the countries constituting the former USSR (942 million ha), followed by North America (749 million ha), Europe (195 million ha) and other industrialized regions (178 million ha).
Based on an estimated population of 1.27 billion in the industrialized countries, there is on average about 1.6 ha of forest and other wooded land per caput in the industrialized regions. Here again, country variations are enormous. Canada, for example, has over 17 ha per caput while the former USSR and Sweden have 3.3 ha per caput. At the other end of the scale, Germany, Italy and Japan have 0.2 ha or less of forest land and other wooded land per caput and the Netherlands and the United Kingdom only 0.02 and 0.04 ha, respectively.
The number of forest reserves and protected areas in Europe seems destined to continue increasing
|
Ownership structure Ownership structure of forests and other wooded land varies from country to country according to historical, social, political and other factors. For Europe as a whole, half the area of forest and other wooded land at present is privately owned and the other half publicly owned. Among the market economy countries, Portugal, Norway and Austria have the highest shares in private ownership (91, 83 and 82 percent, respectively), while Turkey and Greece have the lowest (1 and 17 percent, respectively). Perhaps, in the coming years the ownership pattern in the countries of central and eastern Europe that are moving towards a market-oriented economy will change from virtually 100 percent state ownership (as is also the case in the former USSR) towards a more mixed pattern, comparable to Western Europe, but it is too early to predict how far this shift will go. In North America there is a marked contrast between Canada where 94 percent of forests are publicly owned, mainly by the provinces, and the United States where 72 percent are private, with the forest industries owning large areas. In Australia, between 70 and 75 percent of forest lands (not including other wooded lands) are publicly owned. |
TABLE 1. Estimated subdivision of forest into exploitable and unexploitable areas in temperate regions
|
Region |
Exploitable forest |
Unexploitable forest |
|
|
(million ha) |
(% of total) |
(million ha) |
|
|
Europe |
133.0 |
89.1 |
16.3 |
|
Former USSR |
414.0 |
54.8 |
340.9 |
|
Canada |
112.1 |
45.3 |
135.1 |
|
United States |
195.6 |
93.3 |
14.0 |
|
Australia |
17.0 |
42.7 |
22.8 |
The assessment distinguishes between exploitable and unexploitable portions. Table 1 compares exploitable forest land with total forest area. Although part of the areas of other wooded land in the industrialized countries are also classified as exploitable, they are a relatively small portion of the total and there are some problems of definition. Therefore, they are excluded from Table 1. Exploitable forest is defined as forest where there are no legal, technical or economic restrictions on wood production. The term "exploitable" is intended to convey the idea of forest (or other wooded land) that is either in use as a source of wood or which is available and accessible, even if not yet being so used. Unexploitable forest is defined as areas where there are restrictions on wood production either for reasons of protection, as in national parks and nature reserves, or because physical productivity is too low or production costs too high to warrant regular wood harvesting.
Standing volume and growing stock
The difference between standing volume and growing stock is the volume of dead trees. Not all countries were able to provide comprehensive data covering either dead trees or all categories of forest and tree resources. Therefore, the estimate of 170 billion m³ over bark (o.b.) for the total standing volume of forest and tree resources in industrialized countries is approximate and almost certainly errs on the low side.
On the other hand, figures relating to exploitable forest are much more reliable. For instance, the total volume of growing stock on exploitable forests in the industrialized countries is estimated to be 112 billion m³ o.b.
Averages of growing stock per hectare of exploitable forest at the subregional level reveal the wide differences that one would expect to result from variations in growing conditions, management regimes and age class distribution. For example, in the countries of central-eastern Europe it is 204 m³ o.b./ha, in the former USSR (excluding Belarus and the Ukraine) 121 m³ o.b./ha and, on the Iberian peninsular only 70 m³ o.b./ha.
Species distribution
Species distribution can be shown better by the growing stock data than by area, because of the difficulties of finding common definitions of "coniferous forests" and "broad-leaved forests" based on area. Of the total growing stock of 112 billion m³ o.b. in exploitable forest of the industrialized countries, 75.5 billion m³ o.b. or almost two-thirds are coniferous. Largely as a result of the growing conditions, but to some extent influenced by management and use, the share of species varies appreciably from region to region. Coniferous species predominate in the Nordic countries, Canada and the former USSR. Only in southeastern Europe and Oceania do broad-leaved species predominate in the growing stock. However, there are a number of individual countries within predominantly coniferous regions where broad-leaved species form the larger portion; for example, in France 62 percent of the growing stock on exploitable forest is broadleaf.
Annual increment
A distinction is made in the assessment between gross annual increment and net annual increment (NAI), the difference being natural losses. The NAI figure is of particular value because it provides an indication of the productivity of the forest and also allows a direct comparison with the wood "drain" on the forest. Similar to statistics on growing stock, the most reliable figures for increment are generally those relating to exploitable forests; however, data could not be obtained for all countries.
The total NAI on exploitable forest in Europe amounted to 577 million m³ o.b. and, in the former USSR, to 700 million m³ o.b. For the United States and Canada these data are estimated by the joint ECE/FAO division to be at around 640 million m³ end 210 million m³, respectively. On a per hectare basis, the average NAI for Europe as a whole is 4.3 m³ o.b. while estimates for the former USSR are 1.7 m³ o.b., for the United States 3.9 m³ o.b. and for Canada 1.9 m³ o.b.
Figure 1. Estimated total fallings in industrialized regions around 1990
Figure 2. Net annual increment and fellings in exploitable forest, by subregions
Fellings and removals
A distinction is made between fellings and removals, the difference being the volume of felled timber that is not extracted from the forest. Total fellings in the industrialized countries around 1990 are estimated to have been 1.86 billion m³ o.b. (Fig. 1 gives a regional breakdown). The statistics on fellings (o.b.) are important because their comparison with the NAI figures gives an indication of the forest balance, i.e. whether growing stock volume is rising or falling.
As can be seen in Figure 2, the volume of fellings in exploitable forest in Europe in 1990 was significantly less than the NAI. Therefore, there was a net expansion of the growing stock. Unfortunately, a lack of data prevents a similar comparison for North America.
Interest in the way and extent to which the forest resources of the industrialized countries have been changing has increased considerably in recent years, partly as a reaction to the evidence of serious declines in the area of tropical forests. The questionnaire for the 1990 assessment was modified and simplified with respect to the 1980 version in the aim of improving the possibility of analysing changes in forest resources over time. However, this aim has only been partly fulfilled: the information received is still not comprehensive; it has not been possible to retain exactly the same classifications and definitions used in the previous surveys, while the quality, coverage, accuracy and comprehensiveness of the data have been variable over time.
Changes in forest area
One parameter for which quite a number of countries found difficulty in providing reliable information was changes over time in the area of forest and other wooded land. No exact figures can be presented for the industrialized countries as a whole; however, it seems that there was a slight increase in total forest area between 1980 and 1990. In the case of Europe, it can be categorically stated that the area of forest increased between 1980 and 1990, a continuation of the trend since 1950. A tentative balance of changes over the decade (making assumptions about developments in countries that supplied incomplete or no data) is presented in Figure 3.
Figure 3. Estimated changes in the area of Europe's forest and other wooded land between 1980 and 1990
In the industrialized countries, surplus agricultural land is being allowed to return to forest
While the total area of forest and other wooded land in Europe increased by an estimated 2 million ha between 1980 and 1990, it appears that the area of exploitable forest did not change significantly. It also appears that increases through afforestation or natural extension and conversion from other categories of forest and other wooded land have been offset by withdrawals into the unexploitable category - for instance, through designation as national parks, nature reserves or other protected areas or conversion to other land uses.
The former USSR officially reported a net gain of 22.6 million ha of forest and other wooded land between 1980 and 1990. Other non-official but generally reliable sources have estimated a much smaller increase of 10.6 million ha between 1978 and 1988, comprising an increase in forest area of 21.7 million ha, partly offset by a decrease of 11.1 million ha in other wooded land. Today, in view of the global importance of the Russian Federation's forests, there is an urgent need to obtain clarification of these figures.
No data on change over time were received from Canada and, for the same reason, it will be important to discover the trends in its forest resources. The United States and Japan were the only temperate zone countries to report reductions in the area of forest and other wooded land. In Japan there was a small net loss of 48 000 ha between 1980 and 1990; in the United States the net loss amounted to nearly 3.2 million ha between 1977 and 1987.
TABLE 2. Summary of replies to the inquiry on the importance of forest functions, by area
|
Region/function |
Level of importance |
||
|
High |
Medium |
Low |
|
|
(Percentage of total area)1 |
|||
|
Europe² |
|||
|
Wood production |
54 |
24 |
22 |
|
Protection |
11 |
17 |
72 |
|
Water |
9 |
17 |
74 |
|
Grazing (range) |
10 |
15 |
75 |
|
Hunting |
27 |
55 |
18 |
|
Nature conservation |
4 |
37 |
59 |
|
Recreation |
12 |
39 |
49 |
|
Former USSR |
|||
|
Wood production |
0 |
18 |
82 |
|
Protection |
9 |
15 |
76 |
|
Water |
7 |
17 |
76 |
|
Nature conservation |
0 |
19 |
81 |
|
Recreation |
2 |
11 |
87 |
|
United States |
|||
|
Wood production |
36 |
41 |
23 |
|
Protection |
36 |
30 |
34 |
|
Water |
16 |
79 |
5 |
|
Grazing (range) |
16 |
17 |
67 |
|
Hunting |
9 |
45 |
46 |
|
Nature conservation |
8 |
42 |
50 |
|
Recreation |
19 |
33 |
48 |
1 Public and private forest combined.
² Aggregate of replies received from 26 countries accounting for between 83 percent (for grazing) and 98 percent (for wood production, protection and hunting) of Europe's forest area covered by the enquiry.
Changes in growing stock, volume and fellings
Fellings in the industrialized countries have been expanding over the past four decades, with growth in industrial wood more than offsetting the declining trend - at least up to the mid-1970s - in fuelwood. After the first oil shock, fuelwood fellings started to recover before levelling off again during the 1980s, but they still account for only a minor share of the total in the industrialized countries. Despite the fact that fellings have been rising in those countries, the volumes involved in almost all of them were less than those of the NAI, which have also been expanding over the long term. As a result, therefore, one of the principal findings of the 1990 assessment is that, in terms of growing stock volume, there has been continuing expansion of the forest resource in the industrialized countries. This finding has considerable implications for forest policy in the long term.
It is noteworthy that changes related to forest damage and forest decline and various threats to the ecosystems of the temperate and boreal forests have not been explicitly dealt with in the 1990 assessment. These aspects, which have more potential impact on standing volume and quality than on area, are monitored in other ECE/FAO efforts, such as the annual surveys of forest decline and forest fires.
It was mentioned earlier that the widening circle of users of forest resource information is interested not only in the physical description of the resource but more and more in the role that it plays, or is capable of playing, in providing a range of functions. The 1980 ECE/FAO assessment of the forest resources of the ECE region was a first attempt at the international level to collect and publish information on the role of the forest in supplying environmental and other non-wood goods and services. This experiment, despite its shortcomings, was considered successful enough to be repeated in the 1990 assessment, although some changes in the approach were introduced.
In the 1990 assessment, countries were asked to divide the area of forest and other wooded land according to the level of importance (high, medium, low) they accorded to each of the following functions: wood production; protection; water; grazing (range); hunting (and trapping); nature conservation; and recreation.
Most of the industrialized countries were able to give estimates for each of the seven functions for public and private forests, but relatively few for other wooded land. Not at all surprisingly, there was considerable variation between countries in the levels of importance attached to the different functions, which to some extent could be seen to be related to such factors as the extent of forest cover, topography, climate, population density and standards of living. Care should therefore be taken in interpreting aggregated data (see Table 2). Notwithstanding the cautionary statement made above, the assessment clearly demonstrates that wood production remains the single most important function in practically all the industrialized countries.
TABLE 3a. Summary of the main statistics on forest resources in the industrialized countries: forest and wooded land
|
Counties |
Years covered |
Forest |
Other wooded land |
Net change in forest and other wooded land 1980-1990 |
|
('000 ha) |
||||
|
Albania |
1990 |
1 449 |
1 046 |
1 |
|
Austria |
1986-1990 |
3 877 |
3 877 |
142 |
|
Belgium |
1980 |
620 |
620 |
19 |
|
Bulgaria |
1990 |
3 683 |
3 386 |
78 |
|
Cyprus |
1990 |
280 |
140 |
21 |
|
Former Czechoslovakia |
1988 |
4 491 |
4 491 |
20 |
|
Denmark |
1979 |
466 |
466 |
10 |
|
Finland |
1980-1989 |
23 373 |
20 112 |
55 |
|
France |
1976-1988 |
14 155 |
13 110 |
30 |
|
Germany |
1987-1989 |
10 7351 |
10 4901 |
- |
|
of which: |
|
|
|
|
|
- former Dem. Rep. |
1988-1989 |
2 981 |
2 938 |
33 |
|
- former Fed. Rep. |
1987-1989 |
7 754 |
7 552 |
436 |
|
Greece |
1964-1987 |
6 032 |
2 512 |
9 |
|
Hungary |
1990 |
1 675 |
1 675 |
82 |
|
Iceland |
1970-1985 |
13 4 |
11 |
- |
|
Ireland |
1989 |
429 |
396 |
48 |
|
Israel |
1989-1990 |
- |
102 |
- |
|
Italy |
1988 |
8 550 |
6 750 |
- |
|
Luxembourg |
1989 |
87 |
85 |
1 |
|
Netherlands |
1982-1985 |
334 |
334 |
10 |
|
Norway |
1980-1986 |
9 565 |
8 697 |
0 |
|
Poland |
1989 |
8 672 |
8 672 |
50 |
|
Portugal |
1980-1986 |
3 102 |
2 755 |
138 |
|
Romania |
1990 |
6 265 |
6 190 |
2 |
|
Spain |
1990 |
25 622 |
8 388 |
9 |
|
Sweden |
1985-1989 |
28 015 |
24 437 |
0 |
|
Switzerland |
1983-1985 |
1 186 |
1 130 |
66 |
|
Turkey |
1990 |
20 199 |
8 856 |
31 |
|
United Kingdom |
1988-1989 |
2 380 |
2 207 |
242 |
|
Former Yugoslavia, SFR |
1987-1988 |
9 453² |
8 370 |
345 |
|
Total Europe |
|
194 953 |
149 305 |
1 909 |
|
Former USSR |
1988 |
941 530 |
754 958 |
22 600 |
|
of which: |
|
|
|
|
|
- Belarus |
1988 |
6 256 |
6 016 |
273 |
|
- Ukraine |
1988 |
9 239 |
9 213 |
240 |
|
Canada |
1986 |
453 300 |
247 164 |
- |
|
United States |
1987 |
295 9891 |
209 573 |
-3 165 |
|
Total North America |
|
749 289 |
456 737 |
- |
|
Japan |
1985 |
24 718 |
24 158 |
-48 |
|
Australia |
1990 |
145 613³ |
39 837 |
6 |
|
New Zealand |
1987-1989 |
7 472 |
7 472 |
- |
|
of which: |
|
|
|
|
|
- plantations |
1989 |
1 244 |
1 244 |
- |
|
- natural forest |
1987 |
6 228 |
6 228 |
- |
|
Total other |
|
177 8031 |
71 467 |
-42 |
|
GRAND TOTAL |
|
2 063 5751 |
1 432 467 |
- |
1 UN-ECE/FAO secretariat estimates.
² No survey of other wooded land and trees outside the forest.
³ Pastures.
The assessment also included a question on the past and future changes in emphasis in countries' policies towards the functions of the forest, both over the preceding decade and during the 1990s. The replies suggest that, in the industrialized countries, increasing policy emphasis is being placed on protection, water, nature conservation and recreation.
Forest products other than wood
Information on non-wood forest products revealed the large number of such products being collected, some of them on a commercial scale. Among food products most frequently mentioned in the replies were berries and nuts of different kinds, mushrooms, game meat and honey. Of the non-food products, the main ones reported were Christmas trees, aromatic and medicinal herbs, foliage (greenery for decoration), resin and fodder. There are a few products of major commercial importance locally, an obvious example being cork and its importance for Portugal.
Some countries have made good progress in quantifying the production and harvest of some non-wood products and even in putting a value on them; to the extent that it could be provided, this information is being published in Volume II of the assessment (ECE/FAO, in press). We are still far, however, from being able to apply methodologies for the different functions or products of the forest which would give results that allow their relative importance to be assessed, whether in monetary terms or some other unit. This remains a major challenge for researchers.
TABLE 3b. Summary of the main statistics on forest resources in the industrialized countries: exploitable forest
|
Country |
Exploitable forest |
||||
|
Area |
Growing stock |
Net annual increment |
Feelings |
||
|
('000 ha) |
Total |
Conifer |
|||
|
(million m³ over bark) |
('000 m³ over bark) |
||||
|
Albania |
910 |
73 |
15 |
1 001 |
1 629 |
|
Austria |
3 330 |
953 |
788 |
21 980 |
17 272 |
|
Belgium |
620 |
90 |
54 |
4 457 |
3 326 |
|
Bulgaria |
3 222 |
405 |
- |
- |
4 755 |
|
Cyprus |
88 |
3 |
3 |
45 |
577 |
|
Former Czechoslovakia |
4 491 |
991 |
725 |
31 023 |
20 152 |
|
Denmark |
466 |
54 |
29 |
3 515 |
2 285 |
|
Finland |
19 511 |
1 679 |
1 378 |
69 664 |
55 857 |
|
France |
12 460 |
1 742 |
663 |
65 855 |
48 000 |
|
Germany of which: |
9 852 |
2 674² |
- |
- |
- |
|
- former Dem. Rep. |
2 476 |
476 |
340 |
16 5461 |
10 833 |
|
- former Fed. Rep. |
7 376 |
2 198 |
14 76 |
- |
31 819 |
|
Greece |
2 289 |
149 |
77 |
3 317 |
3 376 |
|
Hungary |
1 324 |
229 |
35 |
8 231 |
6 057 |
|
Iceland |
- |
- |
- |
- |
- |
|
Ireland |
394 |
30 |
26 |
- |
1 568 |
|
Israel |
80 |
4 |
2 |
239 |
69 |
|
Italy |
4 387 |
743 |
271 |
- |
7 960 |
|
Luxembourg |
82 |
20 |
- |
- |
360 |
|
Netherlands |
331 |
52 |
29 |
2 394 |
1 300 |
|
Norway |
6 638 |
571 |
468 |
17 633 |
11 814 |
|
Poland |
8 460 |
1 380 |
1 074 |
30 464 |
27 318 |
|
Portugal |
2 346 |
167 |
110 |
11 286 |
10 879 |
|
Romania |
5 413 |
1 202 |
482 |
31 594 |
15 950 |
|
Spain |
6 506 |
450 |
276 |
27 750 |
15 014 |
|
Sweden |
22 048 |
2 471 |
2 104 |
91 005 |
57 543 |
|
Switzerland |
1 093 |
360 |
264 |
5 8201 |
5 300 |
|
Turkey |
6 642 |
759 |
549 |
- |
17 152 |
|
United Kingdom |
2 207 |
203 |
111 |
11 088 |
8 133 |
|
Former Yugoslavia |
7 768 |
1 056 |
308 |
27 654 |
21 957 |
|
Total Europe |
132 958³ |
185 09² |
11 819² |
576 700² |
408 300² |
|
Former USSR of which: |
414 015 |
50 310 |
37 061 |
699 852 |
517 609 |
|
- Belarus |
5 392 |
720 |
506 |
12 958 |
11 618 |
|
- Ukraine |
5 820 |
895 |
509 |
20 800 |
14 560 |
|
Canada |
112 077 |
14 855² |
11 134 |
- |
151 720 |
|
United States |
195 596 |
23 092 |
13 128 |
- |
619 587 |
|
Total North America |
307 673 |
37 947 |
24 262 |
- |
771 307 |
|
Japan |
23 829² |
2 861 |
1 785² |
- |
- |
|
Australia |
17 005 |
1 796 |
267² |
358 401 |
19 959 |
|
New Zealand of which |
2 060² |
351² |
319² |
- |
14 288² |
|
- plantations |
1 240 |
250 |
247 |
26 676 |
13 9061 |
|
- natural forest |
820 |
101 |
72 |
- |
3821 |
|
Total other |
42 894 |
5 008 |
2 371 |
- |
- |
|
GRAND TOTAL |
897 540³ |
111 774² |
75 513² |
- |
- |
1 Estimates by national correspondents.
² UN-ECE/FAO secretariat estimates.
³ Data on "exploitable high forest and coppice".
National parks and nature reserves
All told, there are about 2.7 million ha of forest and other wooded land in national parks and nature reserves in the reporting European countries and 10.6 million ha in the former USSR. The United States reported 339 national parks, the area of which was not provided, and Australia 514, with an area of 18.6 million ha. Australia also reported 2 712 nature reserves with an area of 2.4 million ha. These areas should expand in the future (see Box, Protected areas).
Perceived conflicts between forest functions
Another question put to countries concerned areas of public concern and conflicts between forest functions, the aim being to gain a picture of the nature and range of the problems and conflicts arising in utilization of the resource. It emerges clearly that a change in public attitudes towards the forest as well as in public demands on it has taken place over the past two decades or so. The environmental and other non-wood goods and services of the forest are seen by society in the industrialized countries (the general public, opinion-makers and policy-makers) as being of ever-increasing importance.
TABLE 4. Comparative data on forest resources in the industrialized countries
|
Countries |
Share of forest and other wooded land in land area |
Forest and other wooded land per caput |
Share of forest and other wooded land in private ownership |
Exploitable forest |
Growing stock per ha on exploitable forest |
Growing stock on exploitable forest per caput |
Share of coniferous species in growing stock on exploitable forest |
Net annual increment per ha on exploitable forest |
Ratio of felling to net annual increment on exploitable forest |
|
|
Share of total forest and other wooded land |
Per caput |
|||||||||
|
% |
(ha/caput) |
% |
% |
(ha/caput) |
(m³ over bark/ha) |
(m³ over bark/caput) |
% |
(m³ over bark/ha) |
(ratio) |
|
|
Albania |
52.2 |
0.45 |
0 |
62 |
0.28 |
80 |
22.5 |
21 |
1.1 |
1.62 |
|
Austria |
47.0 |
0.50 |
82 |
86 |
0.43 |
286 |
123.6 |
83 |
6.6 |
0.76 |
|
Belgium |
20.5 |
0.06 |
56 |
100 |
0.06 |
145 |
9.1 |
60 |
7.2 |
0.75 |
|
Bulgaria |
33.4 |
0.41 |
- |
87 |
0.36 |
1261 |
45.0 |
- |
3.3 |
0.45 |
|
Cyprus |
30.6 |
0.40 |
42 |
31 |
0.13 |
35² |
4.3 |
100 |
0.5 |
- |
|
Former Czechoslovakia |
35.8 |
0.29 |
11³ |
100 |
0.29 |
2214 |
63.3 |
73 |
6.9 |
0.65 |
|
Denmark |
11.0 |
0.09 |
73 |
100 |
0.09 |
116 |
10.5 |
54 |
7.5 |
0.65 |
|
Finland |
76.7 |
4.68 |
70 |
83 |
3.91 |
86 |
336.5 |
82 |
3.6 |
0.80 |
|
France |
26.1 |
0.25 |
74 |
88 |
0.22 |
140 |
30.9 |
38 |
5.3 |
0.73 |
|
Germany of which: |
30.7² |
0.13 |
- |
92² |
0.12² |
- |
33.5 |
- |
- |
- |
|
- former Dem. Rep. |
28.3 |
0.18 |
31 |
83 |
0.15 |
192 |
28.6 |
71 |
6.7 |
0.65 |
|
- former Fed. Rep. |
31.8 |
0.12 |
46 |
95 |
0.12 |
298 |
34.8 |
67 |
- |
- |
|
Greece |
46.7 |
0.60 |
17 |
38 |
0.23 |
65 |
14.8 |
52 |
1.5 |
1.02 |
|
Hungary |
18.2 |
0.16 |
1 |
79 |
0.13 |
173 |
21.7 |
15 |
6.2 |
0.74 |
|
Iceland |
1.5 |
0.54 |
- |
- |
- |
- |
- |
- |
- |
- |
|
Ireland |
6.2 |
0.12 |
22 |
92 |
0.11 |
76 |
8.6 |
87 |
8.4 |
0.48 |
|
Israel |
6.1 |
0.03 |
3 |
65 |
0.02 |
45 |
0.9 |
50 |
3.0 |
0.29 |
|
Italy |
28.4 |
0.15 |
60 |
51 |
0.08 |
169 |
12.9 |
37 |
4.1 |
0.48 |
|
Luxembourg |
33.9 |
0.24 |
55 |
94 |
0.22 |
245 |
54.1 |
- |
8.1 |
0.54 |
|
Netherlands |
9.8 |
0.02 |
52 |
99 |
0.02 |
157 |
3.5 |
56 |
7.2 |
0.54 |
|
Norway |
31.2 |
2.26 |
83 |
69 |
1.57 |
86 |
134.7 |
82 |
2.7 |
0.67 |
|
Poland |
28.5 |
0.23 |
17 |
98 |
0.22 |
163 |
36.1 |
79 |
3.6 |
0.87 |
|
Portugal |
35.8 |
0.29 |
91 |
76 |
0.22 |
71 |
15.9 |
66 |
4.8 |
0.96 |
|
Romania |
27.3 |
0.27 |
0 |
86 |
0.23 |
222 |
51.8 |
40 |
5.8 |
0.53 |
|
Spain |
51.3 |
0.66 |
70 |
25 |
0.17 |
69 |
11.6 |
61 |
4.3 |
0.54 |
|
Sweden |
68.6 |
3.27 |
70 |
79 |
2.58 |
112 |
288.7 |
85 |
4.1 |
0.63 |
|
Switzerland |
29.8 |
0.18 |
32 |
92 |
0.16 |
329 |
53.7 |
73 |
5.3 |
0.91 |
|
Turkey |
26.2 |
0.34 |
1 |
33 |
0.11 |
114 |
12.9 |
72 |
3.1 |
0.82 |
|
United Kingdom |
9.9 |
0.04 |
60 |
93 |
0.04 |
92 |
3.5 |
55 |
5.0 |
0.73 |
|
Former Yugoslavia, SFR |
37.0 |
0.40 |
- |
82 |
0.33 |
136 |
44.4 |
29 |
3.6 |
0.79 |
|
Total Europe |
35.4 |
0.35 |
50² |
68 |
0.24 |
139 |
32.8 |
64 |
4.3 |
0.71 |
|
Former USSR of which: |
44.0 |
3.26 |
0 |
44 |
1.43 |
122 |
174.3 |
74 |
1.7 |
0.74 |
|
- Belarus |
30.2 |
0.61 |
0 |
86 |
0.53 |
134 |
70.6 |
70 |
2.4 |
0.90 |
|
- Ukraine |
15.9 |
0.18 |
0 |
63 |
0.11 |
154 |
17.3 |
57 |
3.6 |
0.70 |
|
Canada |
49.2 |
17.09 |
6 |
25 |
4.23 |
133 |
560.1 |
75 |
1.9 |
0.73 |
|
United States |
32.4 |
1.18 |
72 |
66 |
0.78 |
118 |
92.4 |
57 |
3.9 |
0.81 |
|
Total North America |
40.8 |
2.71 |
- |
41 |
1.11 |
123 |
137.2 |
64 |
3.2 |
0.79 |
|
Japan |
67.8 |
0.20 |
57³ |
96.4² |
- |
1205 |
23.2 |
- |
- |
- |
|
Australia |
- |
- |
8³ |
12 |
1.00 |
106² |
105.1 |
15 |
2.1 |
0.57 |
|
New Zealand of which: |
27.9 |
2.23² |
26³ |
28² |
0.61 |
170² |
104.8 |
91 |
- |
- |
|
- plantations |
4.6 |
0.37 |
48³ |
99.7 |
0.37 |
202 |
74.6 |
99 |
21.5 |
0.52 |
|
- natural forest |
23.3 |
1.86 |
21³ |
13 |
0.24 |
123 |
30.2 |
71 |
- |
- |
|
Total other |
21.7 |
- |
- |
- |
- |
117 |
34.8 |
- |
- |
0.54 |
|
GRAND TOTAL |
38.6 |
1.62 |
- |
43 |
0.70 |
1256 |
87.8 |
68² |
2.6 |
0.73 |
1 Assuming the "exploitable growing stock" of Bulgarian forests is 405 million m² over bark and "exploitable forest area" is 3.2 million ha.
² UN-ECE/FAO secretariat estimates.
³ Share of private "forests" in the "forest and other wooded land" area.
4 Estimates by national correspondents.
5 Assuming the "exploitable forest area" in Japan is 23 829 million ha (stocked high forest area).
6 Calculated with the assumptions in notes 1 and 5.
The most frequently cited conflicts are between wood production and one of the other functions, notably environmental protection, nature conservation, hunting or recreation. There is concern about the use of certain types of machinery in the forest (causing compaction of soil), harvesting systems (e.g. clear-felling) and chemicals. Other conflicts have arisen between nature conservation or protection and recreation; for example, skiing damage to young plants, increased fire risks in tourist areas and excess visitor numbers in sensitive ecosystems.
Protected areas
|
NATIONAL PARKS |
NATURE RESERVES | ||
|
Europe (22 countries) |
Europe (24 countries) | ||
|
Number |
More than 220 |
Number |
More than 10500 |
|
Total area of which: |
7.66 million ha* |
Total area of which: |
9.65 million ha* |
|
- Forest and other wooded land |
22 percent |
- Forest and other wooded land |
36 percent |
|
Former USSR |
Former USSR | ||
|
Number |
21 |
Number |
167 |
|
Total area of which: |
2.24 million ha |
Total area of which: |
22.03 million ha |
|
- Forest and other wooded land |
- 46 percent |
- Forest and other wooded land |
43 percent |
|
United States |
Australia | ||
|
Number |
339 |
Number |
2 712 |
|
Japan |
Total area of which: |
2.37 million ha | |
|
Number |
82 |
- Forest and other wooded land |
22 percent |
|
Total area |
3.34 million ha |
|
|
|
Australia |
|
| |
|
Number |
514 |
|
|
|
Total area of which: |
18.61 million ha |
|
|
|
- Forest and other wooded land |
22 percent |
|
|
* Approximation.
Being involved in the international collection of forest resource information, one comes to appreciate that "the more you know, the more you realize how little you know". Over the past four and a half decades that FAO has been collecting and publishing such data, considerable strides have been taken by countries in improving and expanding knowledge about the resource. The 1990 assessment of the forest resources of the industrialized regions provides a vast amount of new information which will no doubt be helpful to a wide range of users, including many who in the past would have found little of interest in it. Yet we still seem to be as far away as ever from fulfilling the needs of information users, which also seem to be growing at an accelerating rate.
Better identification of the users of forest resource assessment information (particularly "new users") and their needs will be a key topic of discussion at the FAO/ECE Kotka meeting of experts, mentioned previously. Many of these new users are likely to be among the first to point out the information gaps and call for efforts to fill them. This is a challenge that national inventory managers and those working at the international level already well aware of the shortcomings and the difficulties in overcoming them will be facing. How far they will get will depend on the level of political and financial support given to undertaking the necessary research, developing new monitoring and assessment methodologies and collecting the additional information.
In any case, a balance will have to be struck between what individuals or particular groups of potential users would like in the way of new information and what will be truly relevant at the international level. There are some encouraging signs, for example from the United Nations Conference on Environment and Development (UNCED), that the global importance of forests for humankind - and hence of the need to understand them better - has been recognized at the highest levels.
Detailed analyses of the 1990 assessment of the industrialized countries' forests are only just beginning. Two major findings have already been mentioned: that the forest resources of the industrialized countries as a whole have been gradually expanding, certainly in terms of growing stock and increment and, in many countries, also in area; and that virtually everywhere the importance of the non-wood functions of the forest is growing, both in absolute terms and in relation to what is still the most important individual function - wood production.
The expansion of the temperate forest resource, should it continue - and there is little reason to think that it will not in the near future - will eventually raise a number of policy questions. For instance, up to what level is it good for the health and vitality of the forest for growing stock volumes to rise, given that this will be the result of an ageing of the resource as well as of an increasing backlog in thinnings in some countries? Should more attention be paid to the marketing of wood and its products in order to ensure that fellings are sufficient to allow the constant rejuvenation of the resource? Or should we allow it to become overmature to the point where natural losses from disease, insects, fire and so on reduce net increment to zero, as is more or less the case for virgin forest? Those who argue from a strictly preservation perspective might answer "yes". Others would query whether humankind can any longer afford not to utilize (sustainably) the variety of goods and services that a managed forest is able to provide.
Concern about the potential effects of atmospheric pollution on forest resources is increasing throughout the industrialized countries
The 1990 assessment does not provide us with a clear picture of the state of the forest resource's health or quality, and perhaps this is an aspect that needs to be addressed in future assessments. The forests of the industrialized countries are expanding in physical terms but, in many areas, they are under stress from various external agents and their vitality may be being eroded [Ed. note: see article by Kandler]. Forest fire causes serious ecological and economic damage in the drier areas, such as the Mediterranean basin and large areas of the former USSR, North America and Australia. Widespread storm damage to forests in Europe seems to have become more frequent. Under these conditions, the question of how long the forests can go on providing the quantity of goods and services that they have in the past remains unanswered.
The joint ECE/FAO division's work in Geneva has shown a number of areas that need to be carefully considered when drawing up plans for the next global assessment. One is that, to improve the quality and coverage of future surveys, more resources will have to be committed, both at the national and international levels.
Another area for continued priority work concerns classifications and definitions. Although there is universal agreement on the broad classifications and definitions to be applied in global surveys, there are problems of clarity and misunderstandings in some of the more detailed categories. This must be resolved before the next assessment.
Finally, the industrialized countries should give more attention to the monitoring of changes in their forest resources over time, both in physical and quality terms. This is one area where they can learn from the experience being gained in the developing regions.
The results of the 1990 assessment demonstrate that we know a lot more about the forest resources of the industrialized regions than we did even in the fairly recent past, but also that this is still far short of what we need to know to enable us to manage and use these resources in an optimal and sustainable way. This is a humbling thought, but it is also a tremendous challenge.
ECE/FAO. 1992. The forest resources of the temperate zones: the UN-ECE/FAO 1990 forest resource assessment. Vol. I. General forest resource information. ECE/TIM/62. New York, United Nations.
ECE/FAO. The forest resources of the temperate zones: the UN-ECE/FAO 1990 forest resource assessment. Vol. II. Benefits and functions of the forest. New York, United Nations. (In press)
![]()
![]()
![]()