


|
The need for detailed and reliable information on the changes in world forest resources, clearly expressed by researchers and by public opinion at large, is not being adequately met by the global statistics so far being produced. The remote sensing survey presented below was developed and implemented with the aim of producing the information needed for the tropical zone; its methodology, however, could easily be applied to the whole world.
A special publication on this important part of the 1990 assessment is in preparation. In the meantime this section is intended to give a first brief presentation of objectives, methods and main results, regarding changes in forest cover and condition over time.
The procedure of assessment presented in annex 2 provides only estimates of forest cover and deforestation at country level. To undertake control measures or simply to diagnose the problem, a better knowledge of the change processes is essential. For this purpose, the following types of questions need to be answered:
- How are the tropical forest resources changing?
- How much is being degraded? Fragmented?
- What is happening to deforested land?
- How are forest state and change linked with ecological and socio-economic conditions?
- What are the causes of deforestation?
The only satisfactory way to provide reliable information on the process of change is to establish a forest resources monitoring system, using a globally compatible and consistent methodology. This provides reliable and location specific change information. In consideration of cost, precision and timeliness of results, a sampling approach based on remote sensing was designed and used to cover the entire tropical zone (see Figure 10). The specific objectives were:
i) to achieve the highest possible level of consistency and precision in the assessment of forest cover state and change at global and regional levels;
ii) to develop and disseminate a simple and robust monitoring technique for producing the forest cover state and change estimates at global and regional levels with application also at national level;
iii) to provide spatial and statistical data for estimating class to class changes of land cover and forest cover categories between the two dates of interpretation at the sample locations and for producing change matrices at regional and global levels.
A distinctive feature of the methodology lies in the fact that it provides not only forest cover change data, but also maps and change matrices for each sample location. This enables estimations of class to class changes of land cover and forest categories between the two dates of interpretation at sample, regional and global levels: this is essential information for understanding the complex processes taking place, such as deforestation, fragmentation, degradation and afforestation. An example of raster maps derived from image interpretation change maps and the resulting transition matrix is given in Figure 11.
The survey is based on a sampling design covering all tropical countries. The World Reference System 2 (WRS2) for the LANDSAT satellites is used as the sampling frame. LANDSAT scenes covering approximately 3.4 million ha serve as sampling units.
In view of cost-benefit considerations, the sampling units have been selected from all LANDSAT scenes with a minimum land area of 1 million ha and a forest cover of 10% or more, estimated on the basis of existing vegetation maps. This has restricted the area surveyed to some 56% of the total tropical land area but containing over 86% of the total tropical forest.
The main characteristics of the survey design are as follows:
- It covers the entire range of woody vegetation formations in the tropics, from the rainforests of the wet zone to the shrub and tree savannas of the dry zone;
- It provides estimates of mean forest cover area and area change together with an estimate of associated error;
- It is cost-effective through use of two-stage stratification based on existing FORIS/GIS information;
- It is based on the concept of continuous forest inventory with a view to furnishing consistent estimates of mean changes over time.
This first survey round is based on a 10 per cent sample consisting of 117 sampling units randomly selected. The distribution of the selected sampling units by region is 47 in Africa, 30 in Asia and 40 in Latin America. This sample size was chosen to estimate forest cover at global level with a standard error less than ±5 per cent.
At each sample location, satellite images of the best quality and appropriate season, separated by an approximate ten-year interval, have been selected for observation. The image close to 1990 provides assessment of the current state; whereas the area in common between the 1990 and 1980 images provides the assessment to be made of the changes over time.
The salient features from a remote sensing point of view are the following:
i) Standard classification of various forest classes (closed, open, with shifting cultivation, fragmented) on a pan-tropical basis;
ii) Interdependent interpretation procedure: this interpretation approach secures the highest level of thematic and spatial consistency between historical and recent image classification. This procedure is the most important element of the methodology since it reduces the error associated to the estimate of changes and makes production of change matrices possible;
iii) Image archive: all images used represent permanent reference as part of a continuous time series; in future these images will be used to estimate the speed of change (3 or more time series);
iv) Low sophistication: in spite of its sound conceptual basis, the methods and procedures developed for this survey are simple and robust and require very low technological inputs; the methodology has been designed for implementation in average developing country conditions;
vi) Flexibility: although applied here in a global survey context, the monitoring methodology can be applied at national or sub-national level without substantial modifications.
The interpretation was implemented at selected regional and national forestry and/or remote sensing institutions, which have a good knowledge of the sample locations and are traditionally involved in forest resources assessment activities. With the two-fold objective of strengthening national capacities for forest monitoring and improving the quality of image interpretation, the Project organized three regional workshops and eight training sessions with national institutions, benefitting 27 countries and 81 participants.
The results and quality of the interpretation undertaken by local institutions were centrally reviewed and evaluated. A database was established and analyses carried out as is presented in the section following.
The project's Geographic Information System (GIS), with its multiple layers of geo-referenced information, has been an integral element of the survey both at the stage of survey design and at the stage of analysis of results.
Considering the extremely poor information available on the processes of change of the tropical forest resources, this project component could be considered an important achievement.
The matrices associated with the sampling units can be aggregated at various levels following the standard statistical procedure. Mean transition matrices have been produced and subsequent change analysis has been carried out for the three regions and by three ecological zones (Wet and Very Moist, Moist, Dry). Table 16 shows the global transition matrix, which gives the estimated class-to-class transitions in the total land area surveyed for the period 1980-1990.
Transition matrices are very rich in information but somewhat difficult to interpret. In the matrix above rows' totals give the class areas at year 1980 while the columns' totals give the class areas at year 1990. The shaded values along the diagonal of the matrix represent the class areas that remained unchanged.
To read the changes observed in any single class e.g. closed forest, we first read its total at 1980, namely 1 367.96 million hectares, and then read along the row inside the matrix: 1 275.91 remained unchanged, 8.97 changed into open forest, 9.27 changed into long fallow, and so on.
In order to complete the analysis concerning the class closed forest we should also consider what has changed into closed forest from other classes; this is done by reading down the closed forest column: of the total of 1 280.06 million hectares in 1990, 1 275.91 million hectares was already closed forest in 1980, 0.86 were open forest in 1980, 1.10 were long fallow, and so on.
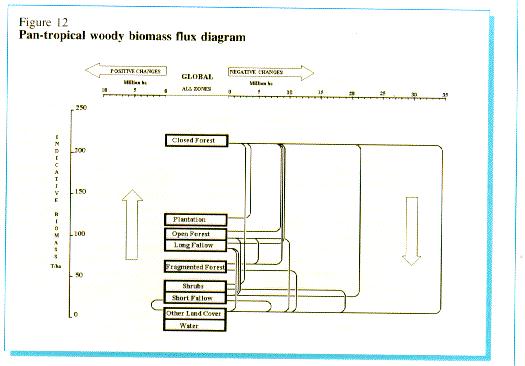
The area values reported in the table above do not communicate the impact of the observed land cover changes. The full magnitude of the changes is placed in better perspective when associated to estimates of biomass. An estimated mean biomass value for each class permits estimates of the biomass changes related to each class transition. The diagram in Figure 12 combines the values of change derived from Table 16 with this index of biomass.
Note: Only class transitions of more than 1.5 million hectares are shown in the diagram.
The Y axis, with its biomass values, order the classes by their estimated biomass per hectare.
The X axis reports the areas of class-to-class transitions, divided into positive and negative changes. The left side of the graph represents the lower-left part of the matrix, giving the positive class transitions (arrow up, increment of biomass), while the right side of the graph represents the upper-right part of the matrix, giving the negative class transitions (arrow down, loss of biomass).
Each transition is defined by the area value on the X axis and by the biomass value determined as the difference between the biomass values of the class of destination and the class of origin. By adding the biomass perspective, we are able to visualize and understand better the change processes, and even assess their environmental impact as release (or sequestration) of woody biomass related carbon.
The biomass flux diagram developed in this study is an essential tool to understand the typologies of change.
Figure 12 clearly shows the complexity of the dynamics observed. Some remarks:
- the negative changes are far more prevalent than the positive ones;
- almost all type of (negative) changes are represented;
- over 50% of all area changed come from the class closed forest;
- the most represented transition (closed forest to other land cover) implies a very large amount of biomass loss;
- most of new plantation area (agricultural and forestry) has been raised on previous closed forest area.
The first four of the nine land cover classes used in this study represent the forest under various conditions: grades of density (closed and open), spatial disturbance (fragmented) and temporal disturbance (long fallow shifting cultivation).
These classes can be grouped to offer various definitions of forest, from the most strict one that includes only the class closed forest to the broadest one which includes all four classes. The concept of forest as defined in the glossary of the present report (developing countries) lies somewhere in the middle of the two extremes, including closed and open forest and part of fragmented forest. It is implicit, but not always recognised, that the definition of forest determines the definition of deforestation. Since there is no single definition of forest satisfying all purposes, and in order to highlight the relativity of the concept of forest, three class groupings have been used in the present survey and three forest cover and deforestation rates have been estimated:
F1 = Closed Forest
F2 = Closed + Open Forest + part of Fragmented Forest
F3 = Closed + Open Forest + Fragmented Forest + Long Fallow
The results for the area surveyed, based on the interpretation of the full recent image in each sampling unit and an associated estimate of change, are the following (the figures at years 1980 and 1990 represent percentages of land area, while the deforestation rate represents the areas lost in ten years as percentage of the 1980 forest cover):
| Forest Definition |
|
|
|
|
|
|
|
|
|
|
|
|
|
|
|
The above disscussions clearly show that for a complete accounting of biomass changes, one must adopt a classification scheme inclusive of several forest classes with varying grades of density and perturbance.
The pan-tropical Change Matrix and the Woody Biomass Flux Diagram shown on the preceding pages summarize the land use dynamics of a wide variety of socio-economic and ecological environments. In order to evaluate the influence of these various conditions on the change processes it is useful to subdivide the pan-tropical data set into meaningful strata.
The influence of socio-economic factors on the change processes appears clearly when the results of the survey are analyzed at regional level. At that level of analysis typical change processes can be differentiated and the cause-effect relationship better understood. The graph in Figure 13 allows the regional characteristics in forest cover change to be compared.
The different patterns of forest area change indicate that there are differences between regions in the socio-economic processes causing them.
In Africa the deforestation to permanent agriculture is much less important than in the other regions and is accompanied by comparatively large amounts of deforestation to other wooded land (shrubs and short fallow agriculture), fragmentation and degradation. The process of change in Africa appears to be formed by phases of progressive degradation, characterised by a variety of relatively small changes, both in area and in biomass. The main actor behind this process is rural population pressure for land (subsistence farming, pastures) and wood (fuelwood, construction material).
In Latin America the change process appears to be quite different, with the deforestation to permanent agriculture (but also to pastures and water reservoirs) being by far the most important change while the others are almost negligible. This is mainly the effect of centrally planned operations of comparatively large scale (resettlement and forest exploitation/conversion). This type is characterised by large changes both in area and in biomass. These changes are usually fuelled by financial investments and heavy mechanisation.
In Asia both types of process seem to be represented, with important deforestation and degradation processes, the latter being mainly represented by an increase in shifting cultivation area. In this region a considerable amount of forest is converted to plantations, although primarily of agricultural type.
In order to understand these processes in an ecological context, the change matrices were aggregated by ecological zone. The zones, being defined on the basis of rainfall, are the following:
Z1 - Wet and Very Moist (rainfall > 2 000 mm)
Z2 - Moist (with short and long dry season) (rainfall 1 000-2 000 mm)
Z3 - Sub-Dry to Dry (rainfall 200-1 000 mm)
The results of this aggregation are given in Figure 14, which shows the principal types of change observed in the forest area by ecological zone. The forest definition used here corresponds to the class group (F3) composed of the classes Closed and Open Forest, Fragmented Forest and Long Fallow.
The trend is very clear (and consistent in all regions): the forest in the moist zone has been deforested, fragmented and degraded with much higher intensity than the forest in wetter and drier zones. This can be explained by the higher suitability of the moist zone to agricultural practices (and probably by the higher population density) in comparison with the other zones.
In addition to the analysis, the interpretations of the satellite images and the derived change maps are analyzed as spatial data and integrated with other layers of the project's Geographic Information System, such as protected areas, settlements/ population density, road network, etc. with the aim of developing spatial models and a map of the risk of forest depletion. In cooperation with the EEC TREES Project the spatial data is also used in the calibration/validation of the tropical vegetation mapping and monitoring program based on coarse resolution satellite data.
The pan-tropical forest cover mean has a standard error of ± 3.7% against the goal of ± 3.9%. This shows that the survey procedure and the sampling intensity were correctly chosen. The standard error of the rate of deforestation was ± 12.5%, much larger as compared to that for forest cover. This is expected because deforestation has a very high coefficient of variation. But even here a major gain in precision (or reduction of error) was achieved through the use of the interdependent image interpretation procedure, wherein the same person concurrently interprets the images of both the dates and estimates change directly. This resulted in much lower error, about one-fourth, compared to assessment of deforestation from independent assessments of forest cover made on two occasions by different individuals.
The survey provided estimates of forest cover at two points of time and the changes in between i.e. a trend-line. The design based on continuous forest inventory concepts is, however, well adapted for collecting reliable time-series data on forest cover, estimating changes and preparing transition matrices. The inter-dependent interpretation procedure is an essential requirement for obtaining consistent estimates of changes over a time period. The sampling makes it possible to provide results on a global basis in a timely and cost-effective manner. Two conclusions emerge from the present survey: i) the procedure of estmating forest cover changes at the global level by aggregating national statistics on changes, has unknown (large) error; and ii) the survey procedure presented here, based on sampling, is a cost-effective technique for global change assessment.
The present survey demonstrates that continuous forest inventory techniques combined with satellite images are well adapted to monitor changes in forest cover on a global scale. Such an undertaking is not an expensive proposition. Nor does it require a large institution, as the experience of the present survey indicates. Interest in global studies is now such that even a small team of 2-3 specialists could achieve such a task by mobilizing for this purpose the immense interest and resources that already exist.
