![]()
![]()
![]()
Analysis of livestock distribution
Some current trends in livestock distribution
Discussion and conclusions
Bibliography
P.N. de Leeuw and B. Rey
The authors can be contacted at the International Livestock Centre for Africa (ILCA), Nairobi, Kenya, and the Institute of Animal Production and Veterinary Science for Tropical Countries (IEMVT)/ILCA, Addis Ababa, Ethiopia, respectively.
The authors wish to thank Dr R. Reid of the International Laboratory for Research on Animal Diseases (ILRAD) and Dr L, Reynolds of ILCA for constructive comments and criticism, and Mr R. Kruska of ILRAD for creating Figure 1 and Mr N. Ndiwa for producing Figure 2. Ms S. M. Nagda is thanked for assisting with the data analysis and Ms G. Maloba and Ms S. Ikong'o for processing text and tables.
Livestock play an important role in the economy of sub-Saharan Africa, providing sustenance as milk and meat, animal traction and transport, manure for crop production, cash income from sales of livestock products and a safety net of capital assets to face risks and misfortunes in harsh environments.
Agriculture is still the dominant activity in most African countries since about 70 percent of the people live and work in rural areas. In 1980, agriculture, including both marketed and subsistence production, contributed US$20 000 million to the gross domestic product (GDP). The share of livestock production was 8 percent of total GDP and 25 percent of the total agricultural domestic product. If the value of manure and draught power were added, livestock's contribution would increase to 35 percent of the agricultural GDP (Winrock, 1992).
The contribution of livestock to agricultural GDP varies between regions and countries and tends to increase inversely along the rainfall gradient; hence, in countries in the drier zones livestock's contribution is greater than in countries located in wetter areas. In four countries Mauritania, Somalia, the Sudan and Botswana its share is above 50 percent, whereas in nine other countries it varies between 25 and 50 percent.
In most of Africa livestock production is extensive. This applies to pastoral and agropastoral systems in the arid and semi-arid zones, where rainfall patterns preclude reliable cropping and limit the support capacity of land for people and livestock. These systems are predominant over more than 30 percent of the land and include more than 40 percent of the cattle and small ruminants and all of the camels.
Livestock management is also extensive in higher rainfall areas with mixed-farming systems, even where overall land use has intensified as a result of increasing population pressure. In these systems, the livestock subsystem is managed to increase the overall output of land by exploiting the synergism between cropping and livestock through soil nutrient enhancement with manure, improved soil tillage with animal traction and income generation from milk and stock sales. Livestock continue to rely on natural pastures - mostly communally owned fallows and crop residues for feed, and few external inputs are applied to increase their productivity.
More inputs into the subsystem occur primarily when direct or indirect monetary benefits present themselves, for example, milk sales and opportunistic fattening of stock (in particular, to exploit increased demand during religious festivals). For these enterprises, purchased inputs and extra labour are made available. Likewise, to improve the work output of traction oxen, supplementary feed is provided when demands for tillage and transport are high. Thus it appears that, while increasing population pressure intensifies overall land use in mixed systems, the livestock subsystem remains extensive unless direct cash benefits accrue that warrant the injection of purchased inputs and extra labour.
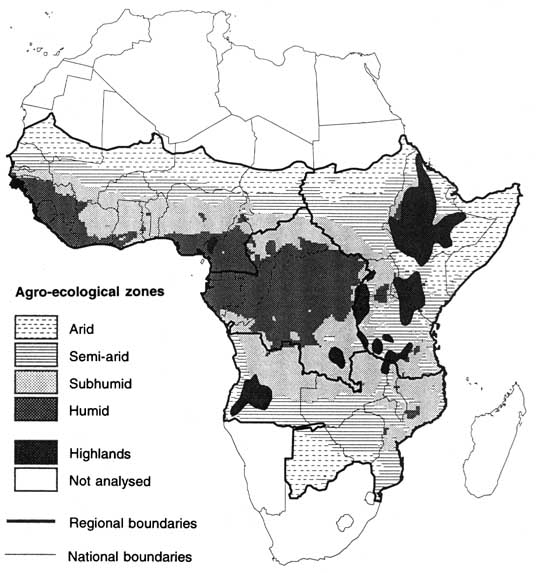
This paper attempts to demonstrate the importance of livestock in African agriculture through an analysis of the major factors affecting livestock density and species com position. In the zonal analyses, the general distribution patterns have been summarized by subdividing the continent into five agro-ecological zones (Table 1) and into four broad geographical regions (west, east, southern and central) (Figure 1) following the approach of Jahnke (1982). The livestock population data from his study were given by species and agro-ecological zones for each country, together with estimates of the rural population density based on FAO statistics for the period 1979 to 1981. In the second part of this paper, more recent changes in livestock distribution patterns are examined in order to verify some of the hypotheses formulated and to identify the causes.
Zonal analysis
The total area covered in this analysis amounts to 17.5 million km2 with a rural population of 230 million during the period 1978 to 1980, when the average level of urbanization in Africa was around 20 percent (Winrock, 1992) (Table 1). Assuming an average growth rate of 3.5 percent and allowing for an increasing level of urbanization, it was estimated that by 1993 the rural population would have increased to about 330 million.
Africa can be divided into five agro-ecological zones: using the length of the growing period (LOP) as a criterion, arid (0-90 days); semi-arid (90-180 days); subhumid (180-270 days); and humid (> 270 days); and the highlands, defined as areas over 1 500 m above sea level (Figure 1). The semi-arid, subhumid and humid zones cover 21, 26 and 23 percent of the total land area, respectively (Table 1), and have fairly similar rural population densities (12-17 people/km2), as compared with the low density level found in the arid zone (6/km2) and the high level in the highlands (42/km2).
1. Distribution of rural people and domestic ruminant livestock species by agro-ecological zone in tropical sub-Saharan Africa in 1979-1981 - Répartition de la population rurale et des espèces de ruminants domestiques par zone agroécologique en Afrique subsaharienne tropicale, 1 979-1 981 - Distribución de la población rural y de las especies de rumiantes domésticos por zonas agroecológicas en el Africa subsahariana tropical en 1979-81
|
|
Arida |
Semi-arid |
Subhumid |
Humid |
Highlands |
Total (millions) |
|
(percentage of total) |
||||||
|
Area |
25 |
21 |
26 |
23 |
5 |
17.5b |
|
People |
11 |
28 |
24 |
21 |
16 |
230.9 |
|
Cattle |
21 |
30 |
24 |
4 |
21 |
135.1 |
|
Sheep |
34 |
23 |
15 |
9 |
19 |
96.2 |
|
Goats |
38 |
26 |
17 |
10 |
9 |
120.5 |
|
Camels |
100 |
- |
- |
- |
- |
11.1 |
|
Tropical livestock unitc |
31 |
27 |
20 |
5 |
17 |
127.4 |
|
TLU per caput |
1.6 |
0.5 |
0.5 |
0.1 |
0.6 |
0 |
Source: Jahnke (1982).
aExcluding land with less than 100 mm of rainfall.
bIn km2
cTLU is 250 kg live mass: cattle 0.7 sheep and goats 0.1 and camels 1.0 TLU.
Note: The data analysis is restricted to continental tropical Africa, i.e. Madagascar, Swaziland, Lesotho, Namibia and South Africa were excluded.
Of the total livestock mass, expressed in tropical livestock units (TLU) of 250 kg weight, almost 60 percent is found in the two drier zones, whereas 17 percent is concentrated in the highlands, which cover only 5 percent of the total land mass. As regards species composition, the arid and semi-arid zones comprise 51 percent (69 million) of all cattle, almost 60 percent (130 million) of small ruminants and all of the 11 million camels (Table 1).
Intrazonal distribution of livestock
The two-way hierarchical analysis of zones and geographical regions can be expanded by clustering countries into homogeneous groups. Several parameters are sufficiently country-specific to allow a subjective clustering technique to be applied. Effective parameters include densities of rural people and of livestock species and the ratios derived from these parameters.
Arid zone. The 18 countries in this zone fall into five groups spread across West, East and southern Africa. Geographic location was used as the main criterion for subdivision (Table 2). In West Africa, the main group, Group 1, includes four Sahelian countries whose territories extend northwards into the Sahara. Human and livestock populations are low, whereas livestock wealth per caput is high. Group 2 consists of four countries with small strips of arid land along their northern borders. Cross-border livestock trade and transhumance accounts for the high livestock density. Also, the Senegal River and its flood plain forming the border between Senegal and Mauritania attracts high stocking densities, particularly during the dry season.
Over 60 percent of the livestock mass in the arid zone is concentrated in East Africa, two-thirds of which is located in Somalia and the Sudan (Group 3), numbering 7 million cattle, 20 million goats, 15 million sheep and 8 million camels (Table 1). In Kenya, Ethiopia and the United Republic of Tanzania (Group 4), because there are fewer camels and small ruminants, cattle (7.5 million) are more important than they are farther north.
Only 10 percent of the total livestock mass is found in arid southern Africa (Group 5), most of which is in Botswana. Rural population density is as low as in the Sahelian zone, but camels are absent and small ruminants are of minor importance, with 5 million cattle making up 93 percent of the livestock units.
Semi-arid zone. About 50 percent of the livestock mass in this zone is concentrated in West Africa on 40 percent of the land containing 55 percent of the rural population (Table 3). Two major groupings emerge based on human and livestock population densities, and these appear to be closely linked. The low-density Group 1 comprises five French-speaking countries, three of which are landlocked. In the high-density Group 2, Nigeria has the major share of livestock joining the other contributing countries, which all have well-developed mixed-farming economies with important cash-crop cultivation (groundouts in Senegal and the Gambia, and cotton in Burkina Faso and Cameroon).
In East Africa two groups can be distinguished: the main group, Group 3, in which the Sudan and Ethiopia are predominant, and the secondary group, Group 4, represented solely by the United Republic of Tanzania. In the Sudan and western Ethiopia rainfall is unimodal, whereas in the other countries, including Tanzania, the pattern is bimodal. Further heterogeneity is added by the diverse ethnic make-up of the pastoral and agropastoral production systems across East Africa. Despite this, the two groups are fairly similar in exploitative pressure, having a combined population of 20 million cattle and 22 million small ruminants, half of which are found in the Sudan. As the production systems are mostly pastoral, livestock wealth per caput is higher than in West Africa but lower than in the adjacent arid zone (Table 2).
In southern Africa there are five countries with semiarid areas that account for 32 percent of the total zonal land. Grazing pressure is much lower than elsewhere in the zone and cattle are more predominant (Table 3). Pastoralism is uncommon; instead, smallholder farming, often with animal traction, and commercial ranching are the principal production systems.
Subhumid zone. The subhumid zone represents 26 percent of the land area, and comprises 24 percent of the rural population and 20 percent of the livestock wealth (Table 1). In West Africa, because of the southward migratory movement of pastoralists and increased agricultural development during the last two decades, this zone has gained greater importance, often at the expense of the drier zones.
Two clusters of countries emerged: low-density countries, of which Ghana and Guinea are the most important (Group 1), and high-density countries, of which Nigeria and Côte d'Ivoire are the most prominent (Group 2) (Table 4). It is seen that while in the semi-arid zone there is often a close correspondence between population and livestock wealth (see TLU per caput ratios in Table 3), this is less so farther south. At the southern end of the subhumid zone (LGP > 210 days), livestock is less important and small-scale farmers keep mainly small ruminants as they do in the humid zone farther south (Table 5).
In East Africa, population pressure is less diverse and subdivision is linked with unimodal (mainly in the Sudan and a small part of Ethiopia; Group 3) and bimodal rainfall (in Uganda and the United Republic of Tanzania; Group 4), with the latter providing a higher human and livestock support capacity. These high stocking rates (two to three times higher than in West Africa) may also be related to higher soil fertility.
Although almost 40 percent of all subhumid land is found in southern Africa, Group 6 accounts for only 13 percent of the livestock mass, mostly because of the high level of tsetse challenge and the resulting low human population density. Small ruminants are of little importance here, as opposed to the central African countries in Group 5, where they represent over 20 percent of the total livestock mass.
2. Intrazonal distribution of people and domestic ruminant livestock species: arid zone - Répartition au sein des zones arides de la population et des espèces de ruminants domestiques - Distribución de la población y las especies de rumiantes domésticos dentro de la zona árida
|
|
West |
East |
Southern |
||
|
Group 1 |
Group 2 |
Group 3 |
Group 4 |
Group 5 |
|
|
People/km2 |
3.6 |
17.5 |
7.6 |
6.8 |
4.2 |
|
Cattle/km2 |
4.9 |
16.2 |
5.1 |
10.3 |
9.9 |
|
SR/km2 |
16.1 |
22.7 |
26.7 |
17.8 |
5.0 |
|
TLU/km2 |
6.1 |
14.1 |
12.2 |
11.1 |
7.4 |
|
SR TLU (%) |
27 |
16 |
22 |
16 |
7 |
|
Camels/TLU (%) |
17 |
4 |
49 |
19 |
|
|
TLU per caput |
1.7 |
0.8 |
1.6 |
1.7 |
1.8 |
|
|
(percentage of zonal total) |
||||
|
TLU |
26 |
2 |
42 |
20 |
10 |
|
Land |
39 |
1 |
31 |
17 |
12 |
|
People |
25 |
4 |
42 |
20 |
9 |
SR = small ruminants
TLU = tropical livestock unit
1. Niger, Mali, Mauritania, Chad
2. Senegal, Nigeria, Burkina Faso, Cameroon
3. Somalia, Sudan, Djibouti
4. Ethiopia, Kenya, Tanzania
5. Botswana, Zimbabwe, Angola, Mozambique
Note: In each group the countries have been listed in order of the size of their TLU population. Those countries in bold represent more than 50 percent of total TLU within their group.
3. Intrazonal distribution of people and domestic ruminant livestock species: semi-arid zone - Répartition au sein des zones semi-arides de la population et des espèces de ruminants domestiques - Distribución de la población y las especies de rumiantes domésticos dentro de la zona semiárida
|
|
West |
East |
Southern |
||
|
Group 1 |
Group 2 |
Group 3 |
Group 4 |
Group 5 |
|
|
People/km2 |
10.1 |
36.6 |
18.5 |
20.3 |
7.1 |
|
Cattle/km2 |
6.7 |
18.9 |
14.5 |
19.2 |
4.0 |
|
SR/km2 |
20.3 |
27.8 |
25.1 |
10.5 |
2.0 |
|
TLU/km2 |
5.7 |
16.0 |
12.7 |
14.5 |
3.0 |
|
SR/TLU (%) |
18 |
17 |
20 |
7 |
7 |
|
TLU per caput |
0.6 |
0.4 |
0.7 |
0.7 |
0.4 |
|
|
(percentage of zonal total) |
||||
|
TLU |
12 |
37 |
29 |
11 |
11 |
|
Land |
19 |
21 |
21 |
7 |
32 |
|
People |
11 |
45 |
23 |
8 |
13 |
SR = small ruminants
TLU = tropical livestock unit
1. Mali, Chad, Mauritania, Benin, Central African Republic
2. Nigeria, Burkina Faso, Senegal, Cameroon, Niger, Gambia
3. Sudan, Ethiopia, Kenya, Uganda
4. Tanzania
5. Zimbabwe, Zambia
Note: In each group, the countries have been listed in order of the size of their TLU population. Those countries in bold represent more than 50 percent of total TLU within their group.
4. Intrazonal distribution of people and domestic ruminant livestock species: subhumid zone - Répartition au sein des zones subhumides de la population et des espèces de ruminants domestiques - Distribución de la población y las especies de rumiantes domésticos dentro de la zona subhúmeda
|
|
West |
East |
Southern |
|||
|
Group 1 |
Group 2 |
Group 3 |
Group 4 |
Group 5 |
Group 6 |
|
|
People/km2 |
12.3 |
33.4 |
10.7 |
17.6 |
6.3 |
6.8 |
|
Cattle/km2 |
7.8 |
5.0 |
25.0 |
18.3 |
0.6 |
2.7 |
|
SR/km2 |
9.0 |
22.4 |
19.5 |
9.5 |
1.3 |
1.2 |
|
TLU/km2 |
6.4 |
5.7 |
19.5 |
13.7 |
0.6 |
2.0 |
|
SR/TLU (%) |
14 |
39 |
10 |
7 |
22 |
6 |
|
TLU per caput |
0.5 |
0.2 |
1.8 |
0.8 |
0.1 |
0.3 |
|
|
(percentage of zonal total) |
|||||
|
TLU |
15 |
12 |
31 |
27 |
2 |
13 |
|
Land |
14 |
12 |
9 |
12 |
16 |
37 |
|
People |
14 |
34 |
8 |
16 |
8 |
20 |
SR = small ruminants
TLU = tropical livestock unit
1. Cameroon, Guinea, Benin, Burkina Faso, Ghana, Guinea-Bissau, Chad
2. Nigeria, Côte d'Ivoire, Togo, Sierra Leone
3. Sudan, Ethiopia
4. Tanzania, Uganda
5. Zaire, Central African Republic, Congo
6. Zimbabwe, Malawi, Angola, Zambia, Mozambique
Note: In each group, the countries have been listed in order of the size of their TLU population. Those countries in bold represent more than 50 percent of total TLU within their group.
Humid zone. As shown by the extremely low TLU per caput ratios (Table 5), livestock production is relatively unimportant and accounts for only 5 percent of Africa's total mass on 23 percent of its land (Table 1). Three groups have been identified along a gradient of mounting rural population pressure, which runs parallel to that of cattle and an increasing importance of small ruminants. As a result, while this zone as a whole has only 5.4 million cattle, there are about 20 million sheep and goats. The low-density countries of Group 1 are found mainly in central Africa, occupying almost 80 percent of the total land. Cameroon is the major country in the medium-density Group 2, which covers only a small fraction of the humid zone. The humid areas along the Atlantic coast, in particular in Nigeria and Ghana, represent the high-density Group 3.
Highlands. The three clusters represent a steep population density gradient from 12 to 150 people per km2 with a concomitant rise in cattle and small livestock densities (Table 6). The major country with low exploitative pressure is Angola, which, together with small highland areas in Cameroon, Nigeria and Zambia, predominantly forms Group 1. Medium-density areas in Group 2 are mainly found in the highlands of Ethiopia and the United Republic of Tanzania. The high TLU per caput ratio of 0.9 is caused by a cattle: person ratio of 1.2 in Ethiopia resulting from the universal use of ox-ploughing to cope with widespread heavy soils. In addition to the 13.5 million cattle, there are 20 million small ruminants, of which 14 million are sheep, representing the highest sheep: goat ratio in Africa. Although covering only 16 percent of the highlands, the high-density Group 3 accounts for one-half of the population and one-third of all livestock. Intensive smallholder production systems (mainly for dairy production) in Kenya account for 7 million cattle and 4.5 million small ruminants, while Burundi and Rwanda (averaging 215 people/km2) contribute to the extremely high population density in this group.
French-speaking West Africa
As mentioned earlier, many changes have occurred in West Africa as a result of drastic redistributions of people and livestock, mostly from the arid and semi-arid zones into the higher rainfall areas. An example of these shifts can be found in southern Mali, where statistics from the late 1970s indicated a low density of 7 people and 5.4 TLU per km2 (Jahnke 1982), while more recent data indicate that there are now 20 to 30 people and 15 to 20 TLU per km2 (Hykoop, van der Poel and Kaya, 1991).
Similarly, in the semi-arid zone of Senegal, the overall cattle density in 1979-1981 was 15 per km2. Aerial surveys taken in the late 1980s during the dry season showed that in the northern border region along the Senegal River and in the main groundnut-growing area in the west, with an annual rainfall of 500 to 800 m, densities varied from 16 to 25 TLU per km2 (Faye and Marks, 1990). In the most densely populated areas, stocking rates of up to 80 TLU per km2 have been reported (Mortimore, 1991).
In the southern portion of the semi-arid zone and in most of the subhumid zone, work oxen (totalling 0.9 million) (Coe, 1991) dominate the livestock enterprise of mixed farmers.
While the supply of male stock for oxen used to come from pastoral producers farther north, recurrent droughts combined with adverse political and socioeconomic developments in the Sahelian zone have reduced surplus stock for sale. As a result, in situ production of male stock has become essential, and herd accumulation by cash-crop farmers, a reinvestment of their crop returns, has been promoted. This trend has had several consequences, including greater reliance on crop residues and on purchased high-quality concentrated feed, as well as greater pressure on communally owned grazing resources. It was found that, in the more densely settled areas, crop residues provide up to 40 percent of the total dry-season feed resources (Leloup and Traore, 1989, 1991).
Nigeria
In the zonal analysis the overall livestock mass amounted to 11.7 million TLU, consisting of 12 million cattle, 8.5 million sheep and 24.2 million goats, which corresponds with the FAO estimates for 1979/80 (Jahnke, 1982). Of this mass, 65 percent was believed to be in the arid and semi-arid zones, 20 percent in the subhumid zone and 13 percent in the humid zone, giving equivalent densities of 23, 6 and 9 TLU per km2, respectively.
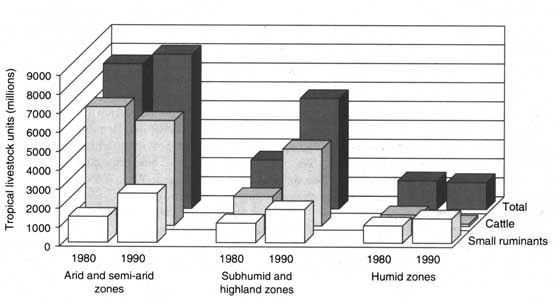
These data are compared with new livestock estimates and distribution patterns derived from aerial surveys carried out in the dry and wet seasons of 1990 (RIM, 1992). A preliminary analysis established the following longitudinal trends (Figure 2):
· Total cattle, sheep and goat numbers have increased by 15 percent, 160 percent and 42 percent, respectively, contributing to an overall rise in livestock mass of 37 percent.· Changes in cattle density by zone showed a reduction of 15 percent in the semi-arid zone and an increase of 270 percent in the subhumid zone, where numbers rose from 1.8 to 6.8 million.
· Small ruminant densities increased by 80 percent in the semi-arid zone, by 65 percent in the subhumid zone and by 55 percent in the humid zone.
· The overall TLU density remained unchanged in the semi-arid zone (25 TLU/km2) and increased by 145 percent in the subhumid zone (from 6 to 14 TLU/km2), but remained the same in the humid zone (9 TLU/km2).
These aerial surveys confirmed the earlier evidence of the large and permanent influx of cattle into the subhumid zone, but refuted the hypothesis that this shift would lower the grazing pressure in the semi-arid zone. Even though cattle numbers dropped by about 10 percent, the numbers of small ruminants rose concomitantly. As a result, the overall grazing pressure increased to 33 TLU per km2.
5. Intrazonal distribution of people and domestic ruminant livestock species: humid zone - Répartition au sein des zones humides de la population et des espèces de ruminants domestiques - Distribución de la población y las especies de rumiantes domésticos dentro de la zona húmeda
|
|
Group 1 |
Group 2 |
Group 3 |
|
People/km2 |
6.3 |
13.6 |
49.2 |
|
Cattle/km2 |
0.9 |
1.3 |
4.8 |
|
SR/km2 |
2.1 |
2.7 |
26.8 |
|
TLU/km2 |
0.8 |
1.2 |
6.1 |
|
SR/TLU (%) |
25 |
23 |
44 |
|
TLU per caput |
0.1 |
0.1 |
0.1 |
|
|
(percentage of zonal total) | ||
|
TLU |
45 |
9 |
46 |
|
Land |
78 |
11 |
11 |
|
People |
42 |
13 |
45 |
SR = small ruminants
TLU = tropical livestock unit
1. Ethiopia, Zaire, Central African Republic, Côte d'Ivoire, Congo, Angola, Mozambique Gabon
2. Cameroon, Sudan, Liberia Togo
3. Nigeria, Ghana, Uganda, Guinea, Sierra Leone
Note: In each group the countries have been listed in order of the size of their TLU population. Those countries in bold represent more than 50 percent of total TLU within their group.
6. Intrazonal distribution of people and domestic ruminant livestock species: highlands - Répartition dans les hautes terres de la population et des espèces de ruminants domestiques - Distribución de la población y las especies de rumiantes domésticos dentro de la zona de sierras altas
|
|
Group 1 |
Group 2 |
Group 3 |
|
People/km2 |
11.8 |
28.9 |
149.3 |
|
Cattle/km2 |
8.3 |
29.7 |
75.4 |
|
SR/km2 |
2.6 |
38.5 |
55.8 |
|
TLU/km2 |
6.1 |
24.6 |
58.3 |
|
SR/TLU (%) |
4 |
16 |
10 |
|
TLU per caput |
0.5 |
0.9 |
0.4 |
|
|
(percentage of zonal total) | ||
|
TLU |
4 |
62 |
34 |
|
Land |
17 |
67 |
16 |
|
People |
4 |
44 |
52 |
SR = small ruminants
TLU = tropical livestock unit
1. Angola, Nigeria Cameroon, Zambia
2. Ethiopia, Tanzania, Zaire
3. Kenya, Uganda, Burundi, Rwanda
Note: In each group the countries have been listed in order of the size of their TLU population. Those countries in bold represent more than 50 percent of total TLU within their group.
East Africa
In East Africa, pastoral ethnic groups exercise strong sovereignty over the rangeland domains they occupy. These groups, including Boran, Gabbra, Turkana, Samburu and Masai, are widely spread from Ethiopia and Somalia in the north to the United Republic of Tanzania in the south (Sperling and Galaty, 1990). As a result of the close linkage between grazing domains and ethnic groups, conflicts are common.
Other characteristics of East Africa are the greater heterogeneity of the landscape, which is dotted with resource-rich mountain islands, and the bimodal rainfall, which promotes perennial grasses and high-quality dwarf shrubs but discourages rain-fed cropping since the seasonal rainfall and LGPs are highly erratic. Therefore, whereas in West Africa, because of unimodal rainfall, rain-fed cropping extends northwards up to isohyets of 300 to 400 mm - coinciding with the 75-day LGP limits mixed-cropping systems in East Africa are rarely found where annual rainfall is less than 500 to 600 mm.
Both the arid and semi-arid zones in East Africa are more heavily stocked than in West Africa. Also, because of lower population density, livestock wealth per caput is higher (Tables 2 and 3). These aggregated data, however, mask the increasing livestock density along the arid to semi-arid gradient. Whereas in arid Kenya densities average 9 TLU per km2, farther south grazing pressure increases rapidly with rainfall. In Kajiado district, which straddles the arid and semi-arid zones and harbours mainly Masai pastoralists, the average stocking rate during the period from 1983 to 1988 was 26 TLU per km2, ranging from 32 TLU per km2 in the semi-arid zone to 18 TLU per km2 in the arid zone. During drier years, however, stocking rates were as low as 21 TLU per km2 in the rainy season and 9 TLU per km2 in the dry season since many Masai herds moved to wetter areas (Grandin, de Leeuw and Lembuya, 1989; de Leeuw, 1991; Solomon-Bekure et al., 1991).
While the semi-arid zone in the United Republic of Tanzania was stocked at 15 TLU per km2 (Table 3), Mwalyosi (1992) recorded livestock densities ranging from 30 to 80 TLU per km2 in predominantly Masai grazing areas in the northeast. Despite this high pressure, the author concluded that "grazing affected plant composition and contributed to localized severe soil erosion but did not affect primary production; even at 80 TLU per km2, primary production appeared high enough to support the high livestock biomass".
Equally high stocking rates were found in mixed smallholder farms in semi-arid Kenya, where most land is held in freehold and little free grazing is available. While livestock wealth increased with farm size, grazing pressure showed the opposite trend. The larger landowners (> 8 ha) on average kept 1 TLU per hectare of land, whereas on small farms (1 to 3 ha), stock:land ratios of up to 4 TLU per hectare were recorded; perhaps renting of grazing land or entrusting stock to relatives and friends made up for recurrent feed shortages (de Leeuw, 1990; de Leeuw, Dzowela and Nyambaka, 1990; Jaetzold and Schmidt, 1983).
Southern Africa
The aggregate livestock densities combining data from several countries in southern Africa are lower than those in East and West Africa, particularly in the semi-arid zone (Table 3). Conservative stocking rates of large-scale ranches geared to commercial beef production (aimed at large gains per head rather than per unit area) in Zimbabwe and Botswana were believed to be the main reason for these lower densities. In Botswana, recommended stocking rates for the semi-arid zone are 12.5 TLU per km2 (Abel, 1993) compared with an actual rate of 3 TLU per km2 in the late 1970s (Jahnke, 1982). In Zimbabwe, livestock pressure was 6 TLU per km2, or below the recommended rate of 8 to 14 TLU per km2 (Mombeshora and Maclaurin, 1989; Scoones, 1993).
In both countries, livestock ownership by smallholder farmers created much higher densities. In southeastern Botswana, Abel (1993), studying cattle production in traditional mixed-farming systems, found average stocking rates of up to 25 TLU per km2. Scoones (1993) showed that long-term livestock densities of smallholder communities in semi-arid Zimbabwe ranged from 20 to 30 TLU per km2.
Highlands
The major highlands are found in Ethiopia, Kenya, Rwanda and Burundi with densities of 27,66,32,35 TLU per km2, respectively, representing over 60 percent of the zonal land and 80 percent of the livestock mass (Table 6). Within this highland region, although climatically fairly consistent (bimodal rainfall totalling 900 to 1 300 mm), prevailing farming systems differ affecting trends in livestock distribution.
In terms of livestock numbers, the highlands of Ethiopia are the most important, accounting for 64 percent of the 18 million TLU; they are distinct in that over 80 percent of the ruminant livestock mass consists of cattle, of which work oxen for traction may constitute up to 50 percent. In addition, grazing pressure is further increased by horses and donkeys, which add another 20 percent to the herbivore mass (Gryseels, 1988). Average stocking densities mask large variations in space; for instance, in the southeastern, central and northwestern highlands, TLU per km2 values were 87, 68 and 30, respectively, in the early 1980s, with- an overall mean of 48 TLU per km2 (Jahnke and Getachew Asamenew, 1983).
Very high densities occur in intensely farmed areas near Addis Ababa in Ethiopia, where livestock rely mostly on crop residues as little land is left to fallow and pasture (Bekele Shiferaw, 1991). Between 1979 and 1990, as a result of increasing population pressure, the livestock density dropped from 64 to 55 TLU per km2; small ruminants and equines declined by 20 and 25 percent, respectively, as compared with only 13 percent in cattle. This shows that the provision of traction retained a higher priority than that of transport or generation of cash income from small ruminants. Although livestock numbers increased with farm size, as in semi-arid Kenya, grazing pressure and farm size were negatively correlated: farmers with less than 2 ha of land owned the equivalent of 1.5 to 2.2 TLU per hectare, while those with 3 to 6 ha of land were stocked at 0.7 to 1.5 TLU per hectare. Most land is privately owned and on-farm feed is the major source as communal grazing is not only scarce, but rapidly disappearing altogether (Getachew Asamenew, 1991).
In the Kenyan highlands during 1978-1980, there were 6.9 million cattle (86/km2), of which 1.2 million were kept in intensively managed dairy herds (Cinema, 1984). By 1991, this number had increased to 3.1 million, consisting entirely of grade cattle (Reynolds and Metz, 1994). Most of these are kept on small farms, 2 to 3 ha in size, of which about 50 percent of the land is devoted to planted forage and grazing (van der Valk, 1985). Cattle densities per farm are very high and a large proportion of the feed is purchased. The amount of land with planted forage varies: about 40 percent of the sampled farms had less than 0.2 ha per dairy cow and 30 percent had 0.4 to 1.0 ha. Aggregate stocking rates averaged about 3 TLU per hectare of smallholder land.
Between 1980 and 1989, there was a 50 percent increase in livestock mass in Rwanda, resulting in an overall livestock density of 48 TLU per km2 (based on a stratified sample survey of 2 500 farms) (ENA, 1991). This increase was mainly the result of the tripling of the sheep population from 0.26 to 0.72 million and an increase of goats from 0.79 to 1.97 million.
Carrying capacity
One of the major questions arising from this analysis is to what extent do livestock densities and the resulting grazing pressure exceed feed supplies, or, in other words, which regions and zones within countries are overstocked and can be identified as "danger areas" (de Leeuw, 1992). Also, as a corollary, can permissible stocking densities that safeguard the resource base and, at the same time, maintain the productivity levels of livestock to provide the subsistence food, income, traction and soil-fertility enhancement required by their owners be determined?
The simplest approach to arriving at permissible densities is to examine feed supply and demand ratios that underlie the conventional manner of determining livestock carrying capacity (de Leeuw and Tothill, 1993; Bartels, Norton and Perrier, 1993). Winrock (1992) assessed consumable feed by zone at 0.19, 0.51, 0.72 and 0.76 tonnes of dry matter per hectare for the arid, semiarid, subhumid and highland zones, respectively, which convert to permissible densities of 8, 22, 31 and 33 TLU per km2. Given these assumptions, it can be concluded that only limited areas in the arid zone and highlands exceeded these permissible densities (Tables 2 to 6).
Regional feed supply and demand ratios are crude and ignore several modifying factors; for instance, feed supplies may be reduced because only a fraction of land is available for grazing since access is constrained by cropped land and flooding during the rainy season, by a water shortage for livestock in the dry season and by dense woody vegetation throughout the year. Permissible removal fractions are much higher for annual grasses than for perennial grasses, as the former regenerate from seed and do not depend on below-ground biomass to survive into the next growing season. Likewise, "proper use" needs temporal adjustment to vegetation phenology with higher safeguards in the growing season and lower precautions in the dry season, particularly where excess biomass is regularly removed by fires.
These considerations may explain why actual stocking densities are so much higher than recommended, as was demonstrated by long-term data from semi-arid Botswana, Zimbabwe, Somalia and Masai grazing areas in East Africa [Scoones, 1993; Field (1980) quoted by Bartels, Norton and Perrier, 1993].
Livestock species composition
The growing, but variable, importance of small ruminants can be linked to land-use intensification, replacing cattle when feed resources decline because of contracting farm size. They are also the main ruminants in root-cereal-tree crop systems in the humid and wetter parts of the subhumid zone, where sedentary cattle-keeping has been traditionally absent (Tables 4 and 5). Low small ruminants: cattle ratios are associated with systems where oxen traction predominates, not only in the Ethiopian highlands, but also in the West African cotton-growing belt, where small ruminants account for only 6 to 10 percent of the total livestock mass (Lhoste, 1990; de Leeuw, Reynolds and Rey, 1993). Likewise, in southern Africa, cattle predominate because traction has high priority. Recent data from Zimbabwe show that smallholders in the communal areas own 98 percent of all small ruminants, totalling 1.9 million, of which 95 percent are goats. They comprised only 8.3 percent of the total livestock mass, however, although ratios varied between ecological zones (Mombeshora and Maclaurin, 1989).
Factors that influence sheep: goat ratios are difficult to identify, partly because good data are lacking. For the entire continent, the ratio is 0.8, whereas each of the four zones has a mean of 0.7, except the highlands, where sheep are more numerous (ratio 1.7). Ratios of less than 1.0 are most common in arid and- semi-arid French-speaking West Africa and the Sudan. Similarly, in the north of Nigeria and Cameroon, the two species occur in equal proportions (RIM, 1992; Planchenault, 1992). Conversely, in most of East and southern Africa, goats are more than twice as numerous as sheep.
In the wetter areas, reliable data separating sheep and goats are lacking, with ratios for countries within the same zone and region being different. If the trends in Nigeria are representative (RIM, 1992), however, goats become more important with increasing rainfall. In southern Nigeria, about two-thirds of the 13 million small ruminants are goats.
In conclusion, it appears that population density and the need to diversify livestock enterprises explain the variable role of small ruminants in farming systems. In contrast, choice of species seems to be governed by a complex of factors, including religion and food preferences, browse resources, disease risks and opportunities for sales to local and foreign markets.
Trends in land-use intensification
The highest livestock densities were mostly found in heavily populated areas in the highlands and in the semiarid zone, particularly in Nigeria. Except where oxen traction remains important, small ruminants increased as a proportion of total mass as farm size declined and only the larger households continued to keep cattle. In the closely settled area around Kano in Nigeria, overall stocking rates are about 100 TLU per km2, half of which are small ruminants. Soil fertility is maintained by heavy manuring combined with applications of inorganic fertilizers, while crop residues are stored and fed along with purchased feed-stuffs mainly destined for dry-season feeding of draught oxen and fattening of sheep (Agyemang, Little and Singh, 1993; Mortimore, 1991). It was demonstrated that similar stocking densities prevailed in other farming systems with high population densities, particularly in the Ethiopian and Kenyan highlands.
It appears that increasing feed supplies becomes an integral part of the intensification process through the purchase of cottonseed cake, the collection, transport and storage of crop residues and bush grass, and crop residues/manure exchange contracts between livestock-poor and livestock-rich households (Mortimore, 1991). Planchenault (1992) showed that in northern Cameroon 90 to 95 percent of the cotton farmers fed crop residues, minerals and agricultural by-products.
In several areas in the West African semi-arid and subhumid zones, livestock densities appear to stabilize in farming systems in which the human support capacity is enhanced, as a result of advanced crop/livestock interactions fuelled by cash-crop cultivation. In semiarid Nigeria, Cameroon and the Gambia, Jahnke (1982) recorded stocking rates of 20 to 25 TLU per km2, with corresponding densities of 30 to 50 rural people per km2. It seems that, more than a decade later, these levels had not been substantially exceeded (Sumberg, 1992; RIM, 1992; Planchenault, 1992). In Nigeria, with the exception of the closely settled areas in the semi-arid zone, aggregate densities in the northern states varied from 18 to 30 TLU per km2 (averaging 20 TLU/km2). These densities are similar to those found in the more developed cotton-growing areas in Mali and northern Côte d'Ivoire (Lhoste, 1990; de Leeuw, Reynolds and Rey, 1993).
It is postulated that, at these population and livestock densities, most of the better arable land is under crops or short-term fallows, producing more dry-season feed per hectare than the natural pastures on the poorer soils (Reynolds and de Leeuw, 1993), and that crop residues are more optimally utilized when animal-drawn transport is available to allow on-farm storage. In addition, because of better manure management and inorganic fertilizer inputs, combined with further mechanization - for ex ample, the use of seeders and weeding equipment yields of cereal crops and cash crops (cotton, groundnuts) increase, thereby enhancing feed output from residues (Adesina, 1992; Sumberg, 1992; Sumberg and Gilbert, 1992).
Concluding remarks
This analysis attempted to establish a workable two-dimensional context in which to place past, current and future trends in livestock distribution patterns in tropical Africa. It has been shown that these trends reflect a complex web of factors acting upon rural agricultural economies. However, although all of the five ecological zones have well-defined distinguishing features in common, regional differences have modified the trajectories of change because of the cumulative effects of differences in landscapes and soils, ethnic compositions and past histories. It is argued that, with the rapid progress in geographical information systems technology, this initial framework could be further refined and its predictive capacity enhanced by extending the analysis of past trends into the future.
Abel, N.O.J. 1993. Reducing cattle numbers on Southern African communal range: is it worth it? In R.H. Behnke, L Scoones, & C. Kerven, eds. Range ecology at disequilibrium, p. 173195. London, UK, Overseas Development Institute.
Adesina, A.A. 1992. Oxen cultivation in semi-arid West Africa: profitability analysis in Mali. Agric. Systems, 38: 131-147.
Agyemang, K., Little, D.A. & Singh, B.B. 1993. Emerging evidence of highly integrated crop-livestock farming systems in northern Nigeria: a case study from Kano State. Draft Report. Nigeria, ILCA. 9 pp.
Bartels, G.B., Norton, B.E. & Perrier, G.K. 1993. An examination of the carrying capacity concept. In R.H. Behnke, I. Scoones & C. Kerven, eds. Range ecology at disequilibrium, p. 89-103. London, UK, Overseas Development Institute.
Bekele Shiferaw. 1991. Crop-livestock interactions in the Ethiopian highlands and effects on sustainability of mixed farming: a case study from Ada district. Agricultural University of Norway, Oslo, Norway. 162 pp. (M.Sc. thesis)
Chema, S. 1984. Milk production in Kenya. In K.A. Kategile, ed. The potential far small-scale milk production in eastern and southern Africa, p. 34-47. MR98c. Ottawa, Canada, International Development Research Centre (IDRC).
Coe, M.R. 1991. Le bétail trypanotolérant pour la traction en Afrique occidentale et centrale. Bulletin de liaison sur le bétail trypanotolérant, 4: 5-10.
ENA (Enquête national agricole 1989). 1991. Publ. DSA n° 22, Rwanda.
Faye, A. & Marks, M. 1990. Rapport de la quatrième campagne d'enquêtes aériennes: décompte du bétail. CSE (Centre de suivi écologique), Dakar, Senegal. 12 pp.
Field, D. 1980. The measurement of rangeland resource in Somalia. Extension Pamphlet No. 6. Mogadishu, Somalia, National Range Agency.
Getachew Asamenew. 1991. A study of the farming systems of some Ethiopian highland vertisol locations. Working Document. Addis Ababa, Ethiopia, ILCA. 150 pp.
Grandin, B.E., de Leeuw, P.N. & Lembuya, P. 1989. Drought, resource distribution and mobility in two Maasai group ranches in southeastern Kajiado district. In T.E. Downing, K.W. Gitu, & C.M. Kamau, eds. Coping with drought in Kenya, p. 245-263. Boulder, CO, USA, Lynne Rienner Publishers.
Gryseels, G. 1988. Role of livestock on mixed smallholders farms in the Ethiopian highlands. Agricultural University, Wageningen, the Netherlands. 249 pp. (Ph. D. dissertation)
Hykoop, J., van der Poel, P. & Kaya, B. 1991. Une lutte de longue haleine. Institut d'économie rurale, Bamako, Mali et Institut royal des tropiques, Amsterdam, the Netherlands. 154 pp.
ILCA. 1987. ILCA's strategy and long-term plan. Addis Ababa, Ethiopia, ILCA. 99 pp.
Jaetzold, R. & Schmidt, H. 1983. Farm management handbook of Kenya: vol. IIB, Central Kenya. Ministry of Agriculture, Kenya.
Jahnke, H.E. 1982. Livestock production systems and livestock development in tropical Africa. Kiel, Germany, Kieler Wissenschaftsverlag Vauk. 253 pp.
Jahnke, H.E. & Getachew Asamenew. 1983. An assessment of the recent past and present livestock situation in the Ethiopian highlands. Ethiopian Highlands Reclamation Study, Working Paper No.7. FAO/Ministry of Agriculture, Addis Ababa, Ethiopia.
Leeuw P.N. de. 1990. On-farm livestock research in sub-Saharan Africa: a review of results, problems and issues. Farming Systems Bull. (CIMMYT), 7: 2-11.
Leeuw, P.N. de. 1991. Livestock populations in Kenyan rangelands: an analysis of trends using census and aerial survey data. In Proc. Eighth Small Ruminant CRSP Workshop, Nairobi, Kenya, Feb. 1990. p. 325-334. Small Ruminant Collaborative Research Support Programme, Nairobi, Kenya.
Leeuw, P.N. de. 1992. Potential environmental impacts. In Potential for impact: ILCA looks to the future. p. 11-26. Working Paper No. 2. Addis Ababa, Ethiopia, ILCA.
Leeuw P.N. de, Dzowela, B.H. & Nyambaka, R. 1990. Budgeting and allocation of feed resources. In Proc. First Joint Workshop of PANESA/ARNAB, Lilongwe, Malawi, Dec. 1988. p. 222-223. Addis Ababa, Ethiopia, ILCA.
Leeuw P.N. de, Reynolds, L. & Rey, B. 1993. Nutrient transfers from livestock in West African agricultural production systems. Paper prepared for the Conference on Livestock and Sustainable Nutrient Cycling in Mixed Farming Systems of sub-Saharan Africa, Addis Ababa, Ethiopia, Nov. 1993.
Leeuw, P.N. de & Tothill, J.C. 1993. The concept of rangeland carrying capacity in sub-Saharan Africa - myth or reality. In R.H. Behnke, I. Scoones & C. Kerven, eds. Rangeland ecology at disequilibrium, p. 77-88. London, UK, Overseas Development Institute.
Leloup, S. & Traore, M. 1989, 1991. La situation fourragère dans le sud-est du Mali - Tome I: Région CMDT de Sikasso et de Koutiala (1989). 91 pp. Tome II: Région CMDT de San (1991). 71 pp. Institut d'économie rurale, Sikasso, Mali et Institut royal des tropiques (KIT), Amsterdam, the Netherlands.
Lhoste, P., ed. 1990. Actes du séminaire sur l'élevage en zone cotonnière; Etudes et synthèses IEMVT, 21-29 Oct. 1989, Ouagadougou. Maisons-Alfort, France.
Mombeshora, B.G. & Maclaurin, A.R. 1989. Rangeland resources, livestock potential and production constraints in small scale livestock systems in Zimbabwe. In A.R. Maclaurin, & B.V. Maasdorp, eds. Rangeland potential in the SADCC region, p.153-165. Harare, Zimbabwe, Southern African Development Coordination Conference (SADCC).
Mortimore, M. 1991. A review of mixed farming systems in the semi-arid zone of sub-Saharan Africa. Working Document No. 17. Livestock Economics Division. Addis Ababa, Ethiopia, ILCA.
Mwalyosi, R.B.B. 1992. Influence of livestock grazing on range condition in Southwest Masailand, northern Tanzania. J. Appl. Ecol., 29: 581-588.
Planchenault, D. 1992. Enquête de productivité du bétail camerounais. Cameroon.
Reynolds, L. & de Leeuw, P.N. 1993. Myth and manure in nitrogen cycling. Paper prepared for the Conference on Livestock and Sustainable Nutrient Cycling in Mixed Farming Systems of sub-Saharan Africa, Addis Ababa, Ethiopia, Nov. 1993.
Reynolds, L. & Metz, T. 1994. Smallholder dairy production in Kenya. National Dairy Development Project, Nairobi, Kenya.
RIM. 1992. Nigerian livestock resources: vol. 2, National synthesis. Jersey, UK, Resource Inventory and Management Ltd.
Scoones, I. 1993. Why are there so many animals? Cattle population dynamics in the communal areas of Zimbabwe. In R.H. Behnke, I. Scoones, & C. Kerven, eds. Range ecology at disequilibrium. p. 62-76. London, UK, Overseas Development Institute.
Solomon-Bekure, de Leeuw P.N., Grandin, B.E. & Neate, P.J.H., eds. 1991. Maasai herding: an analysis of the livestock production system of Maasai pastoralists in eastern Kajiado District, Kenya. ILCA Systems Study 4. Addis Ababa, Ethiopia, ILCA. 154 pp.
Sperling, L. & Galaty, J.G. 1990. Cattle, culture and economy: dynamics in East African pastoralism. In J.G. Galaty & D.L. Johnson, eds. World of pastoralism, p. 69-97. New York, NY, USA, The Guilford Press.
Sumberg, J.E. 1992. Livestock development in the Gambia. Trop. Anim. Health Prod., 24: 193-203.
Sumberg, J.E. & Gilbert, E. 1992. Agricultural mechanisation in the Gambia: drought, donkeys end minimum tillage. African Livestock Res., 1: 1-10.
Valk, Y.S. van der. 1985. Annual report: recording farms 1984-1955. National Dry Development Project, Naivasha, Kenya. 46 pp.
Winrock. 1992. Assessment of animal agriculture in sub-Saharan Africa. Arlington, VA, USA, Winrock International.
![]()
![]()
![]()