![]()
![]()
![]()
R.L.M. Schils and P.J.M. Snijders
Research Station for Cattle, Sheep and Horse Husbandry
Runderweg 6, 8219 PK Lelystad, The Netherlands
Introduction
Materials and methods
Results
Discussion and conclusions
References
Between 1983 and 1986 average phosphorus (P) surpluses on specialized dairy farms in the Netherlands was 31 kg ha-1 (Aarts et al., 1992). In a phased approach government policy aims to reduce the P surpluses and ultimately fertilizer P application has to equal herbage P offtake, allowing for environmentally acceptable losses. Until now recommendations on P application aim to optimize dry matter (DM) yield and P content it in herbage. So it is most likely that in the future P application will be sub-optimal. Generally white clover in mixed swards is a poor competitor for P (Dunlop and Hart, 1987) and a reduction in P fertilization might result in reduced white clover growth and consequently lower total herbage yields. The experiment aims to provide information on the effects of P application on pure perennial ryegrass swards and on mixed swards. It will continue for at least three years. This article presents results from the establishment year.
The trial was established on a young marine clay soil, reclaimed from the sea only 40 years ago and with a grass/clover sward since 1990. In January 1994 the trial site was ploughed to a depth of 25 cm and reseeded in April. Grass-only plots were drilled with 20 kg ha-1 perennial ryegrass (cvs Herby and Exito) and grass/clover plots additionally with 5 kg ha-1 white clover (cvs Retor and Alice). Table 1, which contains soil characteristics determined just before reseeding, shows that as a result of ploughing the highest nutrient concentrations are found at a depth of 20 to 25 cm. The level of available P is very low; in the Netherlands a level of 13 to 17 mg P per 100 g dry soil in the top soil (0-5 cm) is regarded as sufficient.
Table 1. Some soil characteristics at the start of the trial.
|
|
Depth (cm) |
|||||
|
0-5 |
5-10 |
10-15 |
15-20 |
20-25 |
25-30 |
|
|
Organic matter1 |
2.8 |
2.8 |
3.0 |
3.4 |
4.0 |
2.9 |
|
Available P2 3 |
5 |
5 |
6 |
7 |
8 |
6 |
|
Total P2 |
54 |
55 |
58 |
61 |
66 |
58 |
|
Total N2 |
151 |
155 |
168 |
187 |
203 |
165 |
1: g 100 g dry soil-1, 2: mg 100 g dry soil-1, 3: Extraction with ammonium lactate
The trial was designed as a randomized-block trial with three replicates consisting of combinations of two sward types (grass-only and grass/clover) and four P rates, 0, 32, 66 and 98 kg ha-1 year-1 (designated P0, P1, P2 and P3, respectively). Grass-only treatments were combined with three annual N rates 0, 200 and 400 kg ha-1 (designated N0, N1 and N2, respectively), while grass/clover treatments were only combined with N rates 0 and 200 kg ha-1 year-1. An area of 6 × 1.5 m was harvested from the plots with a Haldrup mower leaving a stubble of 40-50 mm. Herbage samples were taken for analysis of DM, N and P contents. On grass/clover plots an additional sample was taken for manual separation of grasses and white clover. Nitrogen, P and K were applied in the form of calcium ammonium nitrate (27% N), triple superphosphate (20% P) and potassium chloride (50% K), respectively. Each cut received an application of 40 kg K ha-1. To prevent any effect of P on germination, the whole site was fertilized with only 4 kg P ha-1 at seeding. From June to October five cuts were taken.
Nitrogen application decreased both white clover yield and content significantly (Table 2). Compared with earlier trials on the same location white clover contents were relatively low. White clover yield responded positively to P, specially on the NO plots, though the NxP interaction was not significant. Because grass yield (not shown) responded to P in a similar way, white clover content was hardly affected by P application rate.
Table 2, White clover yield (t DM ha-1) and white clover content (%)
|
white clover yield |
white clover content |
|||||
|
N0 |
N1 |
mean |
N0 |
N1 |
mean |
|
|
P0 |
1.3 |
0.8 |
1.1 |
16 |
7 |
12 |
|
P1 |
1.4 |
0.7 |
1.1 |
17 |
6 |
12 |
|
P2 |
1.6 |
0.9 |
1.3 |
18 |
8 |
13 |
|
P3 |
1.8 |
0.9 |
1.4 |
20 |
8 |
14 |
|
mean |
1 5 |
0.8 |
1.2 |
18 |
7 |
13 |
|
LSD/significance |
|
|||||
|
Nitrogen |
0.17/*** |
1.8/*** |
||||
|
Phosphorus |
0.24/* |
2.6/NS |
||||
|
Interaction |
0.35/NS |
3.7/NS |
||||
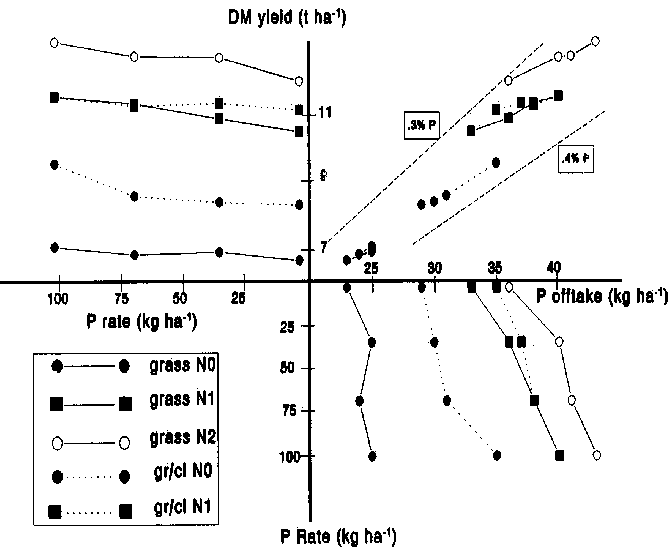
Results on total P offtake and DM yield are presented in Figure 1. Quadrant IV shows that P offtake increased clearly with increased P application rate. On grass-only swards the difference in P offtake between P3 and PO was 2, 7 and 7 kg P ha-1 for N0, N1 and N2, respectively. This positive NxP interaction was not so evident on the grass/clover swards. In this case the reponse to P, from P0 to P3, was 6 and 5 kg P ha-1 for N0 and N1, respectively. The P application rate at which P offtake was equivalent to P application varied from approximately 24 to 36 kg ha-1.
Average P contents in herbage from the grass-only N0 treatment were around 0.36% and showed no response to applied P. Nitrogen application on grass-only swards (grass-N1 and -N2) reduced the mean P content to 0.32%, but within each N treatment P content increased with P application rate. Herbage on grass/clover plots had an average P content of 0.37 and 0.34% on N0 and N1 treatments, respectively. With no N applied (gr/cl-N0) P content was hardly affected by P applied, but within gr/cl-N1 treatments P content showed a positive response to P application.
Quadrant II shows the DM yield as a function of P application rate. On grass-only swards the marginal reponse to P increased with N rate and was 4.2, 10.5 and 11.2 kg DM per kg P for N0, N1 and N2, respectively. On grass/clover plots the response to P was lower with N than without N. Dry matter yield increased by 12.3 and 4.1 per kg P for N0 and N1, respectively.
The results in this establishment year showed a modest positive effect of P application on grass and white clover DM yields. On grass-only plots a consistent interaction existed between N and P application rate when considering P offtake, P content and DM yield. In contrast, grass/clover plots receiving fertilizer N showed a poorer reponse to P than those receiving no N. Results in the following years will show whether the above effects are consistent or not. Furthermore, the effect of P in early spring can be established, a period when P is considered to be very important for herbage growth. Further soil analyses will elucidate how available and total P responds to the different P application rates.
Figure 1. Relationships between annual P application, P offtake and DM yield.
AARTS, H.F.M., BIEWINGA, E.E. and van KEULEN, H. (1992) Dairy farming systems based on efficient nutrient management. Netherlands Journal of Agricultural Science, 40, 285-299.
DUNLOP, J. and HART, A.L (1987) Mineral nutrition. In: Baker, M.J. and Williams, W.M. (eds) White clover, pp. 153-183. C.A.B. International, Wallingford.
![]()
![]()
![]()