Per caput demand for food crops
Total demand and supply
Scenarios of crop yields
Harvested areas
The direct food consumption of cereals is expected to increase at a rate just above that of population (Figure 1). The increase in per caput direct food consumption of cereals will increase only slightly from the present level of about 170 kg per year. Animal feed is expected to increase much more, at present accounting for some 16% of the total human consumption, and increasing to 30% in 2050 and 35% in 2100 in the medium feed scenario (Table 6). There are important regional differences in the scenario (Appendix 2). The overall total cereal consumption grows from the current 237 kg per caput to close to 300 kg in 2050 and 320 kg per caput in 2100.
The group of pulses comprises leguminous crops such as beans, peas, chickpeas, lentils, etc. Soybeans and groundnuts are included in the oilseeds. Pulses form an important group of food crops, in particular for low-income population. In the developing countries the average per caput consumption declined from 12 to 7-8 kg per caput in the period 1960-1990. The scenario describes a further decrease to a level of 5 kg (Figure 1). If China is excluded from the developing countries the average consumption is slightly higher (Appendix 2).
This category of basic foods comprises a variety of crops, the major ones being cassava, sweet potatoes, potatoes, yams, taro and plantains. An important part of the production and consumption occurs at the subsistence level. A problem with this group is that its production prevails in countries with poor statistical services and that it is subject to above-average waste and post-harvest losses (Alexandratos, 1995:100). Therefore, the uncertainty in the current per caput consumption of starchy foods is much greater than for other food crops. In general, the scenario describes a fairly stable consumption level for the developing countries as a whole (Figure 1). There are regional differences caused by a weak negative correlation between income level and starchy food consumption (Appendix 2). For the developing countries as a whole, the feed use accounts for some 20% of total demand at present, and the percent feed demand changes only marginally in the consumption scenario.
Projections of future demand for oil crops are uncertain. Oil crops include tree crops with slow response to changing market conditions, and annual crops with a high supply response. Furthermore, most oil crops produce oil and protein meals for livestock. There is a high degree of substitutability in the consumption of both vegetable oils and protein meals for livestock. Vegetable oils also compete with animal fats in the food market, and with fishmeals and other protein meals in the animal feed market. In addition, vegetable oils also have industrial uses. The per caput food consumption of vegetable oils in the developing countries is about 8 kg, about half of the current consumption of 16 kg per caput in developed countries. The consumption grows to 11 kg per caput in 2010, 17 in 2050 and then further to 20 kg in 2100 (Figure 1 and Appendix 2). The demand for oilseed proteins is expected to grow faster than that for vegetable oils, reflecting the fast growth in the livestock production. No scenarios of the animal feed use of oilseed proteins were constructed (see Chapter 4).
The current per caput sugar consumption in the developing countries of around 18 kg (Figure 1) is well below that in developed countries (37 kg). The regional consumption varies from close to 45 kg in Latin America and 33 kg in North Africa to only 8 kg in Sub-Saharan Africa. The low sugar consumption in China and centrally planned Asian countries (7 kg per caput) is due to the use of alternative sweeteners to substitute sugar. In the AT2010 projection the consumption in the developing countries increases by about 1 kg per decade to about 20 kg in 2010. In the scenario after 2010 the consumption increases more slowly to close to 30 kg in 2050 and 38 kg in 2100 (Appendix 2).
The per caput consumption for "other crops" is not presented because this group comprises products varying from vegetables and fruits to industrial crops, such as rubber, cotton and jute (Appendix 1). The per caput consumption of this group of crops is assumed to remain constant from 2010 onwards.
The total demand for cereals in all developing countries rises much faster than the per caput demand (Table 6 and Appendix 2). In this scenario the population in all developing countries increases by more than 40% between 1990 and 2010, by over 100% between 1990 and 2050 and 140% in 1990-2100. Cereal demand increases by 50% between 1990 and 2010, 150% between 1990 and 2050, and more than 200% between 1990 and 2100. As the food consumption of cereals is rather stable, an important part of the increase of total demand in the scenario is caused by the increasing demand for cereal feed for livestock production, which increases from 16% of total demand in 1990 to 35% in 2100. The crop with the most rapid increase in demand is maize, with a growth from 22 to 40 million ton between 1990 and 2010, 86 million ton in 2050 and 140 million ton in 2100 (Appendix 11a). The demand for temperate cereals and rice, sorghum and millet grows much more slowly (Appendixes 9a, 10a and 12a), mainly due to the slow growth of the demand for these crops as animal feedstuff when compared to maize. The increase rate of the total cereal production decreases from close to 3% per year observed in the period 1980-1990, to 2.2% per year in 1990-2010, 1.8% per year in 2010-2025, 1% per year in 2025-2050 and 0.5% per year in 2050-2100.
The per caput demand for pulses in the developing countries is rather stable and even shows a slow decrease. As a result the total demand increases much more slowly than that of cereals (Appendix 13). There are important regional differences, with faster than average growth of the demand in Africa. The growth of total production in all developing countries increased by 1.7% per year between 1980 and 1990. In the scenario this growth rate will be maintained up till 2010, slowing down in the period after 2010. In the period 2050-2100 the assumed total production of pulses will even begin to decrease.
The future increase of the total demand for this group of basic food crops in the developing countries reflects the population increase and the use of these crops as animal feed, because the per caput food demand is almost constant (Appendix 2; Table 7). Much of the increase is caused by the increasing total demand in Sub-Saharan Africa (Appendix 14a). The total production of starchy foods in all developing countries continues the growth observed in the period 1980-1990 (1.6% per year) up to 2025; the growth of total production will decrease to 0.9% per year (2025-2050) and 0.2% per year (2050-2100).
At present the total demand for oil crops in the developing countries, including China, is about 40 million tons of oil equivalents or 140 million tons of biomass (Table 8). The total demand for oil crops will increase by close to 80% between 1990 and 2010, almost 300% in 1990-2050, and 400% in the full period 1990-2010 (Table 8). Food consumption will increase by both rising per caput consumption and the population increase (Appendix 2). The use of oilseed cakes in the livestock sector is not described in the scenario, but it may cause additional increases in the demand, as noted in Chapter 4. The growth of vegetable oil production was about 4% in the period 1980-1990 in all developing countries including China (Table 8); in the scenario it will decrease to 3% per year in 1990-2010, 2.7% per year in 2010-2025, 1.6% per year in 2025-2050 and 0.6% per year in 2050-2100.
Total demand for sugar will greatly increase in all regions (Appendix 16a), but the strongest growth in the scenario is seen in Sub-Saharan Africa, mainly due to the low levels of consumption at present (Appendix 2). The demand in all developing countries including China will increase from the present - 95 million tons of sugar to about 150 million tons in 2010, and to - 300 million tons in 2050 and over 400 million tons in 2100. In all developing countries the production of sugar was 3.6% per year in 1980-1990. In the scenario the production growth will slow down to 2.3% in the period up to 2025, and further to 1.4% per year and 0.8% per year in 2025-2050 and 2050-2100, respectively.
General aspects
Cereals
Pulses
Starchy foods
Sugar crops
Oil crops and other crops
The projections of the yields of the different crops were made on the basis of both region-and crop-specific considerations. In general the procedure concerned assumptions of the yield maxima or ceilings for irrigated and rainfed crops and regions, based on climate, soil suitability, historic developments and expected or possible research breakthroughs at the field level. Once these maximum yields were defined, the time path for the development of current yields towards this region-specific target level was generated. For the medium scenario, in general, the growth rate of AT2010 is simply extrapolated to later years until the yield ceiling is reached. After that yields are assumed to be constant. In the high and low scenarios the respective increase rates are 1.25 x and 0.75 x that of the medium scenario from 1990 onwards until the yield ceiling is reached. The procedure for calculating the irrigated areas, and from that the irrigated production, rainfed production and rainfed areas, is discussed in Chapter 2.
TABLE 9
Production, harvested areas and yields for three scenarios for total cereals in the developing countries.
M, H, L = medium, high and low scenario. Production in 106 ton/year, yield in ton/ha, area in 106 ha
|
|
'61/63 |
'69/71 |
'79/81 |
1989BYa |
1989/91 |
2010 |
2025 |
2050 |
2075 |
2100 |
|
|
ALL DEVELOPING COUNTRIES INCL. CHINA |
|||||||||||
|
Production |
351 |
480 |
648 |
918 |
862 |
1296 |
1655 |
2066 |
2308 |
2494 |
|
|
Yield |
M |
1.0 |
1.2 |
1.6 |
|
2.0 |
2.8 |
3.4 |
4.2 |
4.7 |
4.8 |
|
H |
|
|
|
|
|
3.1 |
4.0 |
5.1 |
5.7 |
5.8 |
|
|
L |
|
|
|
|
|
2.5 |
2.9 |
3.3 |
3.6 |
3.8 |
|
|
Area |
M |
358 |
393 |
407 |
|
425 |
469 |
486 |
491 |
493 |
517 |
|
H |
|
|
|
|
|
417 |
410 |
407 |
407 |
427 |
|
|
L |
|
|
|
|
|
513 |
571 |
623 |
640 |
662 |
|
|
ALL DEVELOPING COUNTRIES EXCL. CHINA |
|||||||||||
|
Production |
240 |
309 |
397 |
507 |
513 |
779 |
1004 |
1351 |
1576 |
1765 |
|
|
Yield |
M |
0.9 |
1.1 |
1.3 |
1.6 |
1.6 |
2.2 |
2.7 |
3.6 |
4.2 |
4.3 |
|
H |
|
|
|
|
|
2.4 |
3.3 |
4.4 |
5.1 |
5.3 |
|
|
L |
|
|
|
|
|
2.0 |
2.3 |
2.7 |
3.1 |
3.3 |
|
|
Area |
M |
259 |
290 |
303 |
321 |
322 |
360 |
368 |
376 |
380 |
406 |
|
H |
|
|
|
|
|
320 |
307 |
306 |
309 |
332 |
|
|
L |
|
|
|
|
|
398 |
441 |
491 |
508 |
530 |
|
a 1989BY = base year estimate of AT2010. For China only projections of production are available, not of areas harvested.
TABLE 10
Production, harvested areas and yields for three scenarios for pulses in the developing countries. M, H, L = medium, high and low scenario. Production in 106 ton/year, yield in ton/ha, area in 106 ha
|
|
'61/63 |
'69/71 |
'79/81 |
1989BYa |
'89/91 |
2010 |
2025 |
2050 |
2075 |
2100 |
|
|
ALL DEVELOPING COUNTRIES INCL. CHINA |
|||||||||||
|
Production |
32 |
31 |
31 |
36 |
37 |
53 |
60 |
67 |
62 |
60 |
|
|
Yield |
M |
0.6 |
0.6 |
0.6 |
|
0.6 |
0.8 |
1.0 |
1.3 |
1.6 |
1.8 |
|
H |
|
|
|
|
|
0.9 |
1.2 |
1.7 |
2.1 |
2.3 |
|
|
L |
|
|
|
|
|
0.8 |
0.9 |
1.1 |
1.4 |
1.5 |
|
|
Area |
M |
52 |
52 |
52 |
|
57 |
63 |
61 |
52 |
39 |
34 |
|
H |
|
|
|
|
|
57 |
52 |
39 |
30 |
26 |
|
|
L |
|
|
|
|
|
69 |
68 |
61 |
45 |
39 |
|
|
ALL DEVELOPING COUNTRIES EXCL. CHINA |
|||||||||||
|
Production |
22 |
24 |
24 |
30 |
31 |
45 |
53 |
60 |
57 |
56 |
|
|
Yield |
M |
0.5 |
0.5 |
0.5 |
0.6 |
0.6 |
0.8 |
0.9 |
1.2 |
1.6 |
1.7 |
|
H |
|
|
|
|
|
0.9 |
1.1 |
1.6 |
2.1 |
2.3 |
|
|
L |
|
|
|
|
|
0.7 |
0.8 |
1.1 |
1.4 |
1.5 |
|
|
Area |
M |
42 |
45 |
46 |
51 |
52 |
58 |
56 |
48 |
37 |
32 |
|
H |
|
|
|
|
|
52 |
48 |
36 |
27 |
24 |
|
|
L |
|
|
|
|
|
63 |
63 |
57 |
42 |
36 |
|
a 1989BY = base year estimate of AT2010. For China only projections of production are available, not of areas harvested.
Important increases in the cereals yields occur in all three scenarios. According to the medium scenario for all developing countries the yield of cereals increases at a rate of 1.6% per year in 1990-2010, and 1.4% per year, 0.9% per year and 0.3% per year in the respective periods 2010-2025, 2025-2050 and 2050-2100. Over the whole projection period 1990-2100 the cereal yields increase by a factor of 2.5, and by about a factor of 3 in the high scenario (Table 9). The scenarios for the individual cereals in the developing regions show similar increases.
For the high scenario the maximum regional average yields for temperate cereals are about 4 ton/ha for rainfed production and 8 ton/ha for irrigated production (Appendix 9b). An exception is North Africa, where, in the high scenario, the yields increase to 10 ton/ha. In the low and medium scenario the maximum yields of temperate cereals amount to 6 and 7 ton/ha, respectively.
Current rice yields exceed those of the other cereals in most regions (Appendix 10b). Rainfed rice is mainly unfertilized and the maximum yields are assumed not to exceed 3 ton/ha. The maximum yields for East and South Asia (8 ton/ha and 7 ton/ha, respectively) are somewhat lower than those for China1. The main reason for this assumption is that these regions have tropical climates, and rice yields in temperate conditions such as in China are generally higher.
1 The reasoning behind the yield scenarios for rice is illustrated with an example for China. The current mean irrigated rice yield in China is about 5.8 ton/ha. Of the total harvested area of 42 Mha, about 35 Mha is irrigated, and there is about 15 Mha of hybrid rice sown at present. The new "super rice" varieties may have 20% higher yields than hybrid rice, and 40% higher than non-hybrid rice. For the medium scenario 100% penetration of super rice is assumed, so that the mean irrigated yield for China may increase by some 40% to > 8 ton/ha in the next decades. Assuming further increase in rice growing technology, a maximum average yield of 9 ton/ha will be reached by the middle of the next century. In the high scenario for China the maximum irrigated yield is assumed to be 10 ton/ha, and in the low scenario 8 ton/ha.
Maize yields also show major increases in the scenarios, with a high yield ceiling of 15 ton/ha in North Africa and 12 ton/ha in the Near East in Asia (Appendix 11b). For maize rainfed production also shows major increases. Highest rainfed maize yields are assumed for East Asia, where there is a fast growth from current 1.7 ton/ha to 4 ton/ha in 2050, and Latin America, with an assumed growth from current 1.7 to 4.5 ton/ha in 2050. For regions where dry climates prevail, such as North Africa, lower rainfed yields were assumed.
Sorghum and millet form an important group in South Asia and Sub-Saharan Africa (Appendix 12b and c). The yield scenario for sorghum and millet follows the scenario for total cereals. The highest maximum irrigated yields in the medium scenario are assumed for North Africa (6.5 ton/ha) and Latin America (5.5 ton/ha).
TABLE 11
Production, harvested areas and yields for three scenarios for root and tuber crops and plantain in the developing countries.
M, H, L = medium, high and low scenario. Production in 106 ton/year, yield in ton/ha, area in 106 ha
|
|
'61/63 |
'69/71 |
'79/81 |
1989BYa |
'89/91 |
2010 |
2025 |
2050 |
2075 |
2100 |
|
|
ALL DEVELOPING COUNTRIES INCLUDING CHINA AND C.P. ASIAN COUNTRIES |
|||||||||||
|
Production |
222 |
307 |
356 |
421 |
408 |
564 |
713 |
884 |
922 |
957 |
|
|
Yield |
M |
7.3 |
9.1 |
9.7 |
|
10.4 |
12.1 |
14.1 |
18.3 |
24.3 |
31.9 |
|
H |
|
|
|
|
|
12.9 |
15.7 |
21.8 |
30.9 |
43.4 |
|
|
L |
|
|
|
|
|
11.5 |
12.7 |
15.3 |
18.9 |
23.2 |
|
|
Area |
M |
30 |
34 |
37 |
|
39 |
46 |
50 |
48 |
38 |
30 |
|
H |
|
|
|
|
|
44 |
45 |
40 |
30 |
22 |
|
|
L |
|
|
|
|
|
49 |
56 |
58 |
49 |
41 |
|
|
ALL DEVELOPING COUNTRIES EXCLUDING CHINA AND C.P. ASIAN COUNTRIES |
|||||||||||
|
Production |
127 |
173 |
204 |
270 |
258 |
388 |
504 |
669 |
714 |
764 |
|
|
Yield |
M |
7.0 |
7.7 |
8.2 |
9.4 |
8.9 |
10.8 |
12.7 |
17.0 |
23.2 |
31.1 |
|
H |
|
|
|
|
|
11.5 |
14.2 |
20.4 |
29.6 |
42.4 |
|
|
L |
|
|
|
|
|
10.1 |
11.4 |
14.2 |
18.0 |
22.5 |
|
|
Area |
M |
18 |
22 |
25 |
29 |
29 |
36 |
40 |
39 |
31 |
25 |
|
H |
|
|
|
|
|
34 |
36 |
33 |
24 |
18 |
|
|
L |
|
|
|
|
|
38 |
44 |
47 |
40 |
34 |
|
a 1989BY = base year estimate of AT2010. For China, only projections of production are available, not of areas harvested.
TABLE 12
Production, harvested areas and yields for three scenarios for sugar cane and sugar beet in the developing countries.
M, H, L = medium, high and low scenario. Production in 106 ton/year, yields in ton/ha, area in 106 ha
|
|
'61/63 |
'69/71 |
'79/81 |
1989BYa |
'89/91 |
2010 |
2025 |
2050 |
2075 |
2100 |
|
|
ALL DEVELOPING INCL. CHINA |
|||||||||||
|
Productionb |
380 |
512 |
703 |
965 |
1007 |
1484 |
1772 |
2218 |
2696 |
3169 |
|
|
Yieldb |
M |
45 |
49 |
52 |
|
58 |
71 |
75 |
78 |
76 |
75 |
|
H |
|
|
|
|
|
77 |
87 |
95 |
101 |
102 |
|
|
L |
|
|
|
|
|
64 |
64 |
66 |
66 |
65 |
|
|
Area |
M |
8 |
10 |
13 |
|
17 |
21 |
24 |
28 |
35 |
42 |
|
H |
|
|
|
|
|
19 |
20 |
23 |
27 |
31 |
|
|
L |
|
|
|
|
|
23 |
28 |
33 |
41 |
49 |
|
|
ALL DEVELOPING EXCL. CHINA |
|||||||||||
|
Production |
372 |
496 |
669 |
899 |
930 |
1344 |
1559 |
1952 |
2389 |
2825 |
|
|
Yield |
M |
46 |
51 |
54 |
59 |
60 |
74 |
80 |
83 |
80 |
78 |
|
H |
|
|
|
|
|
81 |
94 |
104 |
110 |
110 |
|
|
L |
|
|
|
|
|
66 |
67 |
70 |
69 |
67 |
|
|
Area |
M |
8 |
10 |
12 |
15 |
16 |
18 |
19 |
23 |
30 |
36 |
|
H |
|
|
|
|
|
17 |
17 |
19 |
22 |
26 |
|
|
L |
|
|
|
|
|
20 |
23 |
28 |
35 |
42 |
|
a 1989BY = base year estimate of AT2010, For China, only projections of production are available, not of areas harvested.b Biomass harvested, not sugar equivalents.
Yields of pulses are assumed to increase at a fast rate in the developing countries as a whole. The current average yields are close to 0.6 ton/ha, increasing to 0.8 ton/ha in 2010 in the medium scenario. The current increase rate (1.3% per year) of the pulses yield in all developing countries slows down to 1.1% per year (2010-2025), 1% per year (2025-2050) and 0.6% per year (2050-2100) in the medium scenario, giving a total increase over the period 1990-2100 of a factor of 3 in the medium scenario (Table 10). In the high scenario an accelerated increase occurs between 2010 and 2025. For the individual regions the yield development is very similar to that of the developing countries as a whole, with irrigated yields increasing to 2.5 - 3.0 ton/ha in 2050 in most regions in the medium scenario, and with the lowest yields in Sub-Saharan Africa (Appendix 13b).
In the developing countries the medium scenario the yields for this group of crops increase from 9-10 ton/ha to 11-12 ton/ha in 2010 (1 % per year) and further to 14 ton/ha in 2025 (1 % per year). The increase continues to 2050, when levels of 17-18 ton/ha are achieved and further to 2100 with yields of 30 ton/ha (Table 11). Hence, as for most other crops, a total increase of the yield by a factor 3 is assumed between 1990 and 2100. The individual regions show differences in yields caused by differences in the importance of the individual crops within the group (Appendix 14b). The most important regions in terms of area harvested are China and centrally planned Asian countries and Sub-Saharan Africa. In the first region the demand shows only a very slow increase, and this has resulted in a scenario with a much slower yield increase than in the other regions, from 14 to 17 in 2010 and a factor of 2.5 between 1990 and 2100. In Sub-Saharan Africa the yield increase is initially slower in the medium scenario, although the total increase over the period 1990-2100 represents a factor of 4.
In the medium scenario the yields of sugar crops in all developing countries show a decreasing growth from the present 1% per year (1990-2010) to 0.8% per year (2010-2050) and 0.4% per year (2050-2100) (Table 12). In addition to the biomass production, the sugar yield is also determined by the extraction rate. This rate increases in all regions from present levels to 13% (Appendix 16a). In the medium scenario the irrigated yields of cane increase to a maximum of 100 ton biomass per hectare in all regions, equivalent to a sugar yield of 13 ton/ha (Appendix 16b). In the high scenario the maximum yield is 125 ton/ha and in the low scenario 90 ton/ha. Only in North Africa are these absolute maxima for cane not reached. In the Near East in Asia the major crop is beet, for which lower maxima for the high scenario for irrigated fields of 90 ton per ha were assumed. The maximum rainfed yields are 60-85 ton/ha. With the development in irrigated areas this results in a overall yield increase for sugar cane to a maximum of about 100 ton/ha in Latin America and Sub-Saharan Africa, and about 120 ton/ha in East Asia.
The yield scenarios for oil crops and the group of other crops were assumed to be identical to the average yield development for the other crops in the three scenarios. They are not presented because these groups are so diverse.
Cereals
Pulses
Starchy foods
Sugar crops
Oil crops and other crops
Total harvested area
The aggregated results for the harvested area of all cereals in all developing countries show an increase rate of 0.5% per year for the period 1990-2010, 0.2% per year for 2010-2025, nearly no change up till 2050 and a slow decrease in the period 2050-2100 (Table 9), The increase is a result of the assumed relative increases of irrigated and rainfed areas and the yield scenarios. There are considerable differences in the composition of total cereals between the various regions (Appendixes 9c-12c)1.
1 As noted in Chapter 2 the self-sufficiency ratios for all products were assumed constant for all regions, except for North Africa and the Near East in Asia where the fast growth in the total demand for cereals led to expansions of arable land that by far exceeded the unused productive land and irrigation potential. In the Near East in Asia the self-sufficiency ratio of the major cereals (wheat, barley and other cereals) was assumed to decrease from the estimated ~70% in 2010 to ~50% in 2100, the self-sufficiency ratio for total cereals decreases to 55 % (Table 6). In North Africa the self-sufficiency ratio for temperate cereals was assumed to remain almost constant over the period 1990-2010, and after 2010 up to 2100 it was assumed to decrease to 39%. The ratio for the second major cereal, maize, decreases from 61% to 50% in AT2010. Between 2010 and 2100 it was assumed to further decrease to 28 %. The self-sufficiency ratio for total cereals thus decreases from 56% to 50% between 1990 and 2010, and to 40% in the period 2010-2100.
Temperate cereals are most important in China and centrally planned Asian countries, South Asia, Near East in Asia, North Africa and Latin America (Appendix 9c). In the medium scenario the harvested area will begin to decrease in South Asia after 2010, and Latin America (after 2050). The harvested area of temperate cereals for the medium scenario in China and North Africa is nearly stable.
Major rice growing areas are in Asia (Appendix 10c). Because of the decreasing per caput food demand and the high assumed growth rates in rice yields, the harvested areas will decrease according to the medium scenario in East Asia, China and South Asia after 2010, while the area is nearly stable between 1990 and 2010. In the medium scenario important increases in the harvested area occur in Sub-Saharan Africa. In the high scenario even a decrease of the harvested area is projected for East Asia, China and South Asia between 1990 and 2010.
Maize shows a major growth mainly because of the growing demand for feed. Major maize growing regions are China and C.P. Asian countries, Sub-Saharan Africa and Latin America (Appendix 11c). In China an important increase in the harvested maize area occurs even according to the high yield scenario. Sub-Saharan Africa shows a decreasing harvested area after 2050 in the medium scenario and much earlier in the high scenario. The harvested area of maize also begins to decrease in Latin America after 2025 in the medium yield scenario.
Sorghum and millet are most important in South Asia and Sub-Saharan Africa (Appendix 12c). In South Asia the harvested area will begin to decrease from 1990 onwards, while in Sub-Saharan Africa the decrease in harvested area begins only in 2050 according to the medium scenario.
According to the medium scenario for all developing countries the harvested area of pulses will increase by 0.5% in the period 1990-2010, with nearly no change in area between 2010 and 2025, and decrease 0.7% per year in the period 2025-2050 (Table 10). This decrease will continue after 2050 according to the medium scenario. The most important regions for pulses are South Asia and Sub-Saharan Africa (Appendix 13c). According to the medium scenario for South Asia the harvested area will start to decrease after 2010, while in Sub-Saharan Africa the area starts to decrease much later, after 2050.
The harvested area in the medium scenario for all developing countries shows an increase rate of 0.8% per year in the period 1990-2010, 0.6% in 2010-2025 and a steady decrease of 0.2% per year (2025-2050) to 0.9% per year (2050-2100) thereafter (Table 11). The major regions for this group of starchy foods are China and centrally planned countries and Sub-Saharan Africa (Appendix 14c). In China a decrease started in the period 1980-1990, but according to the medium scenario the harvested area is stable in the period 1990-2025, followed by a decrease. In Sub-Saharan Africa the medium scenario shows a decrease in harvested area in the period after 2025.
The harvested area of sugar crops for all developing countries will increase steadily during the whole projection period according to the medium scenario. Increase rates for 1990-2010 (1% per year), 2010-2050 (0.8% per year), and 2050-2100 (0.3%) cause a doubling of the harvested area in 100 years. Even in the high-yield scenario the harvested area will show an increase. Sugar cane is by far the dominating sugar crop in all regions. Only in the Near East in Asia is sugar beet dominant. The major regions for sugar cane are South Asia and Latin America. In South Asia the increase rate is higher than the average for all developing countries in all scenarios, while in Latin America it is lower than average. All other regions show major increases in harvested area throughout the projection period.
The overall increase in area for oil crops and other crops estimated from the total production and yield scenarios followed are not presented here.
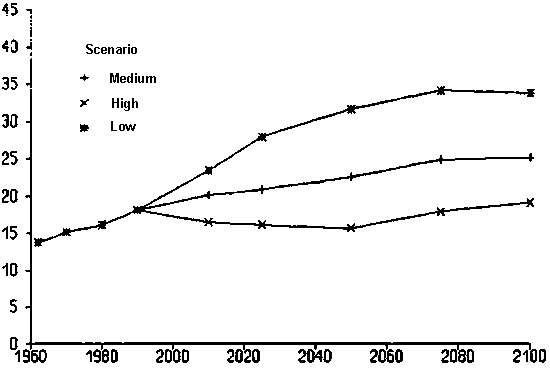
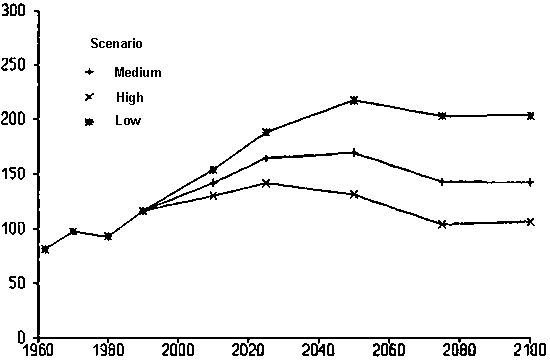
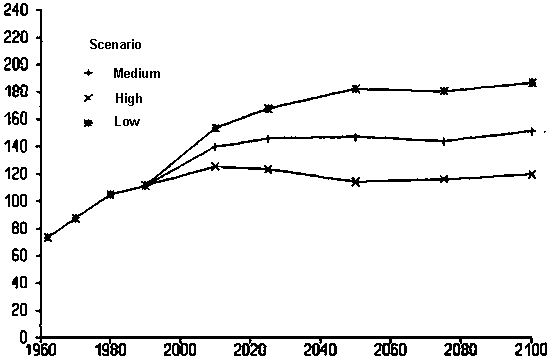
In all developing countries the harvested area increased from 665 Mha in 1980 to 726 Mha in 1990 (Table 13). According to the medium scenario the area will increase further to 831 Mha in 2010, followed by a slow increase until 2050 when a maximum of 890 Mha has been reached (Table 13). The growth rates for the period 1960-1990 are 0.8-0.9% per year. The annual increase for the medium scenario is 0.7% per year for 1990-2010 and 0.4% per year for 2010-2025. The total harvested area will increase in all regions in the period 1990-2010 according to the medium scenario (Figure 2). The growth in the 1990-2010 period compared to 1960-1990 in China and centrally planned Asia is accelerated, while in all other regions the growth rate seems to be on the decline.
In particular, Sub-Saharan Africa and Latin America will show a fast increase of the harvested area in the first 20-year period of the medium scenario (about 1% per year). In Sub-Saharan Africa this increase rate is maintained in the period 2010-2025, and slows down in the periods after 2025. In Latin America the annual growth declines after 2010 to low values of 0.3% per year (2010-2025). The increase in the harvested area according to the medium scenario in North Africa is much lower in 1990-2010 (0.5% per year) than in 1980-1990 (1.2% per year) or 1960-1990 (1.0% per year). After 2010 the increase rate remains stable at levels of 0.2-0.3% per year. Similarly, in the medium scenario for the Near East in Asia the increase in 1990-2010 (0.8% per year) is much lower than in the period 1980-1990 (1.4% per year). After 2010 the increase rate declines further to 0.7% per year in 2010-2025 and 0.2% per year in 2025-2050.
FIGURE 2
Historical total harvested areas and calculated future harvested areas for three scenarios. Areas in million ha.
a. East Asia
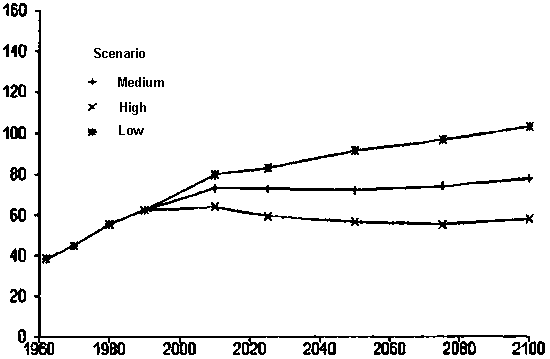
b. China and C. P. Asian countries
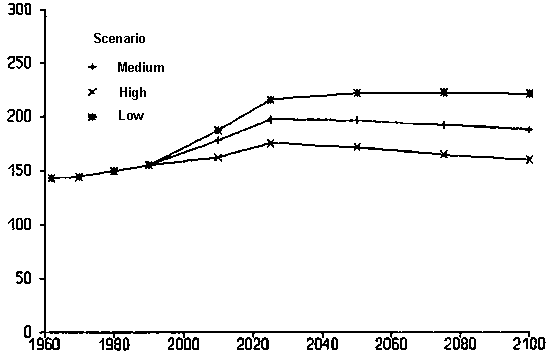
c. South Asia
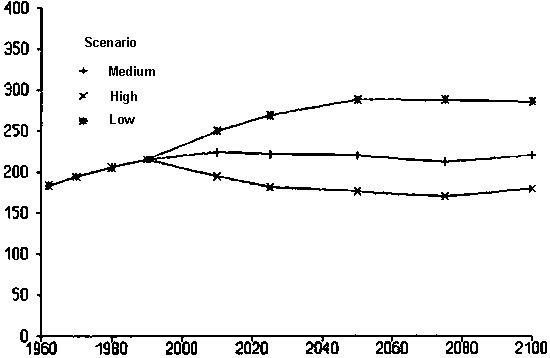
d. Near East in Asia
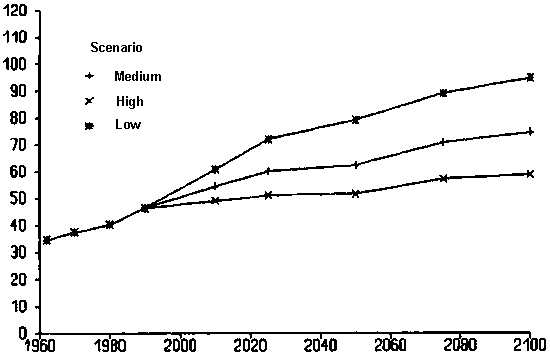
e. North Africa
f. Sub-Saharan Africa
g. Latin America
h. All developing incl. China
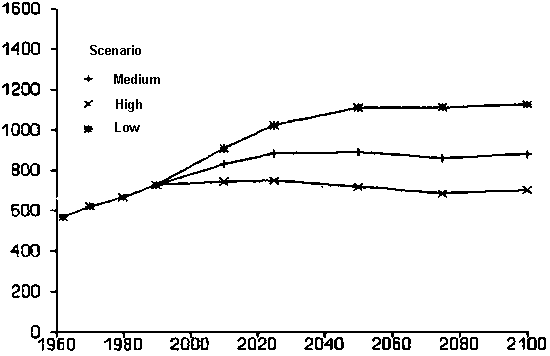
TABLE 13
Total harvested areas for three scenarios in the developing countries. M, H, L = medium, high and low scenario. Areas in 106 ha
|
|
'61/63 |
'69/71 |
'79/81 |
1989BYa |
'89/91 |
2010 |
2025 |
2050 |
2075 |
2100 |
|
ALL DEVELOPING INCL. CHINA | ||||||||||
|
Medium |
569 |
621 |
665 |
|
726 |
831 |
892 |
892 |
870 |
892 |
|
High |
|
|
|
|
|
742 |
749 |
723 |
698 |
720 |
|
Low |
|
|
|
|
|
908 |
1023 |
1111 |
1113 |
1128 |
|
Medium, low feed |
|
|
|
|
|
820 |
860 |
855 |
828 |
848 |
|
Medium, high feed |
|
|
|
|
|
838 |
909 |
952 |
935 |
963 |
|
ALL DEVELOPING EXCL. CHINA | ||||||||||
|
Medium |
426 |
477 |
516 |
584 |
570 |
653 |
685 |
696 |
678 |
704 |
|
High |
|
|
|
|
|
580 |
573 |
551 |
534 |
560 |
|
Low |
|
|
|
|
|
721 |
808 |
890 |
891 |
907 |
|
Medium, low feed |
|
|
|
|
|
643 |
669 |
668 |
646 |
670 |
|
Medium, high feed |
|
|
|
|
|
659 |
703 |
741 |
727 |
759 |
a 1989BY = base year estimate of AT2010. For China only projections of production are available, not of areas harvested.